1–
The mass-metallicity relation for high-redshift damped Ly galaxies
Abstract
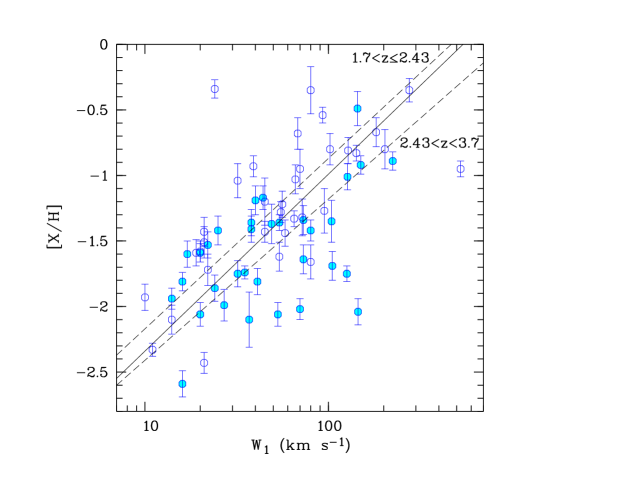
We used our database of ESO VLT-UVES spectra of quasars to build up a sample of 67 Damped Lyman- (DLA) systems with redshifts . For each system, we measured average metallicities relative to Solar, [X/H] (with either , S or Si), and the velocity widths of low-ionization line profiles, . We find that there is a tight correlation between the two quantities, detected at the significance level. The existence of such a correlation, over more than two orders of magnitude spread in metallicity, is likely to be the consequence of an underlying mass-metallicity relation for the galaxies responsible for DLA absorption lines. The best-fit linear relation is with expressed in km s-1. While the slope of this velocity-metallicity relation is the same within uncertainties between the higher and the lower redshift bins of our sample, there is a hint of an increase of the intercept point of the relation with decreasing redshift. This suggests that galaxy halos of a given mass tend to become more metal-rich with time. Moreover, the slope of this relation is consistent with that of the luminosity-metallicity relation for local galaxies. The DLA systems having the lowest metallicities among the DLA population would therefore, on average, correspond to the galaxies having the lowest masses. In turn, these galaxies should have the lowest luminosities among the DLA galaxy population. This may explain the recent result that the few DLA systems with detected Ly emission have higher than average metallicities.
keywords:
galaxies: halos, galaxies: high redshift, quasars: absorption lines, cosmology: observations1 Observations
Most of the DLA systems in our sample (with total neutral hydrogen column densities H i) were observed at the ESO Very Large Telescope (VLT) with UVES between 2000 and 2003 to search for H2 molecules at (Petitjean et al. 2000; Ledoux et al. 2003). The absorption line analysis was homogeneously performed using standard Voigt-profile fitting techniques. Average DLA metallicities relative to Solar, [X/HXHXH, were calculated as the sum of the column densities measured in individual components of the absorption profiles, with XZn as the reference element when Zn ii is detected, or else either S or Si. One notable characteristics of this large dataset is that it samples well both the low and the high ends of the DLA metallicity distribution, from [X/H up to about half of Solar.
For each DLA system, we also measured the velocity widths of the metal absorption line profiles. Low-ionization transition lines that are not strongly saturated were selected (see Prochaska & Wolfe 1997; Wolfe & Prochaska 1998). For high-ionization lines, the velocity width could be dominated by extended galaxy halos and galactic winds. We calculated the velocity width of the selected profiles as the second moment of the distribution of apparent optical depth along these profiles.
2 DLA velocity-metallicity correlation
The correlation between DLA low-ionization metal line width and average metallicity, as observed in Fig. 1, over more than two orders of magnitude spread in metallicity, can be understood as the consequence of an underlying mass-metallicity relation for the galaxies responsible for DLA absorption lines. We fitted the data using the linear least-squares bisector method. For DLA systems with redshifts larger (resp. smaller) than the median redshift of our sample, we find at (resp. at ).
While the slope of the DLA velocity-metallicity relation is the same within uncertainties between the higher and the lower redshift bins of our sample, there is a hint of an increase of the intercept point of the relation with decreasing redshift. This is linked to an increase of the mean DLA metallicity with decreasing redshift, with [X/H (resp. [X/H) in the higher (resp. lower) redshift bin of our sample (see also Prochaska et al. 2003). This suggests that galaxy halos of a given mass (resp. a given metallicity) tend to become more metal-rich (resp. less massive) with time. This is consistent with the recent result by Savaglio et al. (2004) for galaxies selected from the Gemini Deep Deep Survey and the Canada-France Redshift Survey.
The above results are also in agreement with those of Nestor et al. (2003) who found larger metallicity in Sloan Digital Sky Survey (SDSS) DLA composites with larger Mg ii2796 equivalent widths. In addition, these authors showed that, within the large equivalent width regime, the metallicity is larger at lower redshift.
3 Implications and prospects
Haehnelt et al. (1998) performed similar line velocity width measurements on low-ionization lines from DLA systems in simulations and compared them directly to the virial velocities of the underlying dark matter halos ( in a sphere overdense by a factor of 200 compared to the mean cosmic density). They found . According to Haehnelt et al. (2000), the luminosity function of galaxies can be reproduced if a simple linear scaling of the luminosity with the mass of the dark matter halos is assumed, i.e., , where is the galaxy apparent -band magnitude and . Using our linear best-fit to the velocity-metallicity relation for DLA systems (), we get:
| (1) |
where is the -correction in the -band, which should be positive. The slope of this DLA luminosity-metallicity relation is consistent with that derived by Tremonti et al. (2004) for the luminosity-metallicity relation for galaxies selected from the SDSS, . However, the zero points of the two relations are different implying that galaxies of a given luminosity (resp. a given metallicity) are becoming more metal-rich (resp. fainter) with time.
Eq. 1 implies that the more than two orders of magnitude spread in DLA metallicity reflects a more than ten magnitudes spread in DLA galaxy luminosity. In other words, a low metallicity should on average imply a small stellar mass and thus a low luminosity. Even though low-mass galaxies, i.e., gas-rich dwarf galaxies, can undergo periods of intense star formation activity, they show, on average, lower star-formation rates than more massive galaxies (Brinchmann et al. 2004; see also Okoshi et al. 2004). The existence of a DLA mass-metallicity relation may thus explain the fact that the few DLA systems with detected Ly emission have higher than average metallicities (Møller et al. 2004; Christensen et al., in prep.). This should be confirmed by additional deep imaging of the fields of QSOs with selected DLA absorbers.
References
- [Brinchmann et al. 2004] Brinchmann, J., Charlot, S., White, S. D. M., et al. 2004, MNRAS 351, 1151
- [Haehnelt et al. 1998] Haehnelt, M. G., Steinmetz, M., & Rauch, M. 1998, ApJ 495, 647
- [Haehnelt et al. 2000] Haehnelt, M. G., Steinmetz, M., & Rauch, M. 2000, ApJ 534, 594
- [Ledoux et al. 2003] Ledoux, C., Petitjean, P., & Srianand, R. 2003, MNRAS 346, 209
- [Møller et al. 2004] Møller, P., Fynbo, J. P. U., & Fall, S. M. 2004, A&A 422, L33
- [Nestor et al. 2003] Nestor, D. B., Rao, S. M., Turnshek, D. A., & Vanden Berk, D. 2003, ApJ 595, L5
- [Okoshi et al. 2004] Okoshi, K., Nagashima, M., Gouda, N., & Yoshioka, S. 2004, ApJ 603, 12
- [Petitjean et al. 2000] Petitjean, P., Srianand, R., & Ledoux, C. 2000, A&A 364, L26
- [Prochaska & Wolfe 1997] Prochaska, J. X., & Wolfe, A. M. 1997, ApJ 487, 73
- [Prochaska et al. 2003] Prochaska, J. X., Gawiser, E., Wolfe, A. M., Castro, S., & Djorgovski, S. G. 2003, ApJ 595, L9
- [Savaglio et al. 2004] Savaglio, S., Glazebrook, K., Le Borgne, D., et al. 2004, in Popescu C. C., Tuffs R. J., eds., Proc. “The Spectral Energy Distribution of Gas-Rich Galaxies”. [astro-ph/0412041]
- [Tremonti et al. 2004] Tremonti, C. A., Heckman, T. M., Kauffmann, G., et al. 2004, ApJ 613, 898
- [Wolfe & Prochaska 1998] Wolfe, A. M., & Prochaska, J. X. 1998, ApJ 494, L15