Kinematics, ages and metallicities for F and G type stars in the solar neighbourhood
Abstract
A new metallicity distribution and an age-metallicity relation are presented for 437 nearby F and G turn-off and sub-giant stars selected from radial velocity data of Nidever et al. Photometric metallicities are derived from photometry, and the stellar ages from the isochrones of Bergbusch & VandenBerg as transformed to photometry using the methods of Clem et al.
The (stellar-population) criterion of Schuster et al., which combines both kinematic and metallicity information, provides 22 thick-disk stars. km s-1, km s-1 and dex for these thick-disk stars, which is in agreement with values from previous studies of the thick disk. -element abundances which are available for some of these thick-disk stars show the typical -element signatures of the thick disk, supporting the classification procedure based on the criteria.
Both the scatter in metallicity at a given age and the presence of old, metal-rich stars in the age-metallicity relation make it difficult to decide whether or not an age-metallicity relation exists for the older thin-disk stars. For ages greater than 3 Gyr, our results agree with the other recent studies that there is almost no correlation between age and metallicity, (age) dex Gyr-1. For the 22 thick-disk stars there is a range in ages of 7–8 Gyr, but again almost no correlation between age and metallicity.
For the subset of main-sequence stars with extra-solar planets the age-metallicity relation is very similar to that of the total sample, very flat, the main difference being that these stars are mostly metal-rich, dex. However, two of these stars have dex and have been classified as thick-disk stars. As for the total sample, the range in ages for these stars with extra-solar planetary systems is considerable with a nearly uniform distribution over age Gyr.
keywords:
Galaxy : solar neighbourhood, stars : kinematics, stars : abundance.1 Introduction
Metallicity, kinematic, and age data of F and G type stars are of fundamental importance to study the metallicity distribution and the age-metallicity relation of the Galactic disk. These F and G stars are unique objects for studies of the history of the Galactic disk in the sense that photometric systems, such as the Strömgren-Crawford , can be used to derive many of their physical parameters, such as the interstellar reddening, metallicity, and age. Also, the combined information of stellar photometric abundances and kinematics can be used to separate stellar populations and to summarize the main properties of a given population.
With this aim, based on the accurate radial velocity observations of Nidever et al. (2002), a data set has been created which includes parallaxes, proper motions, and photometry of late-F, G and K stars. Accurate parallaxes and proper motions have become available for large numbers of these stars from the and catalogues (ESA 1997) and –2 (Hog et al. 2000) catalogue. With this data set, which is large compared to the sample of Edvardsson et al. (1993), but small compared to the samples of Feltzing, Holmberg & Hurley (2001) and Nordström et al. (2004), the metallicity distribution and age-metallicity relation in the solar vicinity are determined. Much effort has been devoted to the determination of reliable individual isochrone ages for our sample of stars. For this task, the isochrones of Bergbusch & VandenBerg (2001) and VandenBerg (2003) as transformed to the system by the empirically constrained colour-temperature relations of Clem et al. (2004), are adopted.
The sample of Nidever et al. (2002) contains 889 stars from the Doppler planet search project at the Keck and Lick Observatories (Butler et al. 2000, Vogt et al. 2000). This sample contains mostly main-sequence and sub-giant stars from F7 to M5, within 50 pc. Chromospherically active stars have been removed from this list as well as stars with known stellar companions within 2 (including known spectroscopic binaries). This list provides several advantages for our study of the age-metallicity relation: (a) it includes many cooler dwarf stars and so avoids one of the selection affects discussed by Feltzing et al. (2001); when these cool dwarfs are left out of a sample, the old, metal-rich stars are preferentially excluded depleting the upper right-hand corner of an age-metallicity diagram. (b) the radial velocities are especially accurate (systematic errors km s-1) and precise (random errors km s-1) (Nidever et al. 2002) providing us with especially good kinematic data for these stars allowing us to separate more cleanly the stellar populations within the sample, such as the separation between the thin- and thick-disk stars. (c) As suggested by Giménez (2000) the photometry can be used to refine the survey lists of planetary-search projects and to study the metallicities and ages of stars found to have planets.
This paper is organized as follows: Section 2 describes the data; in Section 3 the calculation procedure for the space velocities is given; the derivation of astrophysical parameters: reddening, metallicity, absolute magnitudes, and ages is given in Section 4, plus age-metallicity diagrams and a discussion of these; and finally the conclusions in Section 5.
2 Data
2.1 Photometry
For the 889 stars in the catalogue of Nidever et al. (2002), photometry of 437 stars and photometry for 214 have been collected from the web site of the General Catalogue of Photometric Data111http:// obswww.unige.ch/gcpd/gcpd.html of Hauck & Mermilliod (1998). This photometry (, , , ) of these 437/214 stars are given in Cols. 2–5 of Table 1, respectively. In Table 1 this photometry of the 437 F and G main-sequence, turn-off and sub-giant stars covers the ranges , , . The 214 stars with values fall in the range, . Visual magnitudes for our sample stars, all brighter than mag, and colours, given in Cols. 7–8 of Table 1, respectively, were taken from the and Reference Catalogues (ESA 1997).
| Name | |||||||||
|---|---|---|---|---|---|---|---|---|---|
| HD 377 | 0.391 | 0.204 | 0.322 | - | 0.004 | 7.59 | 0.626 | 4.55 | -0.02 |
| HD 400 | 0.332 | 0.147 | 0.386 | 2.615 | -0.014 | 6.21 | 0.524 | 3.61 | -0.35 |
| HD 1388 | 0.382 | 0.186 | 0.346 | - | 0.001 | 6.51 | 0.599 | 4.41 | -0.08 |
2.2 Radial Velocities, Parallaxes and Proper Motions
The barycentric radial velocities , with a typical accuracy of km s-1, were taken from Nidever et al. (2002). Parallaxes (), the proper motion components (, ) and their associated uncertainties were taken mainly from the and catalogues (ESA 1997) and –2 catalogue (Hog et al. 2000). Parallaxes and their uncertainties for three stars (HD 185295, HD 192020 and HD 1854) not found in the and catalogues were taken from the catalogue of Kharchenko (2001). The radial velocities , parallaxes (), proper motion components (, ) and their associated uncertainties are listed in Table 2. Most of the parallaxes in our sample have relative errors that are much less than 20 per cent. In Tables 1–3 those stars with extra-solar planetary systems have a “P” after their HD number in Col. 1; these stars are discussed further in Section 4.4 and especially in Fig. 9c.
| Star Name | |||||||
|---|---|---|---|---|---|---|---|
| (mas yr-1) | (mas yr-1) | (mas) | (km s | (km s | (km s | (km s | |
| HD 377 | 87.260.93 | -0.900.53 | 25.150.97 | 1.18 | -14.41 | -7.07 | -3.79 |
| HD 400 | -114.720.53 | -124.600.43 | 30.260.69 | -15.14 | 27.64 | -10.36 | -7.85 |
| HD 1388 | 396.971.09 | -0.600.53 | 38.240.85 | 28.50 | -42.81 | -16.06 | -33.82 |
2.3 Comparison of our sample with other samples
Our sample was selected based on the existence of accurate radial velocities for 889 FGKM main-sequence and sub-giant stars of Nidever et al. (2002). The sample used in this work is reduced to only 437 stars, for which photometry is available, to be able to determine a photometric metallicity for each star. Our sample is free from binary contamination according to Nidever et al. (2002). The accurate radial velocities of Nidever et al. (2002) are suitable for the detection of extra-solar planets, and so the high accuracy of their radial velocities offers us an opportunity to derive very good kinematic parameters and thus the age-metallicity relations for sub-classes of F and G stars.
Compared with the samples of Edvardsson et al. (1993) and Chen et al. (2003), the size of our sample is large, whereas compared to the samples and metallicity distributions of Feltzing et al. (2001) and Nordström et al. (2004), the size of our sample is small but covering a wide metallicity range, [M/H] dex, with a very high percentage of the stars having [M/H] dex. Our sample is not affected by one of the main biases discussed by Feltzing et al. (2001) in the sense that old, metal-rich stars are amply represented (see Fig. 9 below); the presence of these old, metal-rich stars produces an age-metallicity relation very similar to other modern age-metallicity relations, such as those mentioned above.
One advantage of having accurate radial velocities for our sample together with the dex uncertainty in [M/H] (Schuster & Nissen 1989, and see Section 4.3 below) is that it allows us to determine well the cut-offs of the stellar populations from and [M/H], where is the stellar-population criterion defined in Schuster, Parrao & Contreras-Martínez (1993), a linear combination of and [M/H].
3 Galactic Space Velocities
Galactic space velocity components (, , ) were computed by applying the algorithms and the transformation matrices of Johnson & Soderblom (1987) to the basic data: celestial coordinates (, ), proper motion components (, ), the radial velocity and the parallax () of each star in Table 2, where the epoch of J2000 was adopted as described in the International Celestial Reference System (ICRS) of the and Catalogues. The transformation matrices use the notation of a right-handed system. Therefore, , , are the components of a velocity vector of a star with respect to the Sun, where is positive toward the Galactic center (); is positive in the direction of the Galactic rotation (); and is positive toward the north Galactic pole (). , , velocities are heliocentric. The velocity components have been corrected for the local solar motion km s-1 with respect to the local standard of rest (LSR, Allen & Santillan 1991)
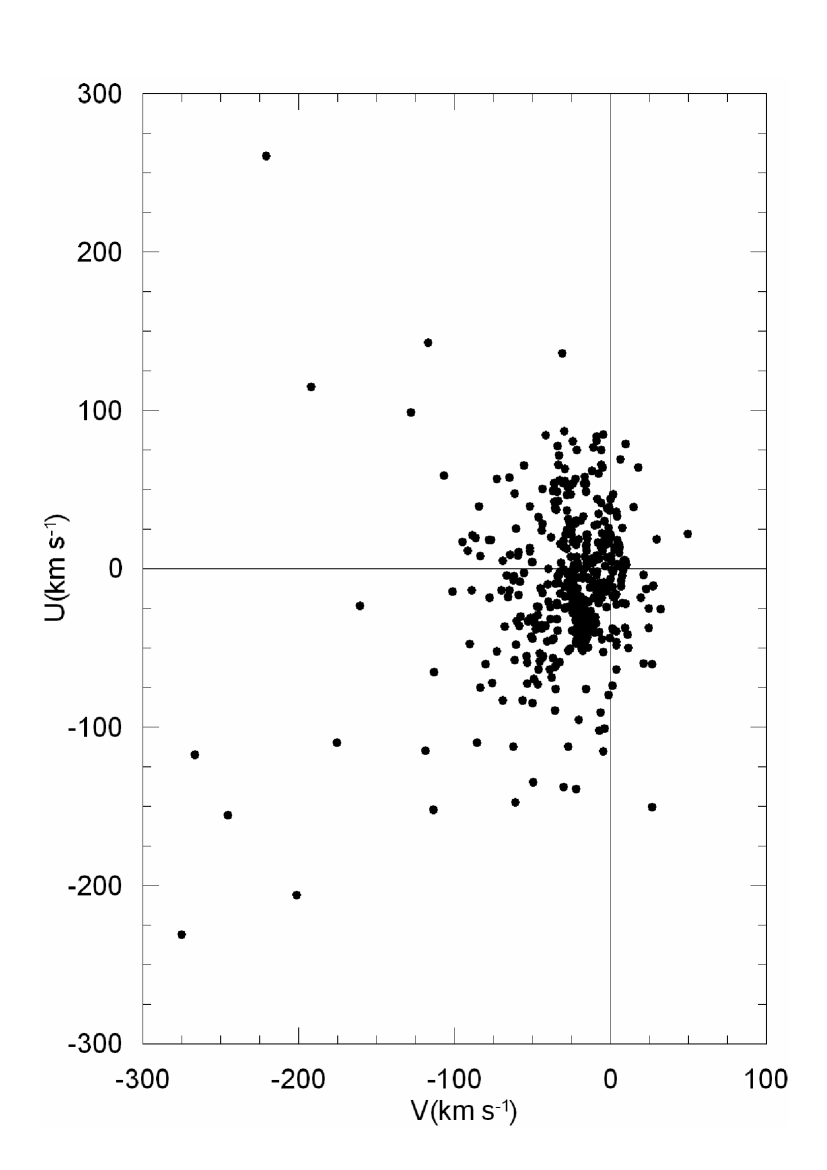
The distribution of these Galactic heliocentric velocities on the plane is displayed in Fig. 1. This Bottlinger diagram shows a strong concentration around km s-1 and 50 km s-1, where disk-like components dominate. However, Fig. 1 also shows more halo-like components having 100 km s-1 and km s-1. Fig. 1 shows that there exist no extreme retrograde velocities in our sample; only three stars are retrograde, and these all have km s-1 (Compare to Fig. 3 of Schuster et al. 1993).
4 Derivation of astrophysical parameters
4.1 Reddening
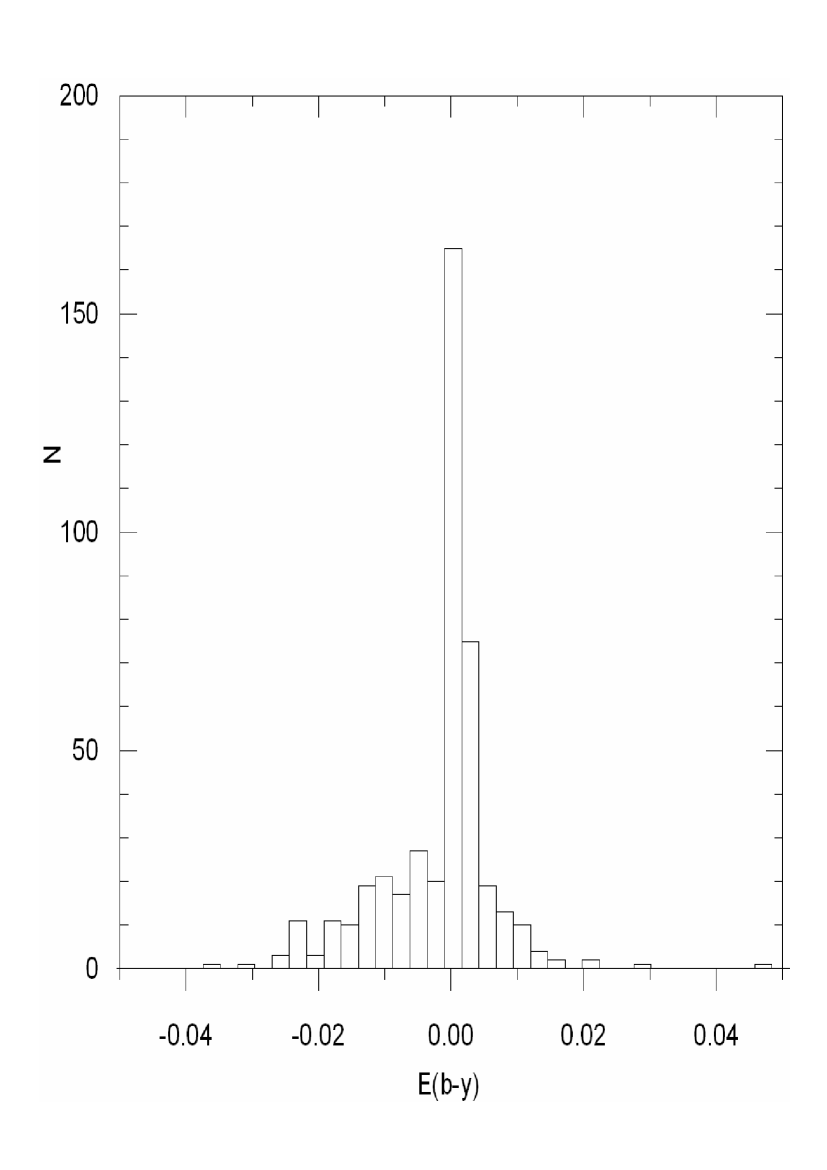
The interstellar extinction for our sample stars has been measured due to its effect on the derivation of the metallicities and absolute magnitudes. of 214 stars with were estimated from an intrinsic colour calibration of vs (Schuster & Nissen 1989). A few iterations were made to obtain , with a consistency of for . For 223 stars which lack , was obtained from the Schlegel, Finkbeiner & Davis (1998) reddening maps. We adopt a band absorption and assume that the dust layer has a scale height pc. Thus, the reddening for a given star is reduced compared to the total reddening by a factor , where b and d are the Galactic latitude and distance, respectively. Note, however, that Arce & Goodman (1999) caution that Schlegel et al. (1998) reddening maps overestimate the reddening values when the colour excess is more than 0.15 mag. Hence, we have adopted (Schuster et al. 2004) a slight revision of the Schlegel et al. (1998) reddening estimates, via an equation, when , otherwise , where indicates the adopted reddening estimate. Figure 3 of Schuster et al. (2004) shows that there is no significant systematic difference between the reddenings obtained from these two methods, the intrinsic colour calibration and the reddening maps. The final adopted values of 223 stars are transformed into via the equation given by Crawford (1975).
Fig. 2 shows the distribution of the 437 stars. As expected, the stars with a median distance of 36 pc show a strong peak at about , with somewhat asymmetric wings, the negative tail being slightly bigger than the positive, displaced only 0.005 mag from symmetry. Reddenings less than 0.015 are mostly due to the observational errors of the photometry (Nissen 1994). For our final sample, reddening corrections have been applied to only six stars, those with ; for all the remaining stars no reddening correction has been applied. For these six stars, the indices and are dereddened by the relations, and , given by Crawford (1975). The final reddenings, , are given in Col. 6 of Table 1.
4.2 Absolute magnitudes
The absolute visual magnitudes, , are needed to determine the ages of stars in our sample from the , plane. Although relative errors () of parallaxes of the stars in Table 2 are less than 0.20, the Lutz-Kelker correction (Lutz & Kelker 1973) has been applied to the absolute magnitudes of our sample using the following relation constructed from their data:
| (1) |
where , , , .
The relation allows us to determine absolute magnitudes when parallaxes of the stars in our sample are available. Here, magnitude is corrected for reddening using . The absolute magnitudes of our sample are presented in Col. 9 of Table 1.
4.3 The metallicity distribution and the separation of population types
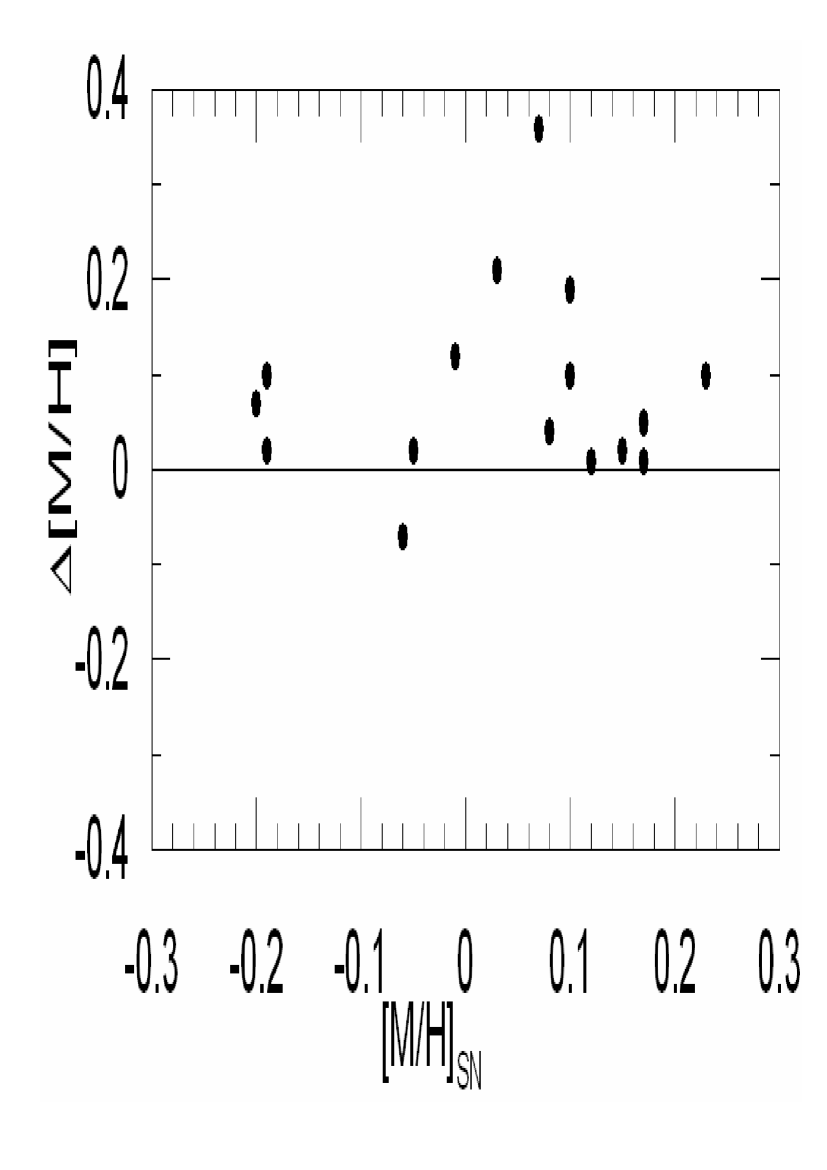
In order to estimate the metallicities of our sample stars from the photometry presented in Table 1, the metallicity ([Fe/H]) calibrations of Schuster & Nissen (1989) have been used. We assume here that . However, Twarog, Anthony-Twarog & Tanner (2002) report that the metallicity calibration of G stars given by Schuster & Nissen (1989) has a systematic error that is strongly colour dependent, reducing the estimated [M/H] for stars above dex for the very reddest stars, . Martell & Laughlin (2002) give an improved metallicity relation for F, G and early K stars. In order to see this systematic effect, in Fig. 3 the differences between the metallicities derived from Martell & Laughlin (2002) minus those from Schuster & Nissen (1989) have been plotted versus those derived from the Schuster & Nissen (1989) formulae. In Fig. 3 it is worth noting that only the stars with and dex, show a significant difference, increasing to a maximum at dex and then decreasing again. So, for the final metallicities of this paper, the [Fe/H] calibration given by Martell & Laughlin (2002) has been applied to only the stars with and dex; for the remaining stars, the metallicities estimated via the formulae of Schuster & Nissen (1989) are adopted. The metallicities of our stars are given in the Col. 10 of Table 1.
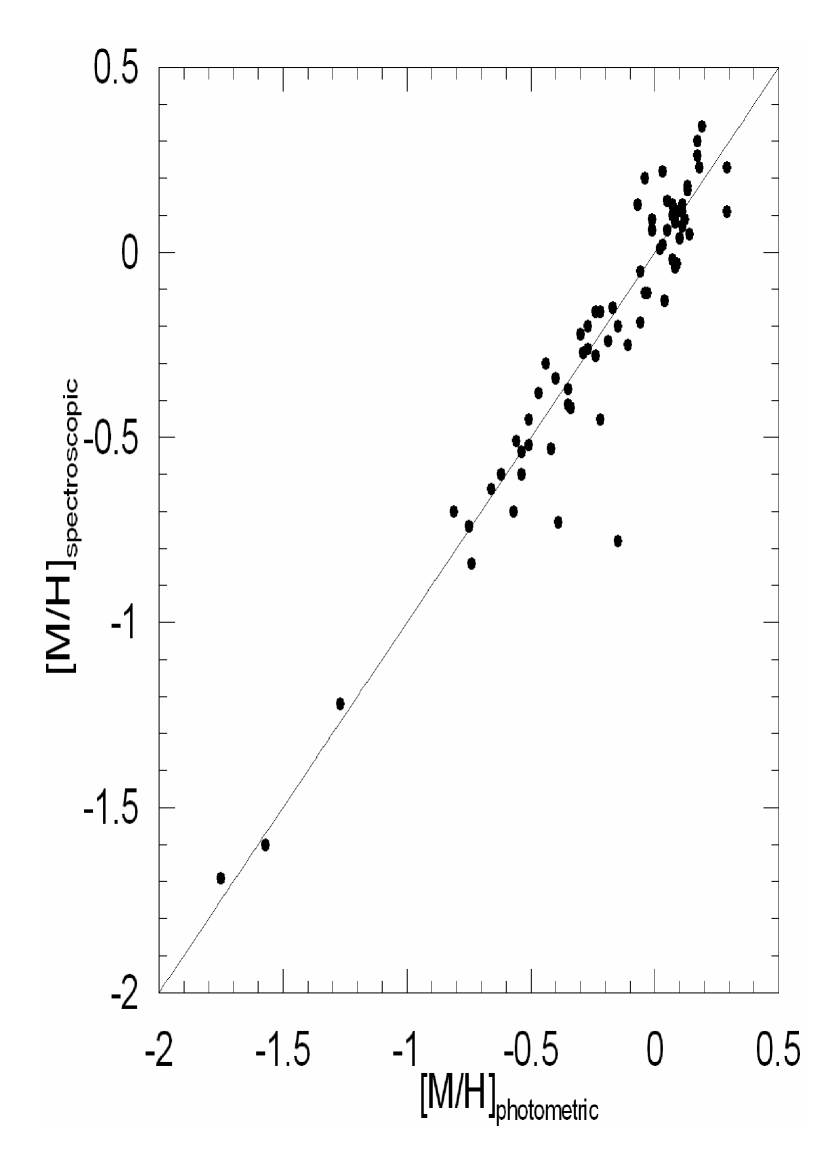
In Fig. 4, for 71 stars, our photometrically derived [M/H] values are plotted against the spectroscopic values of the Cayrel de Strobel, Soubrian & Ralite (2001) catalogue. A least square fit to the points of Fig. 4 yields a regression curve of for the metallicity range [M/H] dex. The agreement is excellent with a scatter of , excluding the large deviation of HD 202573, which is a giant star (Henry et al. 2000) and which is outside the range of the Schuster & Nissen (1989) [Fe/H] calibrations.. It is clear from Fig. 4 that accurate metal abundances can be derived from photometry, using the combined calibrations as described above.
For the empirical [Fe/H] calibrations of Schuster & Nissen (1989) the estimated standard deviations of a single photometric determination of [Fe/H] were at [Fe/H] dex, and at [Fe/H] dex. Comparisons by Feltzing et al. (2001) of photometric abundances from the Schuster & Nissen (1989) calibration equations with abundances from two recent spectroscopic studies Edvardsson et al. (1993) and Chen et al. (2000) have shown that these error estimates are overly conservative; they find a scatter of only for their more metal-rich group, in very good agreement with the value of found above from a somewhat less homogeneous spectroscopic data set.
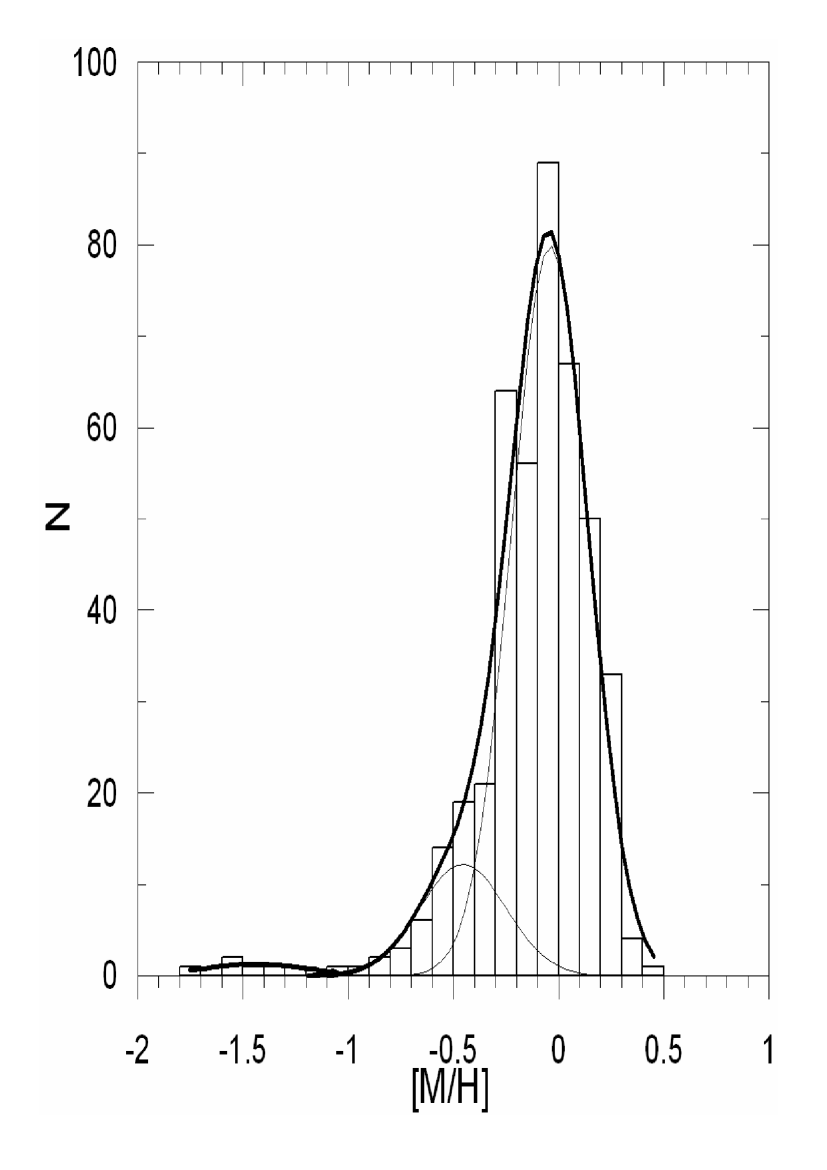
In Fig. 5 the distribution of metallicity, [M/H], for our sample stars is presented, and also shown is a fit to the histogram using three Gaussians. The sample is mix of all the stellar populations that are represented in the solar neighbourhood, the thin and thick disks, and the halo. As is expected, in the solar neighbourhood, the majority of the stars belong to the disk with the thin disk dominating, a significant but smaller contribution from the thick disk, and only a few halo stars (; see Fig. 6 below). In Fig. 5 two main components can be seen, one with dex (the disk contribution: thin plus thick) and the other with dex (mostly the halo stars). A rough Gaussian fit has been made to this metallicity histogram using the mathematical package ‘Origin’ 222http:// www.originlab.com. One disk-like component has dex, a dispersion of , and is nearly symmetric. Our sample contains an obvious contribution from the thick disk with a Gaussian having a mean abundance of dex and a dispersion of . There are eight halo stars with dex (see also Fig. 6). Nevertheless, thin and thick-disk stars are not clearly distinguishable from Fig. 5. There exists no clean, straightforward procedure for separating the stars of these different disk populations, which overlap considerably in the metallicity distribution. Kinematics are usually invoked to improve the thin/thick disk separation, and more recently [] abundances (see for example, Bensby, Feltzing & Lundström 2003).
| Name | [Mg/Fe] | [Si/Fe] | [Ca/Fe] | [Ti/Fe] | Refs. | |||||
|---|---|---|---|---|---|---|---|---|---|---|
| (km s-1) | ||||||||||
| HD 3795 | 145 | -18 | -0.39 | -0.59 | 0.31 | 0.22 | 0.24 | 0.29 | 0.27 | 1 |
| HD 16623 | 143 | -16 | -0.50 | -0.60 | 0.25 | 0.10 | -0.02 | 0.00 | 0.08 | 2 |
| HD 19034 | 166 | -20 | -0.41 | |||||||
| HD 22879 | 149 | -12 | -0.74 | -0.84 | 0.40 | 0.27 | 0.27 | 0.31 | 0.31 | 1 |
| HD 29587 | 185 | -20 | -0.59 | -0.61 | 0.31 | 0.17 | 0.17 | 0.19 | 0.21 | 1 |
| HD 30649 | 155 | -16 | -0.56 | -0.50 | 0.08 | 3 | ||||
| HD 32387 | 173 | -19 | -0.55 | |||||||
| HD 37213 | 179 | -20 | -0.50 | |||||||
| HD 63077 | 174 | -14 | -0.81 | -0.83 | 4 | |||||
| HD 65583 | 146 | -14 | -0.62 | -0.67 | 0.28 | 0.38 | 0.29 | 0.13 | 0.27 | 5 |
| HD 68017 | 174 | -21 | -0.42 | -0.42 | 0.31 | 0.21 | 6 | |||
| HD 88725 | 202 | -21 | -0.65 | -0.70 | 0.32 | 0.26 | 0.19 | 0.25 | 0.26 | 5 |
| HD 101259 | 128 | -19 | -0.23 | |||||||
| HD 102158 | 116 | -13 | -0.47 | -0.46 | 4 | |||||
| HD 104556 | 74 | -11 | -0.30 | -0.64 | 7 | |||||
| HD 111515 | 151 | -15 | -0.58 | -0.52 | 4 | |||||
| HD 114729P | 148 | -15 | -0.56 | -0.25 | 8 | |||||
| HD 114762P | 165 | -14 | -0.75 | -0.70 | 0.43 | 0.32 | 0.20 | 0.24 | 0.30 | 5 |
| HD 144579 | 176 | -18 | -0.63 | -0.70 | 0.37 | 0.28 | 6 | |||
| HD 218209 | 188 | -21 | -0.54 | -0.43 | 0.19 | 0.18 | 6 | |||
| HD 221830 | 122 | -13 | -0.51 | -0.45 | 0.32 | 0.22 | 0.19 | 0.28 | 0.25 | 1 |
| HD 230409 | 118 | -6 | -0.84 | -1.00 | 4 |

In Fig. 6 the , [M/H] diagram for our sample stars is plotted. Two components are clearly noted: the halo component, 100 km s-1 and dex; the other disk-like, centered at 215 km s-1 and [M/H] dex. The rotation velocity of the LSR about the Galactic center is taken here to be 220 km s-1 so that 220 km s-1 is the rest-frame rotation velocity of a given star (Kerr & LyndenBell 1986). More modern values for the circular speed of the Milky Way at the solar circle are somewhat larger, such as km s-1 given by Fukugita & Peebles (2004). Here, is the velocity with respect to the LSR. It can be seen from Fig. 6 that the majority of the stars have 200 km s-1 and dex. These stars are thin-disk stars. Even though there is scarcity of stars with dex and 150 km s-1, increases approximately linearly with [M/H] between dex. For the dex, it appears that there is no correlation between [M/H] and , but there are too few stars for any firm conclusion.
This , [M/H] diagram can be used to separate out the different stellar populations, as discussed in Nissen & Schuster (1991) and in Schuster et al. (1993). In the former reference, a diagonal cut connecting ([M/H], km s-1) and km s-1) was used to separate halo stars from ‘high-velocity disk’ stars. In the latter reference, the parameter “” was defined, which is a linear combination of and [M/H], and is used to make other diagonal cuts which isolate more cleanly the thick-disk stars. Our most recent work (Schuster et al. 2005) indicates that the range gives a fairly clean thick-disk sample, with only small contamination by the halo and old thin disk. In Schuster et al. (1993) the cut was used to define an even cleaner thick-disk sample, but here too few stars are found in this reduced interval.
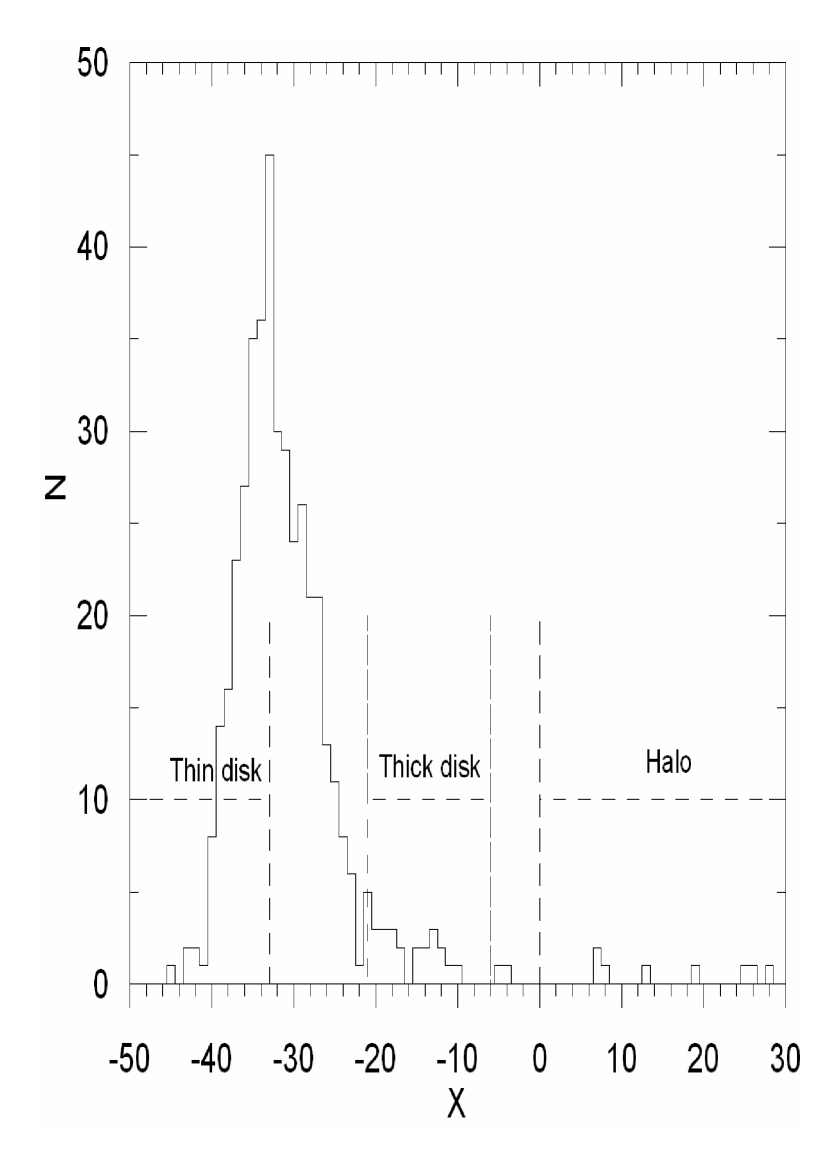
The criterion provides a cleaner separation of the thin- and thick-disk components even though they overlap considerably in both and . Using the definition of given by Schuster et al. (1993), combining and [Fe/H], the values of the stars have been calculated. The distribution of the stars is given in Fig. 7.
Comparing our distribution with the one plotted by Schuster et al. (1993), constructed from a larger data base, cut-offs for the three stellar components are fixed for Fig. 7. The number of stars in the thick-disk sample, defined by the range, , is 22. These limits for the thick disk have been derived from the work of Schuster et al. (1993) and from a project that is in process (Schuster et al. 2005). The thin disk dominates for , and the halo with a small fraction of the total extends for . These fixed cut-offs of three stellar populations are indicated as dashed vertical lines on Fig. 7.
The vertical velocity dispersion, km s-1 (error calculated according to Appendix E of Taylor 1997), is estimated for the range , where the thick disk dominates. This value is less than the km s-1 of Schuster et al. (1993), but is in agreement with the range of 30–37 km s-1 given by Norris (1987), Croswell et al. (1991), and Carney, Latham & Laird (1989). Other values, km s-1 and dex (mean errors) for this thick-disk sample are in concordance with the mean values given in the literature, such as in Schuster et al. (1993).
Our thick-disk sample defined by the range, , is given in Table 3 together with the kinematic and abundance data. The -element and spectroscopic [Fe/H] abundances of some stars have been found in the literature. It can be seen from Table 3 that spectroscopic [Fe/H] abundances are in good agreement with the photometric ones. The mean values of seven thick-disk stars, except HD 16623 are constant at a level of 0.27 dex, which are overabundant relative to thin disk stars, over the spectroscopic metallicity range from -0.45 to -0.84 dex (See Fig. 1.4 in Nissen 2004, Fig. 4 in Nissen & Schuster 1997, Fig. 13 in Bensby et al. 2003, and Fig. 8 in Bensby et al. 2005).
[Mg/Fe] abundances of stars with thick-disk kinematics in Table 3, which fall in the range dex are similar to those of the thick disk found in the literature. The trend of -capture elements like Mg, Si, Ca, and Ti with photometric [M/H] (or spectroscopic [Fe/H]) abundances of thick-disk stars in Table 3 agrees well with the findings of Nissen & Schuster (1997) and Bensby et al. (2005). Also, the -element abundances of thick-disk stars, which are available in Table 3, support the classification procedure based on criteria defined by Schuster et al. (1993).
The only expection might be HD 16623; its is low by a factor of 1.5 relative to the seven other thick-disk stars in Table 3. The kinematics and photometric (and spectroscopic) [M/H] abundance of HD 16623 indicate that this star is a a member of the thick disk. The mean of HD 16623 is low due to its [Ca/Fe] and [Ti/Fe] abundances, which are more similar to that of the thin disk, whereas its [Mg/Fe] abundance is higher and more similar to that of the thick disk. This star is perhaps transitional between the thick and thin disks, with a more mixed chemical and dynamical history.
Another star which stands out in Table 3, and also in Fig. 6, is HD 104556. Its , , and W’ (= +15 km s-1, from Table 2) values would all indicate a (thick) disk star while its value (+74 km s-1) is more indicative of the halo. For example, from Table 5 of Schuster et al. (1993) the value of HD 104556 is removed from the mean value of the thick disk, but only from that of the halo. Other studies have also given compositions for HD 104556 which are more thick-disk-like than halo-like, such as Friel (1987), who gives dex, and Eggen (1997), who gives dex. These stars point out the risks in using only a single parameter, such as , [Fe/H], or , to derive the population type of an individual star, and also show that some stars do not fit cleanly into any one population type, according to all criteria.
4.4 Ages and an age-metallicity relation
Fig. 8 shows the position of all the thin-disk stars in our sample, with a mean metal abundance of dex for the metallicity range dex, as compared with the isochrones of VandenBerg (2003) as transformed to the photometry by Clem et al. (2004). It is seen that the majority of the stars are distributed inside the isochrones. Possible systematic shifts between the isochrones and the positions of the redder main-sequence stars have been examined, and no need for systematic corrections was found. It is also conspicuous that a few stars with the values of and lie off the isochrone grid, i.e. ages Gyr. These may be unidentified binary stars.
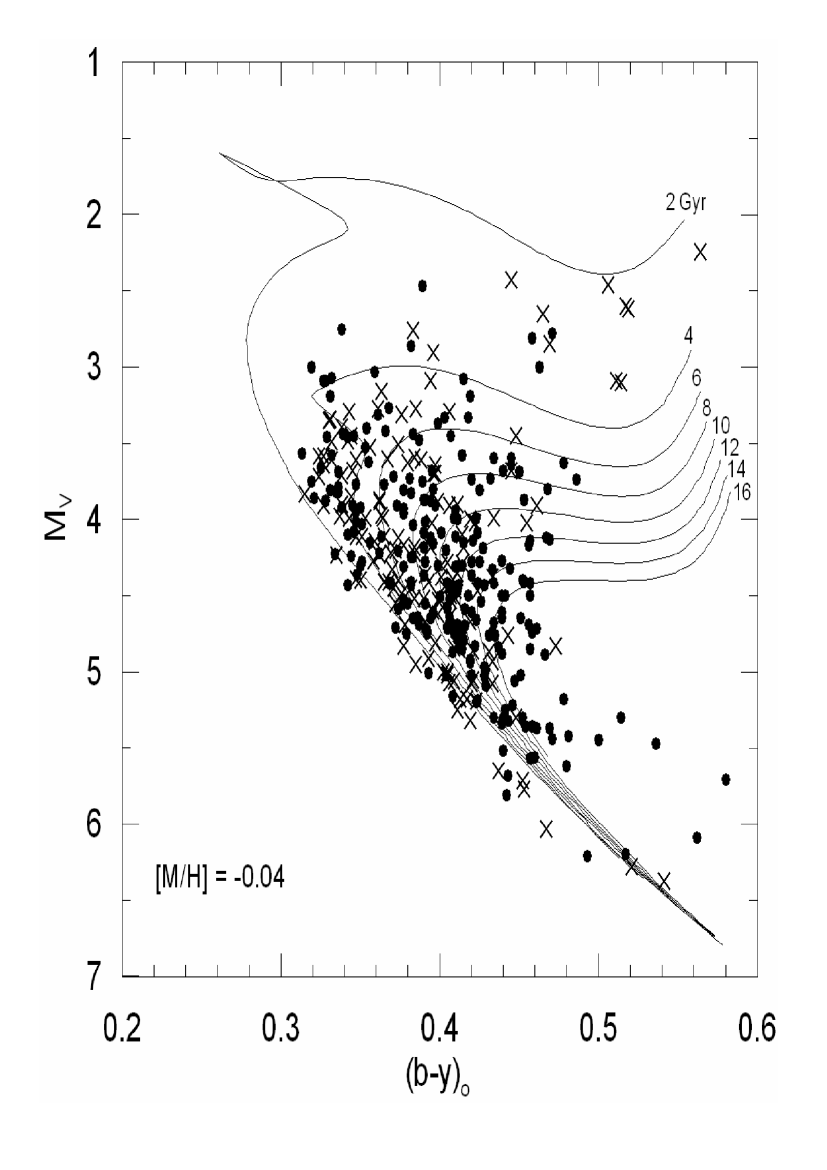
Isochrone ages are determined by placing the stars in observational HR diagrams (such as Fig. 8) using the observed , values for each star, and then reading off the age of the star by interpolating between the theoretically computed isochrones. The isochrones of VandenBerg (2003) as transformed to the system by the colour-temperature relations of Clem et al. (2004) have been chosen for the age determination of the thin-disk stars. These isochrones cover the range dex and ages from 1 to 20 Gyr in 1 Gyr steps. Whereas, for the age determination of the thick-disk and halo stars, which are separated according to the criterion, the set of isochrones from Bergbusch & VandenBerg (2001), as transformed by the same colour-temperature relations, have been used. This latter set of isochrones cover dex and ages from 6–20 Gyr in 1 Gyr steps. The ages of the 22 thick-disk stars have been interpolated in the , diagram using a constant dex and interpolated for the metal abundances of dex. At sub-solar [M/H] we assumed dex for thick-disk stars with dex, taking into consideration Fig. 3 of Wheeler, Sneden & Truran (1989).
In order to estimate the errors for the age interpolations, the uncertainties (, and ) in , and have been collected from the web site of the General Catalogue of Photometric Data of Hauck & Mermilliod (1998), and from the and catalogues (ESA 1997), the uncertainties () in the parallaxes () of our sample of stars given in Table 2. The derived error equation for the Pogson relation given in Section 4.2, , allows us to estimate from the uncertainties in and of individual stars in our sample. The resulting average uncertainties in and are 0.081 and 0.003 mag, respectively. For stars lying along the turn-offs of the isochrones, these average uncertainties in and result in age errors of 1 Gyr when applied to the difference between two isochrones in the , diagram. For sub-giants above the turn-offs, the errors are somewhat larger, Gyr. Below the turn-offs the age errors can grow indefinitely due to the convergence of the isochrones. We have measured ages to an error limit of about Gyr. Error bars corresponding to an uncertainties of 1 Gyr in age and dex in , (Schuster & Nissen 1989 and Section 4.3) are indicated in Fig. 9a.
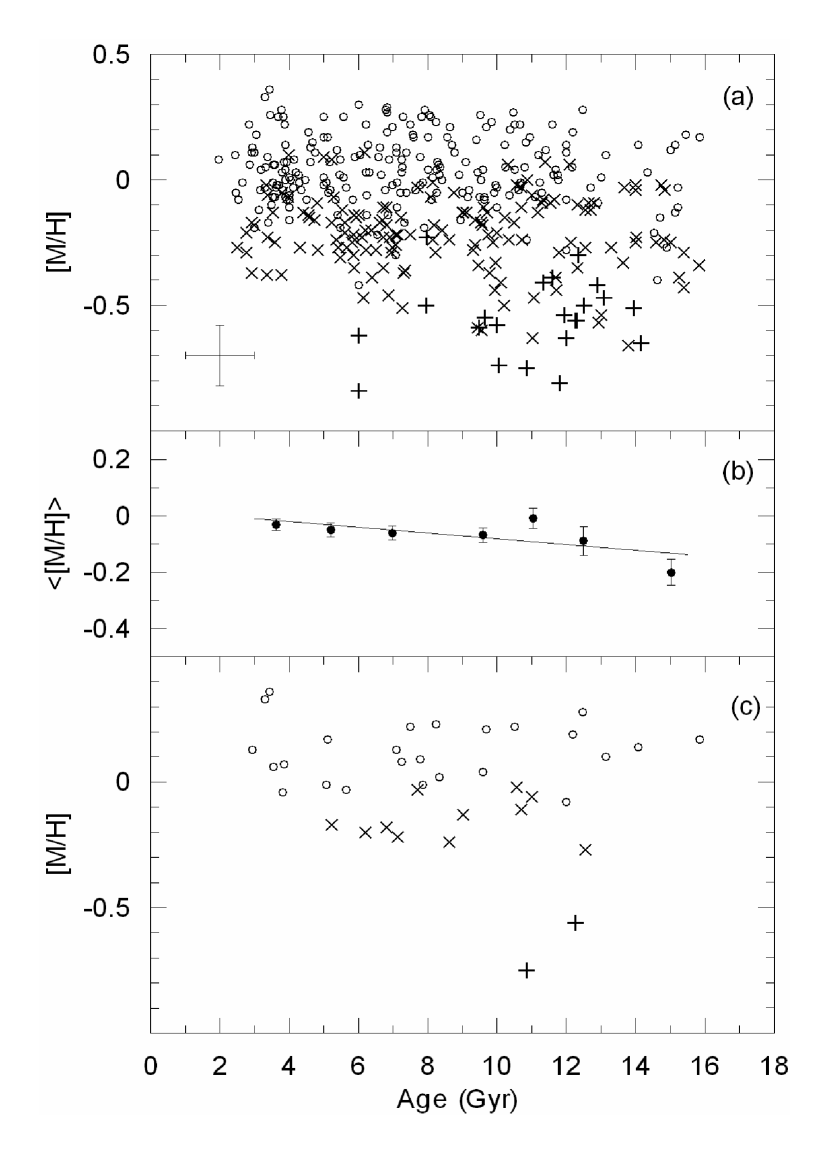
In Fig. 9a the metallicity is plotted as a function of age with different symbols for the definitive thin disk (circles, ), probable thin disk (cross signs, ) and probable thick disk (plus signs, ). It can be seen from Fig. 9a that few stars have ages less than 3 Gyr; this is to be expected since the stars of this sample by Nidever et al. (2002) contain mostly late F-, G-, and K-type stars. This derived age-metallicity relation agrees qualitatively with that of Edvardsson et al. (1993).
A slight trend that metallicity decreases with increasing age is seen in Fig. 9b; the slope of a least squares fit to the versus age is dex Gyr-1. Even though there is this overall trend of decreasing mean metallicity with increasing age, both a larger scatter in [M/H] at a given age and the presence of old, metal-rich stars make it difficult to decide whether or not an age-metallicity relation really exists for the thin disk. So, it is difficult to draw any clear conclusion from Fig. 9a.
The age-metallicity relations derived from the larger samples of Feltzing et al. (2001) and Nordström et al. (2004) apply mainly for stars less than 3 Gyr, whereas ages of our stars are generally greater than this limit. For ages larger than 3 Gyr the age-metallicity diagrams of Feltzing et al. (2001; their Fig. 10) and of Nordström et al. (2004; their Fig. 27) appear very similar to our Fig. 9a, almost no correlation between age and metallicity.
In Fig. 9a the 22 thick-disk stars show a range of 7–8 Gyr in their ages but no obvious correlation between the ages and metallicities, in contrast with the results of Bensby, Feltzing & Lundström (2004), who find a pronounced age-metallicity relation for the thick disk. However, Bensby et al. (2004) work with a thick-disk sample ten times larger than ours, separated from the thin disk more rigorously, and so their conclusions should be preferred. We do agree with them that the thick-disk stars show a very significant range in ages, Gyr.
From Fig. 9a, it can be seen that there is lack of metal-poor young stars in the left-bottom corner. However, there exists numerous old metal-rich stars in the right-upper corner, which leads to the substantial scatter and the flattening of the plot. The existence of the old metal-rich stars can also seen in the works of Feltzing et al. (2001), Nordström et al. (2004), Rocha-Pinto et al. (2000), and Chen et al. (2003).
Fig.9c shows the same age-metallicity plot for the main sequence stars from Nidever et al. (2002) for which extra-solar planets have been detected (Schneider 2005; Mayor et al. 2005). Again, the relation between the metallicity and the age is very flat as in Fig. 9a, the main difference being that the large majority of these stars have high metallicities, dex, as has been pointed out in many studies, such as Gonzalez (1997), Laughlin (2000), Santos, Israelian & Mayor (2001), Murray & Chaboyer (2002), and Reid (2002). However, two of these stars (HD 114729 and HD 114762) have lower metallicities, dex, and have been classified thick disk, with rather large ages, Gyr. Interestingly, this entire sample of stars with extra-solar planetary systems has large ages and a large range in ages, age Gyr.
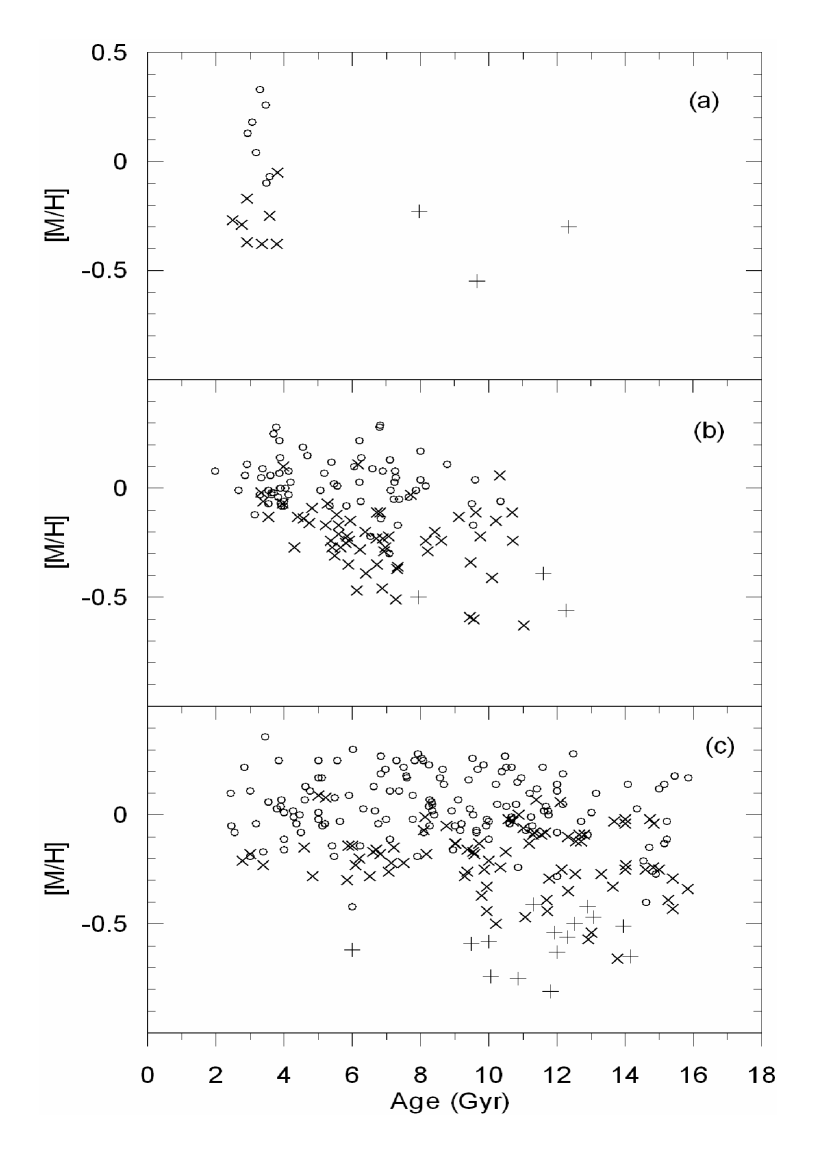
In Fig.10 we plot the ages and metallicities for our total sample, for three bins of . A similar pattern as in Fig.14 of Feltzing et al. (2001) appears. As we allow stars with faint absolute magnitudes to enter our samples, the upper right-hand corner of the age-metallicity plot is progressively filled in. In panel (c) of Fig. 10, stars with dex and ages larger than 10 Gyr become numerous in the upper right-hand corner. From panel (b) of Fig. 10, one might conclude a fairly obvious and pronounced age-metallicity relation, but with the stars of panel (c) this has mostly disappeared. Fig. 10c reveals that old, metal-rich stars are dominant at the faint absolute magnitudes.
Chen et al. (2003) investigate the nature of these old metal-rich stars in the solar neighbourhood and conclude that most seem to have originated from the inner thin disk. They note that HD 190360 is an exception in their sample and suggest that it is a metal-rich thick-disk star. A 15.8 Gyr age can be attributed to this star since its position in the , diagram of Fig. 8 places it slightly to the left of the 16 Gyr isochrone. Our photometric metal abundance ( dex) and a 15.8 Gyr age show that this star is old and metal-rich, in accordance with the suggestion of Chen et al. (2003). For this star, our kinematics (190 km s-1, km s-1) and photometric abundance ( dex) are almost identical to the ones of Chen et al. (2003). Whereas our value indicates that it is a thin-disk star, the rather large absolute value for would suggest thick disk, again in agreement with Chen et al. (2003). HD 190360 is another star which does not fit cleanly into all the criteria for a single stellar population, and shows again the risk in using only two variables, [M/H] and , to define the population type of a single star.
The scatter observed in age-metallicity plot of Fig. 9a can be interpreted within the scope of models of Galactic chemical evolution of Pilyugin & Edmunds (1996) and Raiteri, Villata & Navarro (1996). These models consider the chemical enrichment with time, together with the dynamical evolution. The model of Pilyugin & Edmunds (1996) specifically takes into account both the self-enrichment of star forming regions with sequential star formation and the effect of irregular rates of infall of un-processed matter onto the stellar disk. These Galactic chemical-evolution models can generate a very conspicuous scatter, such as that seen in the observational age-metallicity plots, such as our Fig. 9a, Fig. 14a of Edvardsson et al. (1993), Figs. 27–28 of Nordström et al. (2004), and Figs. 10–11 of Feltzing et al. (2001). However, for the models of Pilyugin & Edmunds (1996) episodic gas infall onto the disk is required to produce a scatter in metallicity ([Fe/H]) as large as that observed; self-enrichment processes alone will not do it. The N-body/hydrodynamical simulations of the chemical evolution by Raiteri et al. (1996) can produce a scatter in [Fe/H] even larger than that observed (see their Fig. 9) depending upon the volume in the Galaxy over which the results have been considered.
Our sample based on radial velocities of Nidever et al. (2002) are not well populated at all ages, but contains late-F, G and K stars with apparent magnitudes fainter than mag, as compared to the samples of Edvardsson et al. (1993), Feltzing et al. (2001) and Nordström et al. (2004). This selection effect causes a bias in the sense that ages less than 3 Gyr are lacking, but the sample is without kinematic bias. Moreover, the metallicity distribution of our sample is representative of the older stellar populations of the solar neighbourhood, and shows a small overall trend in the age-metallicity plot. The presence of old, metal-rich stars, from the cooler program stars, shows that this sample has avoided one of the distortions of the age-metallicity relation, such as that which affected the results of Twarog (1980), as pointed out by Feltzing et al. (2001). Also, the presence of a significant number of metal-rich and older stars emphasizes the usefulness of the planetary-search list of Nidever et al. (2002) since many studies, such as those of Gonzalez (1997), Laughlin (2000), Santos et al. (2001), Murray & Chaboyer (2002), and Reid (2002), have shown that the parent stars of most extra-solar planets are significantly metal-rich, as confirmed in our Fig. 9c.
5 Conclusions
Our main conclusions are as follows:
1) Accurate metal abundances can be derived from the photometry, using the combined calibrations as described above in Section 4.3. In Fig. 4 a comparison between the photometric metallicities and modern spectroscopic ones for 71 stars shows excellent agreement: for the metallicity range dex with a scatter of . This error agrees well with estimates made by Feltzing et al. (2001), –0.11.
2) The metallicity and , [M/H] distributions of our sample show a mixture of all the stellar populations in the solar neighbourhood; the thin disk dominates with a small but significant contribution from the thick disk, plus a few halo stars.
3) Using the criterion of Schuster et al. (1993) has allowed us to isolate a thick-disk sample of 22 stars with minimal contamination from the other stellar populations. A km s-1 velocity dispersion is estimated for the range where these thick-disk stars dominate. This value is within the range of 30–37 km s-1 given by Norris (1987), Croswell et al. (1991), and Carney et al. (1989). These 22 thick-disk stars also have km s-1 and dex.
4) -element abundances which are available for some thick-disk stars in our sample show the typical -element signatures of the thick disk, supporting the classification procedure based on the criteria, which is a linear combination of and [Fe/H] (Schuster et al. 1993).
5) There is a lack of stars with ages less than 3 Gyr in our age-metallicity diagram, due to the selection criteria of the sample. For ages greater than 3 Gyr, both a larger scatter in at a given age and the presence of old, metal-rich stars make it difficult to decide whether or not an age-metallicity relation really exists, very similar to the works of Edvardsson et al. (1993), Feltzing et al. (2001) and Nordström et al. (2004). Our age-metallicity plot (Fig. 9) shows a very shallow slope of (age) dex Gyr-1.
6) Our Fig. 9a shows a significant age span for the thick disk with a range in ages Gyr, in agreement with the work of Bensby et al. (2004).
7) The age-metallcity diagram for the stars with extra-solar planets shows a relation very similar to that of the total sample, very flat with almost no variation in the mean metallicity with age; the main difference is that most of these stars are metal-rich, dex with the exception of two (HD 114729 and HD 114762) which have dex and have been classified as thick disk. This subsample also shows a more or less uniform distribution over a wide range in ages, age Gyr, similar to the total sample.
8) A number of stars have been pointed out which do not fit well into any stellar-population classification scheme, such as HD 16623, HD 104556, and HD 190360. These stars exemplify the risks in using only a single criterion, such as , [Fe/H], , [/Fe], or , to classify the stellar-population-type of any individual star. All such information should be used, but even then, some stars cannot be classified unambiguously.
6 Acknowledgments
This research has been made possible by the use of the SIMBAD database, operated at the CDS, Strasbourg, France, and the web site of the General Catalogue of Photometric Data, Geneva, Switzerland. We are indebted to D.A. Vandenberg and J.L. Clem for kindly providing their isochrones. T. Bensby is thanked for providing his abundance data set. We also thank H. Çakmak for preparing a visual basic program for the age determination. We would like to thank Bernard E. J. Pagel, the referee, for his useful and constructive comments concerning the manuscript. This work was supported by the Research Fund of the University of Istanbul, Project number: BYP-402/26042004.
References
- [1] Allen C., Santillan A., 1991, Rev. Mex. Astron. Astrofis., 22, 255
- [2] Arce H.G., Goodman A.A., 1999., ApJ, 512, L135
- [3] Bensby T., Feltzing S., Lundström I., Ilyin I., 2005, A&A, 433, 185
- [4] Bensby T., Feltzing S., Lundström I., 2004, A&A, 421, 969
- [5] Bensby T., Feltzing S., Lundström I., 2003., A&A, 410, 527
- [6] Bergbusch P. A., VandenBerg D.A., 2001, ApJ, 556, 322
- [7] Butler R.P., Vogt S.S., Marcy G.W., Fischer D.A., Henry G.W., & Apps K., 2000, ApJ, 545, 504
- [8] Carney B., Latham D.W., Laird J.B., 1989, ApJ, 97, 423
- [9] Cayrel de Strobel G., Soubiran C., Ralite N., 2001, A&A, 373, 159
- [10] Cenarro A.J., Cardiel N., Gorgas J., Peletier R.F., Vozdekis A., Prada F., 2001, MNRAS, 326, 959
- [11] Chen Y. Q., Zhao G., Nissen P. E., Bai G. S., Qiu H. M., 2003, ApJ, 591, 925
- [12] Chen Y. Q., Nissen P. E., Zhao G., Zhang H. W., & Benoni T., 2000, A&A, 141, 491
- [13] Clem J.L., VandenBerg D.A., Grundahl F., Bell R.A., 2004, AJ, 127, 1227
- [14] Crawford D.L., 1975, PASP, 87, 481
- [15] Croswell K., Latham D.W., Carney B., Schuster W., Aguilar L., 1991, AJ, 101, 2078
- [16] Edvardsson B., Andersen J., Gustafsson B., Lambert D.L., Nissen P.E., Tomkin J., 1993, A&A, 275, 101
- [17] Eggen O.J., 1997, AJ, 114, 825
- [18] ESA 1997, The Hipparcos and Tycho Catalogues, ESA SP-1200, Noordwijk
- [19] Feltzing S., Holmberg J., Hurley J.R., 2001, A&A, 377, 911
- [20] Friel E.D., 1987, AJ, 93, 1388
- [21] Fukugita M., Peebles P.J.E., 2004, ApJ, 616, 643
- [22] Fulbright J., 2000, AJ, 120, 1841
- [23] Giménez A., 2000, A&A,356, 213
- [24] Gonzalez G., 1997, MNRAS, 285, 403.
- [25] Hauck B., Mermilliod M., 1998, A&AS, 129, 431
- [26] Henry G.W., Fekel F.C., Henry S.M., Hall, D.S., 2000, ApJS, 130, 201
- [27] Hog E., Fabricius C., Makarov V. V., Urban S., Corbin T., Wycoff G., Bastian U., Schwekendiek P., Wicenec A., 2000, A&A, 355L, 27
- [28] Johnson D.R.H., Soderblom D.R., 1987, AJ, 93, 864
- [29] Kerr F.J., Lynden-Bell D., 1986, MNRAS, 221, 1023
- [30] Kharchenko N.V., 2001, Kinematika i Fizika Nebesnykh Tel, 17, 409
- [31] Laughlin G., 2000, ApJ, 545, 1064
- [32] Lutz T.E., Kelker D.H., 1973, PASP, 85, 573
- [33] Martell S., Laughlin G., 2002, ApJ, 577, 45
-
[34]
Mayor M., Naef D., Pepe F., Queloz D., Santos N.C., Udry S., 2005,
The Geneva Extrasolar Planet Search Programmes, Université de Genéve,
http://www.unige.ch/sciences/astro/fr/Recherches. - [35] Mishenina T.V., Soubiran C., Kovtyukh V.V., Korotin S.A., 2004, A&A, 418, 551
- [36] Murray N., Chaboyer B., 2002, ApJ, 566, 442
- [37] Nidever D.L., Marcy G.W., Butler R.P., Fischer D.A., Vogt S. S., 2002, ApJS, 141, 503
- [38] Nissen P.E., 2004, in Origin and Evolution of the elements from the Carnegie observatories centennial symposia, eds. A. McWilliam, & M. Raucherro, Cambrdige Univ. Press., Cambridge, Vol.4, 156
- [39] Nissen P.E., 1994, in Stars, Gas, and Dust in the Galaxy, Invited Reviews at a Symposium in Honor of Eugenio E. Mendoza, eds. A. Arellano Ferro & M. Rosado, Rev. Mex. Astr. Astrofis., 29, 129
- [40] Nissen P.E., Schuster W.J., 1997, A&A, 326, 751
- [41] Nissen P.E., Schuster W.J., 1991, A&A, 251, 457
- [42] Nordström B., Mayor M., Andersen, J., Holmberg, J., Pont, F., Jørgensen, B.R., Olsen, E.H., Udry, S., & Mowlavi, N., 2004, A&A, 418, 989
- [43] Norris J.E., 1987, ApJ, 314, L39
- [44] Pilyugin L.S., Edmunds M.G., 1996, A&A, 313, 792
- [45] Pompéia L., Barbuy B., Grenon M., 2003, ApJ, 592, 1173
- [46] Raiteri C.M., Villata M., Navarro J.F., 1996, A&A, 315, 105
- [47] Reid I.N., 2002, PASP, 114, 306
- [48] Rocha-Pinto H.J., Maciel W.J., Scalo J., Flynn C., 2000, A&A, 358, 850
- [49] Santos N.C., Israelian G., Mayor M., 2004, A&A, 415, 1153
- [50] Santos N.C., Israelian, G., & Mayor, M., 2001, A&A, 373, 1019
- [51] Schlegel D.J., Finkbeiner D.P., Davis M., 1998, ApJ, 500, 525
- [52] Schneider J., 2005, Extra-solar Planets Catalog. Observatoire de Paris, http://www.obspm.fr/encycl/cat1.html
- [53] Schuster W.J., Moitinho A., Parrao A., Márquez, A., Covarrubias E., 2005, A&A, in process
- [54] Schuster W.J., Beers T.C., Michel R., Nissen P.E., García, G., 2004, A&A, 422, 527
- [55] Schuster W.J., Nissen P.E., Parrao L., Beers T.C., Overgaard L.P., 1996, A&AS, 117, 317
- [56] Schuster W.J., Parrao L., Contreras-Martínez M.E., 1993, A&AS, 97, 951
- [57] Schuster W.J., Nissen P.E., 1989, A&A, 221, 65
- [58] Taylor J.R., 1997, An Introduction to Error Analysis, The Study of Uncertainties in Physical Measurements. University Science Books, Sausalito
- [59] Twarog B.A., Anthony-Twarog B.J., Tanner D., 2002, AJ, 123, 2715
- [60] Twarog B.A., 1980, ApJ, 242, 242
- [61] VandenBerg D.A., 2003, private communication
- [62] VandenBerg D.A., Clem J.L., 2003, AJ, 126, 778
- [63] Vogt S.S., Marcy G.W., Butler R.P., Apps K., 2000, ApJ, 536, 902
- [64] Wheeler J.C., Sneden C., Truran J.J.W., 1989, ARA&A, 27, 279