UVBLUE: a new high-resolution theoretical library of
ultraviolet stellar spectra
Abstract
We present an extended ultraviolet-blue (850-4700 Å) library of theoretical stellar spectral energy distributions (SEDs) computed at high resolution, = 50 000. The Uvblue grid, as we named the library, is based on LTE calculations carried out with Atlas9 and Synthe codes developed by R. L. Kurucz and consists of nearly 1800 entries that cover a large volume of the parameter space. It spans a range in from 3000 to 50 000 K, the surface gravity ranges from = 0.0 to 5.0 with = 0.5 dex, while seven chemical compositions are considered: [M/H] and +0.5 dex. For its coverage across the H-R diagram, this library is the most comprehensive one ever computed at high resolution in the short-wavelength spectral range, and useful application can be foreseen both for the study of single stars and in population synthesis models of galaxies and other stellar systems.
We briefly discuss some relevant issues for a safe application of the theoretical output to ultraviolet observations, and a comparison of our LTE models with the NLTE ones from the Tlusty code is also carried out. NLTE spectra are found, in average, to be slightly “redder” compared to the LTE ones for the same value of , while a larger difference could be detected for weak lines, that are nearly wiped out by the enhanced core emission component in case of NLTE atmospheres. These effects seem to magnify at low metallicity (typically [M/H]).
A match with a working sample of 111 stars from the IUE atlas, with available atmosphere parameters from the literature, shows that Uvblue models provide an accurate description of the main mid- and low-resolution spectral features for stars along the whole sequence from the B to G5 type. The comparison sensibly degrades for later spectral types, with supergiant stars that are in general more poorly reproduced than dwarfs. As a possible explanation of this overall trend, we could partly invoke the uncertainty in the input atmosphere parameters to compute the theoretical spectra. In addition, one should also consider the important contamination of the IUE stellar sample, where the presence of binary and variable stars certainly works in the sense of artificially worsening the match between theory and observations.
1 Introduction
The study of the ultraviolet (UV) properties of stars has been an expanding field of research in the last few decades, following the pioneering space missions of Voyager, OAO, and IUE satellites, in the 70’s. In the more recent years, the two Astro missions with the Hopkins Ultraviolet Telescope (HUT) and the Goddard High-Resolution Spectrograph (GHRS), on board the Hubble Space Telescope (HST), opened the way to new-generation instrumentation for space observation at short wavelengths. The Space Telescope Imaging Spectrograph (STIS), that replaced GHRS, was carrying out high-resolution spectra in the near-UV range (1900–3300 Å), while the Far Ultraviolet Spectroscopic Explorer (FUSE) has pushed the far-UV (912–1900 Å) observations down to the Lyman limit with an unprecedented resolution (; Moos et al., 2000). On the side of UV imaging, a fresh wealth of data is coming from the GALEX space mission, that collects observations of stars and galaxies in two adjacent photometric bands over the wavelength range 1350–2800 Å.
To cope with these striking advances in the observational capabilities, we now urge improved theoretical tools to carry out the analysis of stellar spectra at comparable accuracy and resolution (see, on this line, an early exploratory discussion of Leckrone et al., 1990). In addition, a homogeneous and complete collection of synthetic spectral energy distributions of stars is also a basic demand for population synthesis codes (cf., e.g. Buzzoni, 1989; Bressan, Chiosi, & Fagotto, 1994; Worthey, 1994; Leitherer et al., 1999; Vazdekis, 1999; Bruzual & Charlot, 2003; Gonzalez Delgado et al., 2004), so extensively used to model the UV emission of high-redshift galaxies, as seen at optical wavelengths with ground telescopes (Pettini, 2002; Buzzoni, 2003).
A notable, but forcedly palliative, input in this sense has come from the empirical compilations of UV spectra, the most comprehensive one probably being the Wu et al. (1983) stellar atlas, based on the original IUE archive and covering the range 1200–3300 Å. Shortward of Ly, Pellerin et al. (2002) also presented an important database of galactic OB-type stars observed with FUSE, while Walborn et al. (2002) extended this library to the metal poor range including stars of the Magellanic Clouds.
Like for the main optical data collections (e.g. the Stelib library of Le Borgne et al., 2003, or the Gunn & Stryker, 1983, Jacoby, Hunter & Christian, 1984, and Pickles, 1985 atlases), however, a recognized drawback of UV empirical libraries is that observations can hardly assure any homogeneous and complete coverage of the stellar parameters, quite often with non-negligible discrepancies in the determination of the distinctive atmosphere parameters to label target stars (see, as an illuminating example, the compilation of chemical abundances as reported by Cayrel et al., 1997).
In this respect, theoretical libraries could play a key role as model atmospheres can be computed for virtually any desired combination of parameters. Moreover, thanks to more sophisticated numerical techniques and computer performances, calculations can now rely on complete and accurate opacities, leading to a more refined treatment of line blanketing (see, e.g. Lanz & Hubeny, 2003), also accounting for non-standard physical conditions such as relaxed hydrostatic or thermodynamical equilibrium (Hauschildt et al., 1995; Schaerer & de Koter, 1997; Gonzalez Delgado & Leitherer, 1999; Kudritzki & Puls, 2000).
A general weak point for most of the current theoretical datasets, however, is a quite poor spectral resolution,111The currently available Kurucz SEDs, for instance, sample the UV spectral range at a 10 Å step. and this poses an obvious limitation when matching the high-resolution observations now available. A tentative effort to overcome this gap is that of Brown, Ferguson, & Davidsen (1996), who provided a synthetic grid of about 1500 UV spectra at an increased resolution of 3 Å between 900 and 1800 Å; this dataset, however, is especially tuned for old (low-mass) stars, with a limited coverage of stellar parameters and based on some time-saving approximations in the computing algorithm.
All previous arguments gave us a strong motivation to further tackle the problem of the UV emission of stars and embark, in this paper, on a systematic computation of synthetic SEDs at high spectral resolution (= 50 000) in this wavelength range. The Uvblue grid, as we named our theoretical library, is based on the Kurucz (1993a) code, and is primarily aimed at complementing stellar libraries in the ultraviolet-blue spectral range currently in use for stellar populations studies. Nevertheless, we also foresee a fruitful use of our output for a diagnostics of individual stars, especially when optical information can be added to the UV data, and suitably matched with model grids at longer wavelength, in order to determine the fundamental parameters like effective temperature (), surface gravity () and chemical composition ([M/H]) by matching observed spectra (see, e.g. Bertone et al., 2004).
We will arrange our discussion presenting, in Sec. 2, a brief summary of the Kurucz original models atmospheres, that served as a main reference for our calculation. In Sec. 3 we list the main computational characteristics we have considered when using Synthe spectrum synthesis codes and we present the resulting atlas. Section 4 is a critical overview of some physical issues for a proper use of our theoretical library in the comparison with UV observations. A direct test is carried out in this section, matching the IUE low-resolution spectra of an extended sample of stars of different spectral types. Our relevant conclusions are finally summarized in Sec. 5, together with some hints for future work.
2 The Kurucz model atmospheres
The reference code for our atmosphere model calculations is Atlas9, which has been constructed by Kurucz (1993a) in the so-called “classical-model approximation”, namely assuming plane parallel atmosphere layers in hydrostatic and local thermodynamic equilibrium (LTE), and with fixed chemical composition. The physical variables are constant with time; additionally, convective equilibrium is accounted for through the mixing-length theory (Böhm-Vitense, 1958) with a mixing-length to pressure scale-height ratio of . The current version of Atlas9 is the result of a long-standing upgrade process of the original version of the code (Kurucz, 1979). As a major improvement over the years, special care has been devoted to a refined treatment of UV emission in the model atmospheres, both in terms of better input physics and computational performances. In particular, three important upgrades have been introduced in the current version of the code.
i) Inclusion and correction of iron and iron-peak element opacities (Kurucz, 1992). Currently, the line lists constructed by Kurucz (1993b) comprises nearly 60 million lines of atoms and diatomic molecules, of which 42 million correspond to iron group species. The line lists include up to nine ionization stages (Kurucz, 1995).
ii) Atmosphere spatial resolution has been increased to 72 layers, and calculations encompass a range in the Rosseland optical depth from “outward” to .
iii) In addition to the standard mixing-length theory, convection could be accounted for in the models according to the so-called “approximate overshooting” (Castelli, Gratton & Kurucz, 1997). However, while this approach is found to provide a better fit to the solar spectrum, it is a still controversial question whether it definitely holds in general also for real stars other than the Sun (Castelli et al., 1997). For this reason we eventually relied on the standard mixing-length treatment for our models.
For the sake of homogeneity, we decided to recompute a substantial portion of Kurucz’s grid of model atmospheres using John Lester’s modified version of Atlas9 adapted to run under Unix systems.222A downloable version of Lester’s program is available at http://ccp7.dur.ac.uk/library.html The parameter space covered by our library (and for which we provide a high-resolution synthetic spectrum) is summarized in Fig. 1. The plot displays the model grid for solar metallicity, compared in the vs. log plane with four reference tracks reporting the evolution of stars of 1, 2, 5 and 10 M⊙, from Girardi et al. (2000) and Salasnich et al. (2000). One sees that effective temperature is explored over the range K, with step of 500, 1000 and 2500 K in the intervals 3000–10000 K, 10000–35000 K and 35000–50000 K, respectively; surface gravity ranges from = dex, with steps of 0.5 dex and seven metallicity values are included, namely [M/H]= –2.0, –1.5, –1.0, –0.5, +0.0 (solar), +0.3 and +0.5 dex. The metal mix is solar-scaled, assuming the Anders & Grevesse (1989) chemical abundances for the Sun. All models have been computed with a microturbulent velocity km s-1.

3 UVBLUE: computational characteristics of synthetic SEDs
The whole database of stellar atmospheres accounted for in our work amounts to 1770 models. For each of these we have computed a high-resolution synthetic spectrum resolving the transfer equation by means of the series of codes Synthe, developed by Kurucz (1993b), and also conveniently modified in their Unix version by John Lester.333Our calculations have been mainly carried out with a SUN ULTRA 10 computer at the Instituto Nacional de Astrofisica Optica y Electronica, Puebla, Mexico. In our calculations we included all the atomic lines available in the Kurucz (1992) database with empirically determined atomic constants plus all the diatomic molecular lines (namely C2, CN, CO, H2, SiO, CH, NH, OH, MgH, and SiH) excepting the TiO molecule, with its nearly 37 million lines. We also excluded the “predicted” lines, that is those lines that ostensibly generate from theoretical atomic transitions but are so far undetected in the observed solar spectrum (Kurucz, 1992, see also Bertone et al., 2005 for a further discussion on this subject), as well as the very weak absorption lines, that is those with residual intensity of less than 0.1% with respect to the continuum. This cut is justified by the fact that these weak features would barely be detectable even with the highest reachable resolution in observed UV spectra.
These simplifications in the Synthe code resulted in a big saving time greatly speeding up the synthesis of stellar SED and allowing us to maintain the CPU time for the full theoretical library within reasonable limits. Quite importantly, note that by neglecting the TiO contribution we only very marginally affect the reliability of our output as this molecule is expected to become a prevailing contributor at optical/red wavelength in M-type stars cooler than 4000 K. At these low temperature, the UV emission of stars drops at nominal values (a fraction well less than 0.1% of the bolometric luminosity is emitted shortward of 3000 Å by late-type stars, cf. Buzzoni, 2002).
| Parameter | Value |
|---|---|
| K | |
| [M/H] | dex |
| dex at steps of 0.5 dex | |
| Microturbulent velocity () | 2 km s-1 |
| Wavelength range | Å |
| Resolving power, | 50 000 |
| Number of spectra | 1770 |
| Wavelength points per spectrum | 342 016 |
The main computational characteristics of Uvblue spectral library are summarized in Table 1; we just recall here the two basic features.
) Resolving power: = 50 000 over the full library. This high resolution represents a substantial increase with respect to previous calculations for such a wide coverage in stellar parameters. It stands above the resolution capabilities of most current and past UV-space missions. In fact, the only instruments that have provided spectra of comparable resolution are GHRS and STIS, that reach up to = 100 000 when used with the echelle grating setup.
) Wavelength interval: from 850 to 4700 Å. This interval encloses most of the UV range with the only exception of the extreme ultraviolet (EUV; 100 850 Å). To ease a further match, we also assured a 1200 Å overlap with Bluered, the blue-optical spectral grid of Bertone et al. (2005), that self-consistently complements the present work at larger wavelength.444The full set of high-resolution SEDs of Uvblue and the complementary optical atlas Bluered by Bertone et al. (2005) are available upon request from the authors or through the dedicated Web sites http://www.bo.astro.it/eps/uvblue/uvblue.html and http://www.inaoep.mx/modelos/uvblue/uvblue.html.
Figures 2 and 3 display some illustrative examples of the Uvblue library in selected spectral regions. The 912 Å Lyman break is explored in Fig. 2 for O-B stars of solar metallicity and = 5.0 dex. On the plot we can also recognize the features of C iii, N iii, C ii, and Si iv at 977, 991, 1036, and 1128 Å, respectively. The interesting wavelength interval around the strong Mg ii doublet at 2800 Å is also displayed in the three panels of Fig. 3 for different parameter sequences as indicated in each plot. Together with the Mg doublet, it is also evident in the figure the contribution of Mg i features around 2852 Å, as well as the blend of several Fe i and Fe ii features at about 2750 Å. The Fe ii and Si i lines at 2880 and 2881 Å can also be distinguished.


4 Comparing with the observations
A full comparison of our theoretical output and the observed SED of real stars along the whole spectral-type sequence is the obvious (and mandatory) step to assess the robustness of our results and probe the accuracy of theoretical spectra in reproducing the main distinctive features as observed in stars.
Before carrying out this comparison, however, it is important to consider some relevant aspects that deal with the input physics of our models and should be kept in mind when matching observations.
4.1 Caveats
As a first substantial characteristics of our library, we are dealing with models in hydrostatic equilibrium; consequently, they should not be compared with observed spectra in wavelength regions that form in the winds of hot atmospheres. This is the case, for instance, of the strong C iv line at 1550 Å that shows a prominent P-Cygni profile in main sequence stars earlier than O7 or B0 in lower gravity objects.
Second, we have only considered one value for microturbulent velocity, = 2 km s-1 (i.e. the canonical value in the Kurucz atmospheres). Non local thermodynamic equilibrium (NLTE) analyses of high-resolution spectra for early-type stars in the SMC observed with STIS and the AAT (Bouret et al., 2003), indicate that values of as high as 10 km s-1 might be more appropriate for the observed physical conditions. For late and intermediate-type stars various authors claim that more suitable values for are in the range 1.0–2.5 km s-1 depending on surface gravity (e.g. Barbuy et al., 2003). We plan to compute synthetic spectra for other values of ; however, we anticipate that its effects on most lines will be negligible unless very high resolution is considered. To illustrate this statement, in addition to the standard case, we have computed in Fig. 4 three additional models with microturbulent velocities of = 0, 4, and 8 km s-1. For the comparison we selected the region around 1300 Å, dominated by Si ii, Si iii and O i lines. The spectra are for a = 14 000 K star with = 4.0 dex, a combination that should maximize the blend strength of these absorption features when seen in low-dispersion spectra (Fanelli et al., 1992).
Third, we have to make sure that spectral resolution in the grid and in observational data are compatible. An illustrative example is shown in Fig. 5, for the same wavelength interval of Fig. 4 and for the Ly region about 1030 Å. By means of Gaussian filter convolution, we degraded the spectra to four different resolutions, that is = 500, 1000, 10 000, and 25 000. Note that at the IUE low-resolution mode (i.e. 250 at 1500 Å) most of the features would definitely be washed out, and things could get even worse comparing with the nominal resolution of the original Kurucz grid of spectra, where 150 at 1500 Å.
Fourth, our calculations do not include the effects of rotational velocity. While a vast majority of late-type stars does not show any large projected rotational velocity, we know that most of early-type stars are severely affected by rotation reaching values of up to 500 km s-1. Recently, Glebocki & Stawikowski (2000) presented a compilation of over 17000 measurements of for nearly 12000 stars that complement previous catalogs (Uesigi & Fukuda, 1982). In order to illustrate the overall dependence of on effective temperature and surface gravity we plot in Fig. 6 the distribution vs. spectral type for four different luminosity classes. Only the subset of “normal” stars is considered in the plot, that is excluding white dwarfs, Wolf Rayet, binary stars etc. Evidently, the importance of rotation when comparing observed and Uvblue spectra will depend on how the Doppler broadening compares with instrumental resolution.
Fifth, late-type stars are recognized to display some chromospheric activity to different extent. Non radiative heating in the upper atmosphere of F to M-type stars, through acoustic waves in F0–F5 stars and magnetohydrodynamic mechanisms for later types (Böhm-Vitense et al., 2001, and reference therein), causes a turnover in the temperature stratification, (). This temperature distribution has important effects on the SED at short wavelength as it could trigger prominent emission lines, like for instance the strong Mg ii doublet at 2800 Å (e.g. Blanco et al., 1982), and an overall enhancement in the UV continuum (Franchini, Morossi & Malagnini, 1998). Classical models in general, and Kurucz’s ones in particular, do not account for this phenomenon since temperature decreases monotonically in the outermost atmosphere layers.


4.2 LTE vs. NLTE
It has been widely discussed in the literature that deviations from LTE are to be expected for hot stars and the cores of strong lines in stars of intermediate type (Mihalas, 1972). However, it has also been demonstrated that at low resolution the agreement between LTE and NLTE model fluxes is good, and that comparison of far-UV and mid-UV observational data with LTE model fluxes also results in good agreement (Morales et al., 2000). At high resolution such a comparison has been anticipated by Lanz & Hubeny (2003) but not yet quantitatively assessed.
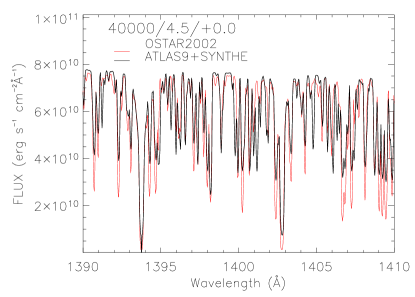
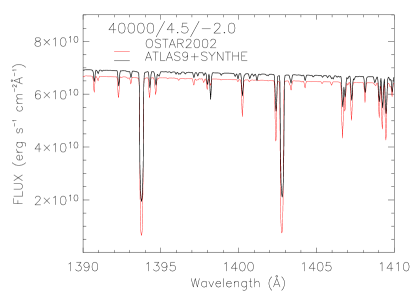
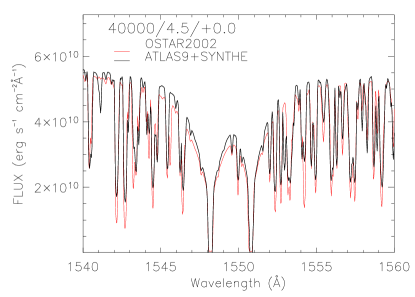
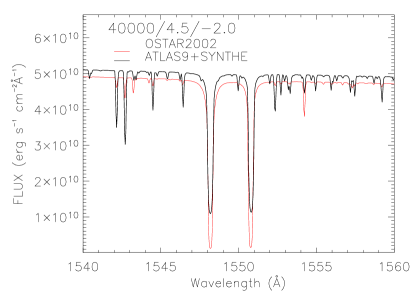
As the whole Uvblue spectral library has been computed under the assumption of LTE, it may be of some interest to compare the Atlas9 results with the corresponding output for NLTE codes. Here, we considered in particular two representative sets of stellar parameters with (, ) = (40 000 K, 4.5 dex) and different metallicity, namely [M/H]= 0.0 dex (solar) and –2.0 dex. The NLTE models and theoretical SEDs have been extracted from the Ostar2002 grid (Lanz & Hubeny, 2003), based on line-blanketed model atmospheres computed with Tlusty (Hubeny & Lanz, 1992) under the condition of hydrostatic equilibrium. Available spectral fluxes cover the wavelength region from 45 Å to 300 m at a resolution and assume a value of km s-1. In order to make the datasets mutually consistent, we have recalculated the corresponding Atlas9 spectra for the same microturbulent velocity and wavelength resolution.
The temperature structure of Atlas9 and Tlusty model atmospheres is compared in the upper panels of Fig. 7. Although no obvious interpretative scheme can be invoked to explain the overall differences in the LTE vs. NLTE properties, the figure helps assessing some relevant features directly dealing with the different temperature stratification in the two sets of atmospheres. As a major issue, one sees that, for the same value of , the outer structure of the Tlusty models strongly modulates with metallicity, with a temperature turnover growing at metal-poor abundance; this effect can also be recognized in the original models of Kudritzki (1976). Typically, temperature inversion begins to appear in [M/H] models (see Fig. 4 in Lanz & Hubeny, 2003), and involves the atmosphere layers.
On the other hand, when approaches unity, another important feature seems to characterize NLTE models. Close to the photosphere region, in fact, the NLTE temperature profile appears in general cooler compared with the corresponding LTE case. The size of this temperature “dip” (cf. the temperature residuals in Fig. 7) depends on the detailed physical treatment of Helium opacity (see, e.g., the interesting experiments of Kudritzki, 1976, and Werner, 1988) but, to a more or less pronounced extent, it seems to be a quite general feature for NLTE atmospheres. As a consequence, for fixed value of , NLTE models tend to be “redder” than the corresponding LTE solution because the continuum forms in a slightly cooler physical environment; this especially reflects in short-wavelength colors, like the Strömgren , as first indicated by Kudritzki (1976). Direct evidence in the sense of a mildly depressed UV/blue continuum can also be derived from the Lanz & Hubeny (2003) SEDs, when comparing with the Kurucz LTE models.
The composite trend of temperature stratification leads, in addition, to different behaviour of high-resolution features in the SED of stars. As far as “weak” absorption lines are concerned (that is those mainly generating in the innermost regions of star atmospheres), the core emission component induced by the temperature turnover of the external NLTE layers should likely act in the sense of “filling” out the features. This would be especially evident at metal-poor regimes, as can be easily recognized in the [M/H] synthetic spectrum of Fig. 7 (right panels). On the contrary, for those strong (or saturated) absorption features, whose core forms at the optical depth about the region of the temperature “dip”, we would rather expect a slightly increased equivalent width for NLTE models, again, as a result of a cooler temperature environment. This is the case, for instance, of some Si iv and C iv lines (see Fig. 7, left panel), or Hydrogen Balmer absorptions, like at 4340 Å, or the He ii absorption at 4542 Å, as shown by Kudritzki (1976).
The UV SED of late-type stars is also affected by deviations from LTE. In addition to the still controversial “missing solar UV opacity” (Holweger, 1970; Gustafsson et al., 1975), in fact, some of the disagreements found when comparing the observed and theoretical solar spectrum have been ascribed to NLTE effects. However, the recent analysis by Allende Prieto, Hubeny, & Lambert (2003) indicates that the claimed discrepancy between theory and observations in the mid-UV region around 2400–2600 Å for the Sun cannot be overcome by (and actually even worsen with) NLTE calculations.


4.3 Matching the IUE spectral atlas
As we have mentioned before, the Wu et al. (1983) atlas of stellar spectra, from the IUE data, still remains a main reference to compare the Uvblue theoretical output. This composite atlas has been the work-horse of numerous investigations on the calibration of stellar features in terms of stellar parameters as well as population studies. The original sample of 170 stars has been further extended to 220 objects by Fanelli et al. (1990), including most late-type stars and completing the sampling of spectral types, from O to M, and luminosity classes, from I to V. Many subsequent updates have further increased the number of entries, and the current Web version of the catalog555 http://www-int.stsci.edu/jinger/iue.html comprises 476 objects.
For the illustrative scope of our work, we restrained the analysis only to the 220 stars of the originally published version of the catalog (hereafter referred to as “the IUE atlas”). Each object of this sample has been cross-checked with the literature data, mainly relying on the Cayrel et al. (1997) catalog, in order to derive a complete set of atmosphere fundamental parameters from high-resolution spectroscopy at optical wavelength. In case of multiple determinations for the same star, the average values for , , and [M/H] have been considered (retaining, however, only those literature sources with complete estimates of all the three parameters), together with a measure of the nominal uncertainty from the data dispersion.
Our search procedure eventually secured complete atmosphere parameters for 111 stars of the original IUE atlas. For this working sample, Table 2 collects the relevant information, while the three panels of Fig. 8 report the distribution of stars in spectral type, luminosity class and metallicity. In Table 2, columns 1 to 5 give, respectively, the HD number of star, its spectral classification (from the Simbad database), colour excess (from the Fanelli et al., 1992 compilation), atmosphere parameters (from Cayrel et al., 1997 unless otherwise stated), and their rms (for those cases with multiple determinations in the literature).

In order to assure an accurate and homogeneous observational dataset, from the updated INES/IUE database666Our work is based on the INES/IUE general archive hosted at the Mexican and Spanish distribution centers of INAOE (http://www.inaoep.mx) and LAEFF (http://ines.laeff.esa.es/), respectively. we extracted and re-processed all the relevant frames for stars in our sample. In particular, we considered all the available low-dispersion spectra collected in large aperture (20″) mode and with poor-quality flags affecting less than 40% of the wavelength points.777Note that poor-quality flags quite frequently mark background bad pixels in the original IUE frames. Their presence in the extracted 1-D spectra does not necessarily indicate a pixel defeat. In any case, visual inspection on each single image discerned whether the spectrum was to be rejected or not. The number of SWP and LWP/LWR frames eventually used in our analysis are reported in columns 7 and 8 of Table 2.
Wavelength calibration for the whole database was tuned up by fitting several prominent features in the spectra according to the stellar type. For example, for hot stars we mainly relied on Ly, C iv at 1550 Å , Al ii at 1617 Å etc., while for cool stars we used the blend of Si and Cr lines at 2124 Å and the Mg i line at 2852 Å. In any case, at least four lines were used for wavelength fine-tuning. For those stars with multiple observations, the fiducial SED for each star was obtained by averaging the total number of images.
The resulting mean spectrum was weighted by the errors ascribed to the flux given in the INES files. All spectra have then been corrected for Galactic reddening according to Mathis (1990); we assumed = 3.1 and the color excess E(B-V) as reported by Fanelli et al. (1992) (see Table 2). Figure 9 displays an illustrative example of the SED along the spectral-type sequence for stars of different luminosity class.


The observed SED of each star in the IUE working sample has been matched with the theoretical spectra by interpolating the Uvblue library according to the fiducial atmosphere parameters of Table 2. In order to allow a self-consistent comparison, the theoretical SED was then degraded to the IUE 6 Å wavelength resolution and rebinned at the wavelength points of the observations. The comparison was taken over a common wavelength range according to the spectral type. For hot stars this spanned the 1300-3250 Å interval, excluding the extreme UV region shortward of the Ly line, possibly affected by interstellar absorption (Diplas & Savage, 1994; Brandt et al., 1998). As emission of cooler stars drops at nominal values in the far-UV range, for late spectral types we restrained the SED comparison longward of 1650 Å for A-type objects, 2200 Å for the F-G types, and 2500 Å for K and M stars. An example of our comparison procedure, for a selected set of IUE stars of different spectral type, is shown in Fig. 10.
A straightforward measure of the “likeness” between observed and theoretical SED directly derives from the standard deviation of the [(Iue) - (Uvblue)] flux residuals (in the natural logarithm domain), defined as
| (1) |
This definition is independent of the flux offset between theoretical and observed spectra and therefore overcomes any internal uncertainty in the zero-point calibration.888Note that our normalization procedure fully overcomes any internal uncertainty in the zero-point calibration of the INES/IUE database. In this regard, the claimed 7 systematic offset of the IUE archive with respect to HST/FOS data (e.g. González-Riestra et al. (2001)), for instance, has not effect on our comparison.
Figure 11 gives an overall summary of vs. spectral type and luminosity class for the 111 stars in our working sample; the individual values of for each target star are also reported in column 6 of Table 2. It is evident that the rms value drastically degrades for spectral types later than G5, with supergiant stars that are in general more poorly reproduced by the Uvblue models.
Quite importantly, we point out in this regard that our procedure does not search for any best fit to the IUE observations but simply compares the observed spectrum and the corresponding theoretical SED obtained from the fiducial atmosphere parameters of the literature. From one hand, this should certainly assure an independent “acid test” for the theoretical library, though one should also be aware that any inaccurate (or incorrect) set of input fundamental parameters (and even more any uncertainty in the reddening correction) for a star could reflect in a sensibly increase of the value of . In addition, one should also consider that the IUE atlas actually includes a number of “peculiar” objects; a glance to column 9 of Table 2 shows that many stars are double or multiple systems, with an important fraction of spectroscopic binaries and variables. This clearly works in the sense of artificially worsening the match with the theoretical models. We could briefly sketch the relevant results of our comparison across the whole spectral-type sequence:
Early-type stars: O and B
Most stars in this stellar group have complete SWP+LWP/R spectra and comparison with the synthetic SED can be carried out over the full wavelength range. One of the main discrepancies with the Uvblue models is the C iv line at 1550 Å, partly as a consequence of the physical origin of this line, strongly affected by stellar winds and mass loss processes in massive stars. Additionally, we also found that the O iii line at 2496 Å, predicted by the models, is never detected in the observed spectra.
A-type stars
Although to a lesser extent, also for these stars the C iv line (together with the C i and Al ii blend at 1670 Å) is not well matched. As far as low-resolution features are concerned, one main source of discrepancy in late A stars is the Si i spectral break at 1530 Å, poorly reproduced by the synthetic spectra. If we neglect the spectral region around this feature the value of sensibly improves in at least 70% of the cases. On the other hand, it is also worth noting that, for their temperature range, A stars are the strongest far-UV emitters and little uncertainty in the estimated value of can therefore reflect in a large mismatch between observed and theoretical SED (see, e.g. Cheng & Neff, 2003, for a discussion on FUSE data for star 2 And).
Intermediate-type stars: F and G
Only the region longward of 2200 Å was retained for these stars. Prominent metallic features of F stars are always stronger in theoretical flux, in particular the Fe ii blend at 2400 Å and that of Fe i/ Si i at about 2500 Å, as well as the Mg ii resonance doublet at 2800 Å and the Mg i line at 2852 Å. The Mg break around 2600 Å is also poorly reproduced by the models, with the difference increasing for decreasing gravity and effective temperature. For G stars, chromosphere activity becomes increasingly important, in most cases partially filling the Mg ii doublet with a core emission. In general, the 2400–2700 Å spectral region remains the most problematic one (see Fig. 10, lower left panel) confirming the Allende Prieto et al. (2003) hints for a missing Mg i opacity, according to their mid-UV data of the Sun collected during the UARS satellite mission.
Curiously enough, all the three striking outliers in Fig. 11 are G-type stars, namely:
HD 26630: a G0 supergiant with enhanced far-UV emission. The star is reported in the Simbad database as a spectroscopic binary () and Parsons & Ake (1998) decomposed the IUE spectrum isolating the contribution of a hot companion of spectral type B9.
HD 48329: according to Simbad, this G8 supergiant shows microvariability and the HR catalog reports a strong P-Cygni effect for the He 10830 Å infrared line. The IUE spectrum shows a moderate UV excess compared to the theoretical SED according to the fiducial atmosphere parameters, thus suggesting a slightly warmer value for or enhanced continuum emission due to a chromosphere contribution.
HD 195633: the UV spectrum of this G0V star is clearly incompatible with its spectral type suggesting either a problem with its atmosphere parameters or, more likely, with the reddening correction (that in this case might have been underestimated).
Late-type stars: K and M
The UV spectra of these stars are dominated by chromospheric emission and only the wavelength region redder than Å is usefully reproduced by theoretical models. The Mg ii doublet is in strong emission for stars later than K2III or K5V, while the 2852 Å Mg i photospheric line is far more intense in theoretical spectra, especially for giants and supergiants (Fig. 10, lower right panel).


5 Summary and future work
We have built a new grid of theoretical fluxes, the Uvblue library, at high resolution (= 50 000) for a wide volume in the parameter space. The models suitably cover in the H-R diagram the full evolution of high- and low-mass stars and consist of nearly 1800 spectra spanning the wavelength region of 850–4700 Å, the most comprehensive ever computed at high resolution in the ultraviolet-blue spectral band. Unlike most empirical and theoretical libraries, Uvblue includes all stellar types (with comprised between 3000 and 50 000 K) extending its applicability to the study of single stars and stellar systems, through population synthesis models.
Work is in progress to extend the spectral coverage of the grid down to the He ionization edge, in the EUV range, and further explore the parameter space by including “Pop III” stars at [M/H], as well as a wider range of microturbulent velocity. The forthcoming implementation in our code of H2 and Ly quasi-molecular H-H and H-H+ opacities will also allow a substantial refinement in the calculation of far-UV synthetic spectra of intermediate-type stars. The recent analysis of Castelli & Kurucz (2001) indicates, in fact, that the lack of these opacities might explain the disagreement between observed and theoretical spectral energy distributions found in some metal deficient A-type stars.
In this work we have restricted our analysis just to the presentation of the new spectral grid and reviewed some relevant issues for a safe application of the theoretical models to UV observations. Our analysis also included a brief comparison of our LTE models with the corresponding output from the NLTE synthesis code Tlusty. As expected, the match at low spectral resolution is fairly good (however with NLTE models, in average, slightly “redder” compared to the LTE SED for the same ), while a larger difference could be detected for weak lines, that are nearly wiped out by the enhanced core emission component in case of NLTE atmospheres. These effects seem to magnify at metal-poor abundance (typically [M/H]).
A general comparison with UV observations has been carried out, mainly relying on the subset of stars of the Wu et al. (1983) and Fanelli et al. (1990) IUE catalog with complete atmosphere parameters available from the literature. A match with a working sample of 111 objects showed that Uvblue models provide an accurate description of the main mid- and low-resolution spectral features for stars along the whole sequence from the B to G5 type. The residual rms in our comparison procedure, however, sensibly degrades for later spectral types, with supergiant stars that are in general more poorly reproduced than dwarfs. As a possible explanation of the general trend, we point out that observations were compared with theoretical SED built up according to the fiducial atmosphere parameters provided by the literature, and no best fit was searched to the observations. This procedure is, obviously, prone to any uncertainty in the input set for , and [M/H], and in the reddening correction, both effects naturally reflecting in a poorer value of , via eq. (1). In addition, one should also consider the important contamination of the IUE stellar atlas, due to double or multiple stars and to variability effects in most of late-type objects. This clearly works in the sense of artificially worsening the match between theory and observations.
A parallel effort, aimed at constructing a cleaner and complete sample of “normal” stars from the IUE data, and self-consistently complement the estimate of their atmosphere fundamental parameters, is in progress with new optical observations collected by our group at the “G. Haro” Observatory of Cananea (Mexico). A substantially improved agreement with the models should be expected for this tuned stellar sample that, by the way, will also provide a valuable empirical atlas for reference in future studies.
These results will be the subject of a forthcoming paper of this series (Chavez et al., in preparation), where we will also approach in further detail the application of Uvblue synthetic spectra to the analysis of UV narrow-band indices like those of Fanelli et al. (1990). The further application of the Uvblue library for high-resolution stellar population synthesis will be the natural step of our work (Buzzoni et al., in preparation), relying on the Buzzoni (1989, 2002) theoretical code to have a deeper look to the main distinctive properties of galaxy SED.
References
- Allende Prieto et al. (2003) Allende Prieto, C., Hubeny, I., & Lambert, D.L. 2003, ApJ, 591, 1192
- Anders & Grevesse (1989) Anders, E., & Grevesse, N. 1989, Geochim. Cosmochim. Acta, 53, 197
- Barbuy et al. (2003) Barbuy, B., Perrin, M. N., Katz, D., Coelho, P., Cayrel, R., Spite, M., & Van’t Veer-Menneret, C. 2003, A&A, 404, 661
- Bertone et al. (2004) Bertone, E., Buzzoni, A., Chavez, M., & Rodriguez-Merino, L.H. 2004, AJ, 128, 829
- Bertone et al. (2005) Bertone, E., Buzzoni, A., Rodriguez-Merino, L.H., & Chavez, M. 2005, in preparation
- Blanco et al. (1982) Blanco, C., Bruca, L., Catalano, S., & Marilli, E. 1982, A&A, 115, 280
- Böhm-Vitense (1958) Böhm-Vitense, E. 1958, Z. Astrophys., 46, 108
- Böhm-Vitense et al. (2001) Böhm-Vitense, E., Mena-Werth, J., Carpenter, K. G., & Robinson, R. D. 2001, ApJ, 550, 457
- Bouret et al. (2003) Bouret, J.-C., Lanz, T., Hillier, D. J., Heap, S. R., Hubeny, I., Lennon, D. J., Smith, L. J., & Evans, C. J. 2003, ApJ, 595, 1182
- Brandt et al. (1998) Brandt J. C., Heap, S. R., Beaver, E. A., et al. 1998, AJ, 116, 941
- Bressan et al. (1994) Bressan, A., Chiosi, C., & Fagotto, F. 1994, ApJS, 94, 63
- Brown et al. (1996) Brown, T. M., Ferguson, H. C., & Davidsen, A. F. 1996, ApJ, 472, 327
- Bruzual & Charlot (2003) Bruzual, A. G., & Charlot, S. 2003, MNRAS, 344, 1000
- Buzzoni (1989) Buzzoni, A. 1989, ApJS, 71, 817
- Buzzoni (2002) Buzzoni, A. 2002, AJ, 123, 1188
- Buzzoni (2003) Buzzoni, A. 2003, in Star Formation through Time, ASP Conf. Ser. 297, eds. E. Perez, R.M. Gonzalez Delgado, G. Tenorio-Tagle, (ASP: San Francisco) p. 471
- Castelli et al. (1997) Castelli, F., Gratton, R. G., & Kurucz, R. L. 1997, A&A, 318, 841
- Castelli & Kurucz (2001) Castelli, F., & Kurucz, R. L. 2001, A&A, 372, 260
- Cayrel et al. (1997) Cayrel de Strobel G., Soubiran C., Friel, E. D., Ralite N., & Francois P. 1997, A&AS, 124, 299
- Cheng & Neff (2003) Cheng, K.P., & Neff, J.E. 2003, AJ, 125, 868
- Diplas & Savage (1994) Diplas, A., & Savage, B. D. 1994, ApJS, 93, 211
- Fanelli et al. (1990) Fanelli, M. N., O’Connell, R. W., Burstein, D., & Wu, C. 1990, ApJ, 364, 272
- Fanelli et al. (1992) Fanelli, M. N., O’Connell, R. W., Burstein, D., & Wu, C. 1992, ApJS, 82, 197
- Fitzpatrick & Massa (1999) Fitzpatrick, E. L., & Massa, D. 1999, ApJ, 525, 1011
- Franchini, Morossi & Malagnini (1998) Franchini, M., Morossi, C., & Malagnini, M.L. 1998, ApJ, 508, 370
- Gardiner, Kupka, & Smalley (1999) Gardiner, R. B., Kupka, F., & Smalley, B. 1999, A&A, 347, 876
- Girardi et al. (2000) Girardi, L., Bressan, A., Bertelli, G., & Chiosi, C. 2000, A&AS, 141, 371
- Glebocki & Stawikowski (2000) Glebocki, R., & Stawikowski, A. 2000, Acta Astronomica, 50, 509
- Gonzalez Delgado & Leitherer (1999) Gonzalez Delgado, R.M., & Leitherer, C. 1999, ApJS, 125, 479
- Gonzalez Delgado et al. (2004) Gonzalez Delgado, R.M., Cerviño, M., Martins, L.P., Leitherer, C., & Hauschildt, P.H. 2004, MNRAS, submitted
- González-Riestra et al. (2001) González-Riestra, R., Cassatella, A, & Wamsteker, W. 2001, A&A, 373, 730
- Gray, Graham, & Hoyt (2001) Gray, R. O., Graham, P. W., & Hoyt, S. R. 2001, AJ, 121, 2159
- Gunn & Stryker (1983) Gunn, J.E., & Stryker, L.L. 1983, ApJS, 52, 121
- Gustafsson et al. (1975) Gustafsson, B., Bell, R. A., Eriksson, K., & Nordlund, A. 1975, A&A, 42, 407
- Hauschildt et al. (1995) Hauschildt, P. H., Starrfield, S., Shore, S. N., Allard, F., & Baron, E. 1995, ApJ, 447, 829
- Holweger (1970) Holweger, H. 1970, A&A, 4, 11
- Hubeny & Lanz (1992) Hubeny, I., & Lanz, T. 1992, A&A, 262, 501
- Jacoby, Hunter & Christian (1984) Jacoby, G. H., Hunter, D.A., & Christian, C. A. 1984, ApJS, 56, 257
- Kudritzki (1976) Kudritzki, R.P. 1976, A&A, 52, 11
- Kudritzki & Puls (2000) Kudritzki, R., & Puls, J. 2000, ARA&A, 38, 613
- Kurucz (1979) Kurucz, R. L. 1979, ApJS, 40, 1
- Kurucz (1992) Kurucz, R. L. 1992, Rev. Mex. Astron. Astrof., 23, 45
- Kurucz (1993a) Kurucz, R. L. 1993a, CD-ROM 13, Atlas9 Stellar Atmosphere Programs and 2 km/s Grid Cambridge: Smithsonian Astrophys. Obs.
- Kurucz (1993b) Kurucz, R. L. 1993b, CD-ROMs 1, 15 and 18, Synthe Spectrum Synthesis Programs and Line Data. Cambridge: Smithsonian Astrophys. Obs.
- Kurucz (1995) Kurucz, R. L. 1995, Proceedings of the workshop Laboratory and Astronomical High Resolution Spectra, ASP Conf. Series, vol. 81, A. J. Sauval, R. Blomme, N. Grevesse, Editors, p. 583
- Lanz & Hubeny (2003) Lanz, T. & Hubeny, H. 2003, ApJS, 146
- Le Borgne et al. (2003) Le Borgne, J. F., Bruzual, G., Pelló, R., Lançon, A., Rocca-Volmerange, B., Sanahuja, B., Schaerer, D., Soubiran, C., & Vílchez-Gómez, R et al. 2003, A&A, 402, 433
- Leckrone et al. (1990) Leckrone, D.S., Sveneric, J., Kurucz, R.L., & Adelman, S.J. 1990, in the 3rd Intl. Coll. of the Royal Netherlands Academy of Arts and Sciences, ed. J. E. Hansen Amsterdam, p.3
- Leitherer et al. (1999) Leitherer, C., Schaerer, D., Goldader, J. E., Gonzalez-Delgado, R. M., Robert, C., Kune, D. F., de Mello, D. F., Devost, D., & Heckman, T. M. 1999, ApJS, 123, 3
- Mathis (1990) Mathis, J.S. 1990, ARA&A, 28, 37
- Mihalas (1972) Mihalas, D. 1972, ApJ, 176, 139
- Moos et al. (2000) Moos, H. W., et al. 2000, ApJ,538, L1
- Morales et al. (2000) Morales, C., Trampero, J., Gomez, J. F., Gimenez, A., Orozco, V., Bowyer, S., Edelstein, J., Korpela, E., Lampton, M., & Cobb, J. 2000, ApJ, 530, 403
- Morossi et al. (2002) Morossi, C., Di Marcantonio, P., Franchini, M., Malagnini, M. L., & Chavez, M. 2002, ApJ, 577, 377
- Parsons & Ake (1998) Parsons, S.B., & Ake, T.B. 1998, ApJS, 119, 83
- Pellerin et al. (2002) Pellerin, A., Fullerton, A. W., Robert, C., Howk, J. C., Hutchings, J. B., Walborn, N. R., Bianchi, L., Crowther, P. A., & Sonneborn, G. 2002, ApJS, 143, 159
- Pettini (2002) Pettini, M. 2002 in New Quests of Stellar Astrophysics, eds. M. Chavez, A. Bressan, A. Buzzoni, & D. Mayya (Kluwer: Dordrecht) p. 229
- Pickles (1985) Pickles, A. J. 1985, ApJS, 59, 33
- Salasnich et al. (2000) Salasnich, B., Girardi, L., Weiss, A., & Chiosi, C. 2000, A&A, 361, 1023
- Schaerer & de Koter (1997) Schaerer, D., & de Koter, A. 1997, A&A, 322, 598
- Uesigi & Fukuda (1982) Uesigi, A., & Fukuda, I. 1982, ”Revised Catalogue of Stellar Rotational Velocities”, CDS/Cat/III/63B
- Vazdekis (1999) Vazdekis, A. 1999, ApJ, 513, 224
- Walborn et al. (2002) Walborn, N. R., Fullerton, A. W., Crowther, P. A., Bianchi, L., Hutchings, J. B., Pellerin, A., Sonneborn, G., & Willis, A. J. 2002, ApJS, 141, 443
- Werner (1988) Werner, K. 1988, A&A, 204, 159
- Worthey (1994) Worthey, G. 1994, ApJS, 95, 107
- Wu et al. (1983) Wu, C.-C., Ake, T.B., Boggess, A., Bohlin, R.C., Imhoff, C.L., Holm, A.V., Levay, Z.G., Panek, R.J.Schiffer, F.H., & Turnrose, B.E. 1983, The IUE Ultraviolet Spectral Atlas, Greenbelt: NASA-GSFC.
| HD | Sp. Type | E(B-V) | //[M/H] | rms | # images | Remarks | ||
|---|---|---|---|---|---|---|---|---|
| SWP | LWR/LWP | |||||||
| 2151 | G2 IV | 0.00 | 5793/4.05/-0.17 | 71/0.25/0.10 | 0.34 | 14 | 3 | Variable |
| 3360 | B2 IV | 0.04 | 22180/3.92/-0.23 | -/-/- | 0.08 | 21 | 65 | Variable |
| 4128 | K0 III | 0.00 | 4836/2.62/0.01 | 86/0.22/0.12 | 0.79 | 5 | 4 | Variable |
| 4307 | G2 V | 0.00 | 5736/3.99/-0.32 | 103/0.09/0.06 | 0.27 | 0 | 2 | - |
| 4614 | G0 V | 0.00 | 5809/4.41/-0.23 | 135/0.04/0.06 | 0.28 | 4 | 2 | Spec-Binary |
| 6203 | K0 III | 0.00 | 4560/2.96/-0.35 | -/-/- | 0.79 | 0 | 2 | Dbl-System |
| 10307 | G1.5 V | 0.00 | 5845/4.35/-0.02 | 74/0.05/0.01 | 0.38 | 1 | 1 | - |
| 10380 | K3 IIIb | 0.00 | 4052/1.43/-0.29 | 60/0.47/0.05 | 0.95 | 1 | 2 | - |
| 10476 | K1 V | 0.00 | 5196/4.50/-0.20 | -/-/- | 0.53 | 2 | 3 | Variable |
| 10700 | G8 V | 0.00 | 5229/4.36/-0.53 | 125/0.36/0.11 | 0.38 | 8 | 3 | - |
| 10780 | K0 V | 0.00 | 5419/4.60/0.36 | -/-/- | 0.53 | 4 | 5 | - |
| 14802 | G2 V | 0.00 | 5917/4.30/-0.09 | 16/0.15/0.13 | 0.33 | 1 | 2 | - |
| 17081 | B7 IV | 0.00 | 12807/3.64/0.05 | 901/0.31/0.46 | 0.07 | 1 | 1 | - |
| 17709 | K5 III | 0.00 | 3880/1.42/-0.36 | -/-/- | 1.01 | 1 | 1 | Variable |
| 19058 | M4 II | 0.00 | 3500/0.80/0.05 | -/-/- | 1.17 | 4 | 7 | Pulsating |
| 19476 | K0 III | 0.00 | 4953/3.09/0.10 | 24/0.29/0.06 | 0.69 | 0 | 1 | Variable |
| 20630 | G5 Vvar | 0.00 | 5648/4.41/0.03 | 32/0.09/0.04 | 0.49 | 17 | 3 | Variable |
| 22049 | K2 V | 0.00 | 5058/4.55/-0.20 | 79/0.25/0.08 | 0.61 | 78 | 15 | Variable |
| 22879 | F9 V | 0.00 | 5838/4.15/-0.88 | 62/0.17/0.07 | 0.17 | 1 | 3 | - |
| 26630 | G0 Ib | 0.19 | 5331/1.38/0.02 | 159/0.13/0.21 | 1.24 | 7 | 2 | Spec-Binary |
| 27383 | F9 V | 0.00 | 6280/4.55/0.10a | -/-/- | 0.28 | 1 | 1 | In-Cluster |
| 27561 | F5 V | 0.00 | 6700/4.33/0.04a | -/-/- | 0.23 | 0 | 1 | In-Cluster |
| 27808 | F8 V | 0.00 | 6340/4.36/0.10a | -/-/- | 0.27 | 2 | 2 | In-Cluster |
| 27836 | G1 V | 0.00 | 6120/4.65/-0.08a | -/-/- | 0.38 | 3 | 3 | Variable |
| 28527 | A6 IV | 0.00 | 7986/4.18/0.14b | -/-/- | 0.21 | 1 | 2 | Variable |
| 29139 | K5 III | 0.00 | 3903/1.26/-0.10 | 150/0.36/0.22 | 1.03 | 20 | 1 | Variable |
| 34816 | B0.5 IV | 0.00 | 30695/4.14/0.38 | 1138/0.12/0.88 | 0.05 | 19 | 34 | - |
| 35620 | K3IIICN | 0.00 | 4238/1.68/-0.14 | 131/0.42/0.22 | 0.95 | 0 | 2 | Dbl-System |
| 36512 | B0 V | 0.04 | 31500/4.13/0.25 | -/-/- | 0.08 | 2 | 3 | - |
| 36673 | F0 Ib | 0.02 | 7234/1.38/-0.04 | 208/0.33/0.08 | 0.20 | 2 | 1 | Variable |
| 37160 | K0 IIIb | 0.00 | 4504/2.56/-0.58 | 287/0.24/0.17 | 0.69 | 0 | 1 | - |
| 38666 | O9.5 V | 0.00 | 31790/4.00/-0.74c | -/-/- | 0.07 | 15 | 27 | Varaible |
| 38899 | B9 IV | 0.00 | 10903/4.00/0.01 | 75/0.14/0.09 | 0.08 | 1 | 1 | Dbl-System |
| 40136 | F1 V | 0.03 | 7127/4.14/-0.13 | 250/0.13/0.08 | 0.14 | 3 | 3 | - |
| 44478 | M3 III | 0.00 | 3600/1.00/0.11 | -/-/- | 1.09 | 1 | 3 | Variable |
| 46328 | B1 III | 0.01 | 27720/4.00/-0.18 | -/-/- | 0.07 | 1 | 1 | Variable |
| 48329 | G8 Ib | 0.26 | 4592/0.81/-0.05 | 21/0.17/0.03 | 1.68 | 4 | 4 | Variable |
| 49293 | K0 IIIa | 0.00 | 4620/2.59/-0.12 | -/-/- | 0.80 | 0 | 2 | - |
| 54605 | F8 Iab: | 0.09 | 6222/1.00/0.35 | -/0.28/0.23 | 0.46 | 6 | 3 | Variable |
| 54719 | K2 III | 0.00 | 4350/2.17/0.02 | -/-/- | 0.92 | 0 | 1 | Variable |
| 55575 | G0 V | 0.00 | 5878/4.23/-0.36 | 120/0.35/0.11 | 0.29 | 0 | 1 | - |
| 59612 | A6Ib/II | 0.14 | 8100/1.50/0.08 | -/-/- | 0.19 | 2 | 2 | Multiple-Sta |
| 62509 | K0 IIIb | 0.00 | 4890/2.66/0.07 | 78/0.30/0.27 | 0.71 | 12 | 5 | Variable |
| 63922 | B0 III | 0.11 | 30300/4.00/0.33 | -/-/- | 0.09 | 1 | 1 | Dbl-System |
| 64606 | G8 V | 0.00 | 5139/4.08/-0.99 | 68/0.25/0.03 | 0.44 | 0 | 1 | - |
| 66141 | K2 III | 0.00 | 4250/2.29/-0.36 | -/-/- | 0.86 | 0 | 1 | Dbl |
| 69267 | K4 III | 0.00 | 4072/1.73/-0.17 | 211/0.14/0.10 | 0.99 | 2 | 1 | Variable |
| 70272 | K4.5 III | 0.00 | 3900/1.59/-0.03 | -/-/- | 1.00 | 0 | 1 | Variable |
| 72184 | K2 III | 0.00 | 4525/2.05/-0.05 | -/-/- | 0.92 | 0 | 2 | - |
| 72324 | G9 III | 0.00 | 4730/2.08/-0.10 | 28/0.25/0.14 | 0.91 | 0 | 2 | - |
| 73471 | K1 III | 0.00 | 4500/2.36/0.05 | -/-/- | 0.99 | 0 | 1 | - |
| 75732 | G8 V | 0.00 | 5196/4.47/0.22 | -/0.06/0.10 | 0.69 | 0 | 1 | - |
| 76294 | G9II-II | 0.00 | 4870/2.49/-0.01 | 26/0.29/0.34 | 0.75 | 2 | 2 | - |
| 78647 | K4Ib-II | 0.07 | 4235/1.40/0.23 | -/-/- | 1.40 | 2 | 3 | Variable |
| 82328 | F6 IV | 0.00 | 6227/3.98/-0.11 | 245/0.30/0.10 | 0.21 | 2 | 3 | Spec-Binary |
| 84441 | G1 II | 0.08 | 5343/2.05/-0.08 | 66/0.35/0.23 | 0.64 | 0 | 2 | Variable |
| 85503 | K2 III | 0.00 | 4501/2.37/0.16 | 128/0.24/0.19 | 0.97 | 0 | 2 | - |
| 89025 | F0 III | 0.00 | 7182/2.97/0.12d | -/-/- | 0.16 | 1 | 1 | Variable |
| 90839 | F8 V | 0.00 | 6072/4.41/-0.23 | -/-/- | 0.24 | 2 | 1 | Dbl-System |
| 95272 | K1 III | 0.00 | 4494/2.76/-0.08 | 407/0.27/0.16 | 0.87 | 1 | 1 | - |
| 99028 | F4 IV | 0.06 | 6739/3.98/0.06 | -/-/- | 0.22 | 3 | 2 | Spec-Binary |
| 101501 | G8 V | 0.00 | 5508/4.64/-0.05 | 42/0.06/0.12 | 0.55 | 3 | 1 | Variable |
| 102870 | F9 V | 0.00 | 6124/4.24/0.19 | 57/0.10/0.07 | 0.30 | 4 | 1 | - |
| 106516 | F5 V | 0.00 | 6089/4.25/-0.76 | 137/0.24/0.16 | 0.15 | 3 | 2 | - |
| 109379 | G5 II | 0.00 | 5147/2.15/0.08 | 31/0.07/0.27 | 0.69 | 3 | 2 | Variable |
| 113139 | F2 V | 0.01 | 6890/4.13/0.02a | -/-/- | 0.17 | 1 | 1 | Multiple |
| 114710 | F9.5 V | 0.00 | 6008/4.44/0.10 | 103/0.06/0.12 | 0.30 | 3 | 2 | - |
| 115617 | G5 V | 0.00 | 5596/4.24/-0.03 | 5/0.25/0.01 | 0.43 | 1 | 2 | - |
| 117176 | G4 V | 0.00 | 5478/3.75/-0.11 | -/-/- | 0.43 | 1 | 1 | - |
| 125560 | K3 III | 0.00 | 4400/2.42/0.00 | -/-/- | 0.91 | 0 | 2 | Variable |
| 126660 | F7 V | 0.00 | 6338/4.29/-0.05 | -/-/- | 0.25 | 3 | 1 | Variable |
| 132345 | K3IIICN | 0.00 | 4322/2.08/0.05 | 105/0.38/0.09 | 0.90 | 0 | 1 | Dbl-System |
| 134083 | F5 V | 0.00 | 6632/4.50/0.10 | -/-/- | 0.20 | 2 | 2 | Variable |
| 137759 | K2 III | 0.00 | 4515/2.67/0.17 | 36/0.10/0.19 | 0.91 | 2 | 1 | Variable |
| 140573 | K2 IIIb | 0.00 | 4555/2.38/0.11 | 51/0.44/0.17 | 0.92 | 3 | 1 | Dbl-System |
| 142091 | K1 IVa | 0.00 | 4800/3.37/-0.04 | -/-/- | 0.71 | 0 | 1 | - |
| 142373 | F8Ve… | 0.00 | 5880/4.20/-0.42 | 57/0.18/0.08 | 0.22 | 4 | 1 | - |
| 142860 | F6 IV | 0.00 | 6340/4.10/-0.13a | -/-/- | 0.21 | 3 | 1 | Varible |
| 142980 | K1 IV | 0.00 | 4560/3.22/0.06 | -/-/- | 0.84 | 0 | 2 | - |
| 145328 | K1III-I | 0.00 | 4720/3.25/-0.20 | -/-/- | 0.71 | 0 | 1 | Variable |
| 145675 | K0 V | 0.00 | 5265/4.49/0.26 | 105/0.07/0.08 | 0.58 | 0 | 1 | - |
| 147394 | B5 IV | 0.02 | 14868/3.81/0.00 | 88/0.19/0.48 | 0.05 | 5 | 4 | Variable |
| 150680 | G0 IV | 0.00 | 5742/3.76/-0.07 | 81/0.05/0.12 | 0.36 | 4 | 1 | Spec |
| 157244 | K3Ib-II | 0.00 | 4582/1.30/0.50 | -/-/- | 1.38 | 1 | 1 | - |
| 159181 | G2 Iab: | 0.15 | 5334/1.48/0.21 | 56/0.14/0.10 | 0.95 | 13 | 3 | Dbl-System |
| 159561 | A5 III | 0.00 | 8126/3.97/0.30d | -/-/- | 0.22 | 2 | 3 | Variable |
| 161471 | F2 Iae | 0.00 | 7000/1.30/0.27 | -/-/- | 0.34 | 2 | 2 | Emission |
| 161797 | G5 IV | 0.00 | 5463/3.92/0.19 | 60/0.18/0.12 | 0.55 | 6 | 2 | - |
| 163506 | F2 Ibe | 0.11 | 6400/1.20/-0.41 | -/-/- | 0.26 | 11 | 9 | Pulsating |
| 173667 | F6 V | 0.00 | 6337/4.08/-0.12 | 64/0.25/0.14 | 0.23 | 2 | 1 | Variable |
| 182572 | G8IV… | 0.00 | 5658/4.15/0.35 | 144/0.25/0.14 | 0.48 | 2 | 2 | Variable |
| 185144 | K0 V | 0.00 | 5169/4.50/-0.24 | 37/0.14/0.01 | 0.47 | 3 | 4 | Variable |
| 187691 | F8 V | 0.00 | 6146/4.34/0.12 | -/0.13/0.02 | 0.28 | 1 | 1 | - |
| 188512 | G8 IV | 0.00 | 5212/3.09/-0.03 | 161/1.03/0.26 | 0.58 | 1 | 2 | Variable |
| 193432 | B9 IV | 0.00 | 10313/3.75/0.03 | 289/0.27/0.21 | 0.08 | 1 | 1 | Dbl-System |
| 195633 | G0 Vw | 0.00 | 5969/3.75/-1.00 | 249/0.07/0.14 | 1.34 | 0 | 1 | - |
| 198149 | K0 IV | 0.00 | 4965/3.18/-0.18 | 123/0.22/0.27 | 0.62 | 2 | 1 | - |
| 200580 | F9 V | 0.00 | 5727/3.50/-0.75 | -/-/0.07 | 0.19 | 0 | 2 | Multiple |
| 201091 | K5 V | 0.00 | 4364/4.55/-0.05 | 37/0.10/0.04 | 0.62 | 14 | 18 | Variable |
| 201092 | K7 V | 0.00 | 3868/4.58/-0.19 | 133/0.13/0.26 | 0.47 | 2 | 14 | Flare-Star |
| 206778 | K2 Ib | 0.20 | 4272/1.02/0.02 | 129/0.16/0.18 | 1.45 | 5 | 2 | Variable |
| 206859 | G5 Ib | 0.17 | 4861/1.45/-0.02 | 27/0.30/0.04 | 1.20 | 3 | 1 | Variable |
| 207978 | F6IV-Vw | 0.00 | 6233/4.03/-0.59 | 102/0.20/0.07 | 0.16 | 0 | 1 | - |
| 209750 | G2 Ib | 0.12 | 5251/1.36/0.18 | 92/0.12/0.12 | 0.86 | 30 | 1 | Dbl-System |
| 215648 | F7 V | 0.00 | 6134/4.14/-0.32 | 119/0.04/0.05 | 0.20 | 1 | 2 | - |
| 216385 | F7 IV | 0.00 | 6144/3.93/-0.44 | 92/0.13/0.14 | 0.21 | 0 | 1 | - |
| 216956 | A3 V | 0.00 | 8760/4.20/0.20b | -/-/- | 0.11 | 4 | 4 | Variable |
| 217877 | F8 V | 0.00 | 6000/4.50/-0.10 | -/-/- | 0.28 | 0 | 1 | - |
| 219134 | K3 V | 0.00 | 4695/4.48/0.01 | 22/0.04/0.14 | 0.62 | 1 | 4 | Flare-Star |
| 222368 | F7 V | 0.00 | 6106/4.06/-0.31a | 116/0.19/0.13 | 0.22 | 4 | 2 | Variable |
| 224930 | G5 Vb | 0.00 | 5305/4.49/-0.88 | 189/0.13/0.19 | 0.28 | 0 | 2 | Spec-Binary |