SGR giant flares in the BATSE short GRB catalogue: constraints from spectroscopy
Abstract
The giant flare observed on Dec. 27th 2004 from SGR 1806–20 has revived the idea that a fraction of short (2 s) Gamma Ray Bursts (GRBs) is due to giant flares from Soft Gamma Ray Repeaters located in nearby galaxies. One of the distinguishing characteristics of these events is the thermal (black body) spectrum with temperatures ranging from 50 to 180 keV, with the highest temperature observed for the initial 0.2 s spike of the Dec. 27th 2004 event. We analyzed the spectra of a complete sample of short GRBs with peak fluxes greater than 4 photon s-1 cm-2 detected by BATSE. Of the 115 short GRBs so selected only 76 had sufficient signal to noise to allow the spectral analysis. We find only 3 short GRBs with a spectrum well fitted by a black body, with keV, albeit with a considerably longer duration (i.e. 1 sec) and a more complex light curve than the Dec. 27th 2004 event. This implies a stringent limit on the rate of extragalactic SGR giant flares with spectral properties analogous to the Dec. 27th flare. We conclude that up to 4 per cent of the short GRBs could be associated to giant flares ( confidence). This implies that either the distance to SGR 1806–20 is smaller than 15 kpc or the rate of Galactic giant flares is lower than the estimated yr-1.
keywords:
gamma-ray: bursts — stars: neutron — radiation mechanisms: thermal1 Introduction
At 21:30 UT on December 27th 2005 a giant flare of –rays from the soft gamma repeater (SGR) SGR 1806–20 was detected by INTEGRAL (Borkowski et al. 2004). The flare was detected by all the active –ray observatories (Hurley et al. 2005; Palmer et al. 2005) and by particle detectors (Schwartz et al. 2005; Terasawa et al. 2005). SGRs are very likely hyper–magnetic isolated neutron stars (Thompson & Duncan 1995, 1996), with G. They are believed to be related to anomalous X–ray pulsars (AXPs; Mereghetti & Stella 1995), a class of neutron stars with anomalously high X–ray luminosity and spin down rates. AXPs and SGRs share also an inferred magnetic field in the G range.
The flare followed a weak precursor (Hurley et al. 2005; Mereghetti et al. 2005), with a spectrum similar to the one of the recurrent weak bursts that characterize SGRs, but with much longer duration. After the initial huge spike, which lasted ms, a roughly exponential tail of emission characterized by the presence of a deep periodic modulation at the spin period of the neutron star s was observed for s. A radio afterglow was detected on a week time scale (Cameron et al. 2005; Gaensler et al. 2005), possibly accompanied by X–ray emission (Mereghetti et al. 2005).
The Dec. 27th flare is not the first giant flare detected from an SGR. In 1979, a giant flare was detected from SGR 0525–66 in the large Magellanic cloud (Mazets et al. 1979). Due to the saturation of the instruments only a lower limit of few erg to the energetics of the flare was derived. On August 27th 1998 a giant flare was detected from SGR 1900+14, for a total energetics of erg (Hurley et al. 1999). The recent flare from SGR 1806–20 stands out in terms of its energetics. The initial spike contains ergs, approximately a factor of 100 more than in any previous recorded event. The peak flux was photons cm-2 s-1 (Terasawa et al. 2005) giving a luminosity erg s-1 (Hurley et al. 2005). Such estimate relies on the assumed distance of kpc to SGR 1806–20 (Corbel et al. 1997; Corbel & Eikenberry 2004; but see Figer et al. 2005, Cameron et al. 2005; McClure-Griffiths & Gaensler 2005).
Such a brightness makes extragalactic SGR giant flares (SGRGFs) interesting as a possible source of short GRBs (Duncan 2001; Eichler 2002; Hurley et al. 2005; Nakar et al. 2005; Palmer et al. 2005). Assuming a threshold count rate of photons cm-2 s-1 in the keV band for the BATSE trigger we derive, convolving a black body spectrum with keV to the BATSE response matrix, a maximum distance of Mpc out to which an SGR with peak luminosity erg s-1 can be detected. This distance includes the Virgo Cluster of Galaxies (see Popov & Stern 2005). Adopting the blue luminosity density normalization from Hurley et al. (2005) and considering the BATSE sky coverage, we derive an expected extragalactic SGRGF detection rate of:
| (1) |
where is the average time interval between the detection of two Galactic SGRGF and is the distance to SGR 1806–20 in units of 15 kpc. This implies that approximatively 60 per cent of the 500 BATSE short GRBs (defined as GRBs with s with peak flux exceeding 0.5 phot cm-2 sec-1) should be associated to SGRGFs.
It is possible to recognize SGRGF candidates in the BATSE catalogue with different techniques. First, all the SGRs we know are inside Galaxies and, since extragalactic SGRGFs can be detected up to a relatively small distance, most of them should be associated to bright star forming galaxies111Note that one of the three known giant flares comes from the Large Magellanic Cloud.. Nakar et al. (2005, see also Hurley et al. 2002) studied 5 short GRBs error boxes, well localized by the interplanetary network. They do not find any association, implying a loose upper limit of less than () of SGRGFs in the BATSE short GRB catalogue. Popov & Stern (2005) apply an analogous technique by looking for possible associations of short GRBs with high star formation galaxies and the Virgo cluster. They do not find any association. They conclude that the rate of erg flares in our Galaxy should be less than one every 25 years and that the rate of giant erg flares should be less than one in 1000 years.
In this letter we use the spectral diversity of SGRGFs with respect to GRBs to search for candidate extragalactic SGRGFs in the BATSE short GRB catalogue. The Dec. 27th flare had a black body spectrum with average keV. Such a spectrum is harder than a non-thermal GRB spectrum and can be singled out from non–thermal GRB spectra even with a moderate number of counts.
2 Spectral Analysis
We have selected in the sample of 497 short duration GRBs (i.e. sec - see also Magliocchetti et al. 2002) detected by BATSE between May 2, 1991 and May 25, 2000 all the bursts with a peak flux larger than 4 phot cm-2 s-1 in the energy range 50–300 keV (on the 64 ms timescale). This cut was chosen in order to assure enough signal to noise for a meaningful spectral analysis. More importantly, it is the lowest flux for which spectral analysis of the events can be performed irrespectively of their duration. In some cases the spectral analysis was not possible, but this was due either to high background or non optimal detection configuration, without any correlation to the burst duration. We selected in this way 115 GRBs: their durations are between 0.034 and 1.98 sec, with an average of 0.6 sec, and their average fluence (integrated above 25 keV) is of 2.8 erg cm-2.
We analyzed the BATSE (LAD) data of these bursts with the standard methods (e.g. Preece et al. 2000). Only for 76 GRBs we could extract an average spectrum with enough signal to perform the spectral analysis. We fitted both the cutoff–powerlaw (CPL) model, that fits well the spectrum of the 28 brightest short BATSE bursts (Ghirlanda, Ghisellini & Celotti 2004, which are included in the sample of 76 analyzed), and a black body (BB) spectrum representative of the class of SGRs.
We found 3 out of 76 GRBs whose time integrated spectrum is well fitted with a black body model and 15 events that does not exclude a possible fit with a black body model, i.e. yields a reduced . This admittedly large value clearly selects also those spectra with a very low signal to noise which does not exclude the BB fit as well as any non–thermal model. However, 12 of these events present systematic residuals at low and/or high energies when fitted with a BB model. Adding a non–thermal component (i.e. powerlaw, PL) to their spectra improves significantly the fit in most cases. The F–test probability of the null hypothesis that the fit improves when adding model components ranges between () and () for these 12 cases. Nine of these 15 GRBs fitted with the BB+PL model present a BB temperature not larger than 120 keV. Little more can be said for the remaining 6 due to the low signal to noise. Since the best fit non–thermal component includes a sizable fraction of the flux, we consider these spectra intrinsically different from the pure black body spectrum of the giant flare from SGR 1806–20. However, models with more than two degrees of freedom were not compared to the data of SGR 1806-20, and so such mixed models ought to be considered plausible. Guidorzi et al. (2004) find that the BeppoSAX data of SGR 1900+14 cannot be fitted with a black-body spectrum. In addition the best–fit BB model temperatures are always much smaller than the keV observed in the giant flare. Similar spectral fits (BB+PL) have been performed and found acceptable for long GRBs as well (Ghirlanda, Celotti & Ghisellini 2003; Ryde 2004, Ghirlanda et al. 2005). In the next section we concentrate on the three remaining cases, for which a fully consistent black body spectrum is found. We also analyze in more detail three BB+PL bursts with interesting characteristics.

3 Candidate SGR giant flares
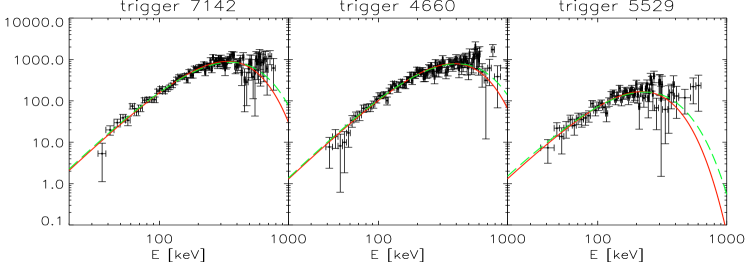
In Tab. 1 we report the basic properties of the 3 short GRBs candidates showing evidence of a black body spectrum. As shown in the table and in Fig. 1, the fit with a non–thermal CPL model results in a low energy photon spectral index 1.0 which indicates an extremely hard spectrum when compared to the typical values found in the class of bright long bursts (Ghirlanda, Celotti & Ghisellini 2002, 2003; Preece et al. 2000).
The spectra of trigger 7142 and 4660 are well fit by a black body model with a characteristic temperature of 86 and 98 keV, respectively. The normalization of these two bursts is also similar. A lower temperature ( keV) and normalization is instead found for trigger 5529. We also verified the robustness of these fits applying the same tests proposed in Ghirlanda et al. (2003). In particular for the 3 bursts: (i) we selected different time intervals to compute the GRB background, (ii) we analyzed the spectra of 2nd brightest illuminated LAD detector and (iii) we used a different Detector Response Matrix (of a GRB observed near the position of these bursts but in a different epoch). Given the difficulty in the spectral analysis to account for the sources of systematic errors, these tests reinforce the result that the spectrum of these 3 bursts is indeed the one presented in Tab. 1 and Fig. 1. This is the first evidence of black body spectra also in the class of short GRBs (see Ghirlanda et al. 2003, Ryde et al. 2004 for long GRBs).
The fact that these three events have a black body spectrum does not
necessarily imply that they are SGRGFs. It is indeed strange that the
only few candidates are found in the intermediate temperature range,
since, assuming a simple luminosity function of SGRGFs (e.g. a
power-law), either the low or high temperature ends should dominate
the statistics. Several consistency checks can be performed. We first
take a look at their light curves. These are shown in
Fig. 2 for the 4660 and 5529 triggers with 64 ms
resolution. No publicly available 64 ms resolution light curve for
trigger 7142 could be found. The two light curves are characterized by
two spikes of emission, well separated by a quiescent interval of
around 100 ms. A similar behaviour seems to characterize the 7142 low
resolution light curve posted on the BATSE website222ftp://cossc.gsfc.nasa.gov/compton/data/batse
/trigger/07001_07200/07142_burst. Such light curves are different
from the initial spikes of giant flares that have some variability but
at a moderate level (Terasawa et al. 2005). Also the duration of the
three candidates, of the order of one second, is longer than the
typical ms observed in SGRGFs. No suitable thermal
spectrum candidate can be found for a GRB with duration around
s, where all the SGRGFs have been observed to date.
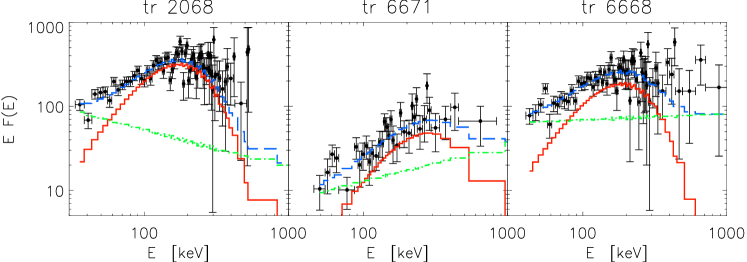
If we relax the hypothesis that the spectrum of short GRBs – SGRGF candidates should be a pure BB, we might still find candidates in the 15 GRBs whose does not exclude the BB model. We further limited the search among these 15 short bursts to those cases with a single peaked light curve lasting less than 0.6 sec (i.e. 2.5 longer than SGR 1806-20). We found 3 candidates, i.e. trigger 2068, 6671 and 6668, whose spectral parameters are reported in the second part of Tab. 1. In these cases the spectrum deviates from a pure BB model at low and/or high energies and can be better represented by a two component model, i.e. adding a PL to the BB (spectral parameters of the pure BB and BB+PL are reported in the first and second line of each entry in Tab. 1). The F-test probabilities for the BB+PL model with respect to the BB model are 7, and 5 for trigger 2068, 6671 and 6668, respectively. The spectra of these 3 bursts and the best BB+PL model are shown in Fig. 3.
| Trigger | RA | Dec | (dof) | kT | (dof) | ||||||
| s | ph/(cm2 s) | [keV] | [keV] | ||||||||
| 7142 | 275.23 | 44.05 | 2.0 | 0.970.06 | 5.800.28 | 1.07 | 35561 | 0.95 (107) | 86 | 23.26 | 0.97 (108) |
| 4660 | 305.83 | 40.27 | 1.9 | 1.170.08 | 5.150.30 | 1.09 | 40566 | 0.9 (101) | 98 | 20.58 | 0.93 (102) |
| 5529 | 29.45 | 0.29 | 4.5 | 1.020.13 | 4.230.29 | 1.05 | 23167 | 0.97 (101) | 56 | 4.34 | 0.96 (102) |
| 2068 | 163.69 | 33.58 | 3.5 | 0.5910.06 | 15.60.6 | … | … | … | 37 | 9.62 | 1.5 (108) |
| … | … | … | … | … | -2.45 | … | … | 44 | … | 1.27 (106) | |
| 6671 | 191.36 | 44.93 | 8.2 | 0.2560.091 | 6.70.3 | … | … | … | 62 | 1.87 | 0.92 (105) |
| … | … | … | … | … | -1.6 | … | … | 71 | … | 0.88 (103) | |
| 6668 | 224.91 | 24.01 | 4.5 | 0.1160.006 | 39.10.6 | … | … | … | 41 | 7.24 | 1.3 (108) |
| … | … | … | … | … | -1.92 | … | … | 47 | … | 1.1 (106) |
3.1 Counterparts
If the emitting surface of the 3 short GRB candidates is similar to that of the SGR 1806–20 and their luminosity scales as , as expected in a baryon free fireball model, it is possible to infer their luminosities: erg/sec, erg/sec and erg/sec. These luminosities allow us to compute the putative distance to these GRBs, given the 50–300 keV flux as derived from the best fit of the spectra. This can be slightly different than the peak flux reported in the BATSE catalogue which is calculated with a low resolution spectrum (4 energy channel data) via direct inversion techniques (e.g. Fishman et al. 1994). We find that the distance should be , where is the 50–300 keV integrated model flux. We find distances of 3.14 Mpc, 4.9 Mpc and 2.33 Mpc for trigger 7142, 4660 and 5529, respectively.
We have searched the NED database for galaxies within the error box333The error box was derived from the BATSE catalog error box assuming a circular shape and Gaussian statistics. of the 3 short GRB candidates. We also allowed for a larger error box with respect to the values reported in Tab. 1 by adding the systematic BATSE positional uncertainty of . In all cases but trigger 4660 we find more than one galaxy with within the error box. In no case, however, we find a galaxy within the distances derived above. Where a positive result would have been interesting, this negative result does not allow us to derive any constraint given the complex shape and statistics of the BATSE error areas and the fact that the SGRGF may originate from small low-surface galaxies, such as the Large Magellanic Cloud. Analogous conclusions can be derived for the three selected bursts with a BB+PL spectrum.
4 Discussion
We have analyzed the spectra of the 76 among the 115 brightest BATSE short GRBs, defined as GRBs with s and 50–300 keV peak flux phot cm-2 s-1. We searched for black body spectra (possibly with high temperature keV) to identify candidate extragalactic SGRGFs. We find 3 candidate black body spectra, albeit with lower temperature. If we assume that the luminosity scales as , such events should be at a distance of 2–5 Mpc. Their multi–peaked light curves and durations longer than 1 second argue against their identification as SGRGFs. We therefore conclude that we could not find any robust evidence of the presence of SGRGFs in our sample of short BATSE GRBs. The expected number of SGRGFs can be computed from Eq. 1 rescaling the threshold from to photons cm-2 s-1. For the 9.5 years of BATSE activity we find:
| (2) |
The probability of finding no event out of an expected number of 12.6 is given by Poisson statistics and corresponds to or . Alternatively we can give an upper limit at the level. Several factors can contribute to this mismatch.
The extragalactic SGRGF rate depends on the distance to SGR 1806–20 to the third power (Eq. 1; Hurley et al. 2005; Nakar et al. 2005). A distance of 9 kpc would be consistent with both our non detection and with the radio absorption measurements (Cameron et al. 2005; McClure–Griffiths & Gaensler 2005). It would place the SGR outside the massive star cluster with which is associated in projection. Such smaller distance would decrease the SGR 1806-20 flare luminosity by a factor . BATSE trigger criteria underwent many changes during the BATSE activity and we have adopted an average effective value. This, however seem not enough to explain such a big discrepancy (our estimated rate is conservative). The rate of Galactic SGRGFs may be smaller than estimated. If yr, the failed detection of extragalactic flares would be marginally acceptable. We should then conclude that we happened by chance to live in a period when a Galactic SGRGF went off. A final possibility is that the SGRGF spectrum is not purely black body. We find several spectra that can be modelled with a black body component plus a power–law. Three of them satisfy also constraints on the light curve duration and variability. If a sizable non thermal emission contributes to the SGRGF emission at low and high frequencies, these short GRBs may be good candidates for an association. The discrepacy would not however be solved since we find only 3 events out of the expected 13.
The solid conclusion of our analysis, similar to what independently derived by Popov and Stern (2005) with positional association techniques, is that the rate of erg s-1 giant flares is smaller than one every years444Their constrain is somewhat tighter, but note that due to the complex shape and non Gaussian statistics of BATSE error boxes, their analysis may be heavily affected by systematic uncertainties.. It is not clear whether there is any such luminous giant flare in the BATSE sample. If we ask instead what is the rate of giant flares similar to the SGR 1806–20 one, we face the uncertainty on its luminosity, a consequence of our ignorance of its exact distance. For a distance of 9 kpc, the peak luminosity of SGR 1806–20 would be erg s-1, and the rate of BATSE detectable flares be as low as 3 in the whole BATSE activity for our countrate threshold, marginally consistent with our result.
It is finally worth discussing some effects that could add small uncertainty to our estimates. We checked that, with the adopted threshold, there is no bias against short events in the spectral analysis. Some residuals non statistically significant effects may still be present but should be marginal. On the other hand, the effects of scattering of burst photons in the detector and atmosphere are included in the response matrices (Preece et al. 2000), that are computed case by case. The spectral shape should be therefore unaffected by instrumental effects. We finally note that the spectra are mostly constrained in the intermediate energy range, so that any calibration uncertainty at the edge of the detector sensitivity will not affect our results.
Acknowledgements
We would like to thank our referee, Kevin Hurley, for the very constructive comments and suggestions. We would like to thank Robert Duncan and Ehud Nakar for useful discussions and comments. This research has made use of the data obtained through the High Energy Astrophysics Science Archive Research Center Online Service, provided by the NASA/Goddard Space Flight Center. This work was supported in part by NSF grant AST-0307502 and NASA Astrophysical Theory Grant NAG5-12035 (DL). GG & GG thanks the Italian MIUR for COFIN-Grant.
References
- [1] Borkowski J., Gotz D., Mereghetti S., Mowlavi N., shaw S., Turler M., 2005, GCN Report n. 2920
- [2] Cameron P. B. et al. 2005, Nature in press (astro-ph/0502428)
- [3] Corbel S., Wallyn P., Dame T. M., Durouchoux P., Mahoney W. A., Vilhu O., Grindlay J. E., 1997, ApJ, 478, 624
- [4] Corbel S., Eikenberry S. S., 2004, A&A, 419, 191
- [5] Duncan R. C., 2001, in Proceedings of the XX Texas Symposium on Relativistic Astrophysics, Edited by Wheeler J. C., Martel H., AIP conference proceedings, 586, 495
- [6] Eichler D., 2002, MNRAS, 335, 883
- [7] Figer D. F., Najarro F., Geballe T. R., Blum R. D., Kudritzki R. P., 2005, ApJ, 622, L49
- [8] Fishman G. J. et al., 1994, ApJS, 92,229
- [9] Ghirlanda G., Celotti A., Ghisellini G., 2002, A&A, 393, 409
- [10] Ghirlanda G., Celotti A., Ghisellini G., 2003, A&A, 406, 879
- [11] Ghirlanda G., Ghisellini G., Celotti A., 2004, A&A, 422, L55
- [12] Ghirlanda G. et al. 2005, in prep.
- [13] Gaensler B. M. et al. 2005, Nature in press (astro-ph/0502393)
- [14] Hurley K. et al., 1999, Nature, 397, 41
- [15] Hurley K. et al., 2002, ApJ, 567, 447
- [16] Hurley K. et al., 2005, Nature in press (astro-ph/0502329)
- [17] Mazets E. et al. 1979, Nature, 282, 587
- [18] Magliocchetti M., Ghirlanda G., Celotti A., 2003, MNRAS, 343, 255
- [19] McClure-Griffiths N. M., Gaensler B. M., 2005, ApJ submitted (astro-ph/0503171)
- [20] Mereghetti S., Gotz D., Von Kienlin A., Rau A, Lichti G., Weidenspointner G, Jean P. 2005, ApJ submitted (astro-ph/0502577)
- [21] Mereghetti S., Stella L., 1995, ApJ, 442, L17
- [22] Nakar E., Gal-Yam A., Piran T., Fox D. B., 2005, ApJ submitted (astro-ph/0502148)
- [23] Palmer D. M. et al., 2005, Nature in press (astro-ph/0503030)
- [24] Popov S. B., Stern B. E., 2005, MNRAS submitted (astro-ph/0503532)
- [25] Preece R. D., Briggs M. S., Mallozzi R. S., Pendleton G. N., Paciesas W. S., Band D. L., 2000, ApJS, 126, 19
- [26] Ryde F., 2004, ApJ, 614, 817
- [27] Schwartz S. J. et al., 2005, Nature submitted (astro-ph/0504056)
- [28] Terasawa T. et al., 2005, Nature in press (astro-ph/0502315)
- [29] Thompson C., Duncan R. C., 1995, MNRAS, 275, 255
- [30] Thompson C., Duncan R. C., 1996, ApJ, 473, 322