11email: tofu,dll@astro.as.utexas.edu 22institutetext: Department of Physics and Astronomy, University of North Carolina, NC 27599, USA 33institutetext: Institute of Physics and Astronomy, University of Aarhus, 8000 Aarhus C, Denmark
33email: fgj,pen,hrj@phys.au.dk
Abundances in giant stars of the globular cluster NGC 6752††thanks: Based on observations obtained with the ESO Very Large Telescope UVES spectrograph for programmes 67.D-0145 and 65.L-0165(A)
Recent theoretical yields and chemical evolution models demonstrate that intermediate-mass AGB stars cannot reproduce the observed abundance distributions of O, Na, Mg, and Al. As a further observational test of this finding, we present elemental abundance ratios [X/Fe] for 20 elements in 38 bright giants of the globular cluster NGC 6752 based on high-resolution, high signal-to-noise spectra obtained with UVES on the VLT. This is the most complete spectroscopic analysis of this cluster in terms of the number of elements considered and the number of stars in the sample. The stars span more than 1000K in effective temperature and more than 3 visual magnitudes along the red giant branch. None of the abundance ratios [X/Fe] show a correlation with evolutionary status. For Si and heavier elements, the small scatter in [X/Fe] may be attributable to the measurement uncertainties. Our mean abundance ratios [X/Fe] are in good agreement with previous studies of this cluster and are also consistent with other globular clusters and field stars at the same metallicity. The mean abundance ratios [Ba/Eu] and [La/Eu] exhibit values, in agreement with field stars at the same metallicity, that lie approximately midway between the pure -process and the solar (-process + -process) mix, indicating that AGB stars have played a role in the chemical evolution of the proto-cluster gas.
For the first time, we find possible evidence for an abundance variation for elements heavier than Al in this cluster. We find a correlation between [Si/Fe] and [Al/Fe] which is consistent with the abundance anomalies being synthesized via proton captures at high temperatures. Leakage from the Mg-Al chain into 28Si may explain the Si excess in stars with the highest [Al/Fe]. We identify correlations between [Y/Fe] and [Al/Fe], [Zr/Fe] and [Al/Fe], and [Ba/Fe] and [Al/Fe] suggesting that Y, Zr, and Ba abundances may increase by about 0.1 dex as Al increases by about 1.3 dex. While the correlations are statistically significant, the amplitudes of the variations are small. If the small variations in Y, Zr, and Ba are indeed real, then the synthesis of the Al anomalies must have taken place within an unknown class of stars that also ran the -process.
Key Words.:
globular clusters: general, globular clusters: individual (NGC 6752), stars: abundances, stars: evolution, stars: fundamental parameters1 Introduction
Galactic globular clusters have provided excellent opportunities to refine our understanding of stellar structure, stellar evolution, the formation of the Milky Way, and the age of the universe. While globular clusters constitute only 2% of the mass of the halo (Freeman & Bland-Hawthorn 2002), they are important targets to study because they are the oldest Galactic objects for which reliable ages have been obtained (Vandenberg, Stetson, & Bolte 1996;Gratton et al. 2003). Peebles & Dicke (1968) suggested that globular clusters were the first bound systems to have formed in the protogalactic era and recently West et al. (2004) suggested that by studying extragalactic globular clusters, the formation history of galaxies can be reconstructed. However, it is important to recognize that our understanding of the origin and evolution of the closest Galactic globular clusters is far from complete. Specifically, there is still no satisfactory explanation for the star-to-star abundance variations of light elements that is found in every well observed cluster.
Spectroscopic observations allow us to measure the chemical compositions of individual cluster stars which can provide clues to the formation and evolution of globular clusters (e.g., see review by Gratton, Sneden, & Carretta 2004). Helfer, Wallerstein, & Greenstein (1959) presented the first comprehensive abundance analysis of globular cluster stars. The first systematic study of composition differences between various globular clusters was carried out by Cohen (1978, 1979, 1980, 1981). Popper (1947) first discovered a CN strong giant in M 13 and variations of CN were later seen among giants in M 5 and M 10 by Osborn (1971). Since the identification of large Na variations in giants of M 13 by Peterson (1980), many spectroscopic analyses of individual cluster stars have focused upon the origin of the star-to-star abundance variations of light elements (e.g., Kraft 1994; Kraft et al. 1997; Sneden et al. 1997, 2004b). These variations consist of differences in and correlations between the abundances of the light elements C, N, O, Na, Mg, and Al seen in every well studied Galactic globular cluster. Although the amplitude of the abundance variation may differ from cluster to cluster, there is a common pattern: the abundances of C and O are low when N is high and O and Na are anticorrelated as are Mg and Al.
Most abundance analyses using high resolution spectra of cluster stars have been performed upon giants. The advent of 8m class telescopes with efficient high resolution echelle spectrographs has allowed observers to reach down to main sequence turn-off stars and early subgiants in the brightest clusters. While star-to-star abundance variations of C and N were known to exist in main sequence stars of the globular cluster 47 Tuc (Hesser 1978; Hesser & Bell 1980; Bell, Hesser, & Cannon 1983), these variations have now been found in other clusters (e.g., Cannon et al. 1998; Cohen 1999; Briley, Cohen, & Stetson 2002; Cohen, Briley, & Stetson 2002). Recently, variations of O, Na, Mg, and Al have been observed in main sequence stars (Gratton et al. 2001; Ramírez & Cohen 2003; Cohen & Meléndez 2005).
The two explanations for the abundance variations, the evolutionary and primordial scenarios, agree that the most likely mechanisms responsible for altering the light element abundance ratios are proton-capture reactions (CNO-cycle, Ne-Na chain, and Mg-Al chain). In the evolutionary scenario, the abundance variations are due to internal nucleosynthesis and mixing within the observed stars. To effect changes to surface abundances of elements participating in the Ne-Na and Mg-Al chains requires extremely deep and extensive mixing to very hot layers. This may just be conceivable for red giants but is definitely excluded as a possibility for main sequence stars. In the primordial scenario, the present stars either formed from gas of an inhomogeneous composition with the O and related anomalies present in pockets contaminated by ejecta from H-burning layers of asymptotic giant branch (AGB) or other stars or accreted such ejecta after formation.
The abundance ratios of heavy elements in cluster stars has attracted less attention. Yet these elements may also offer much insight into the nucleosynthetic history of globular clusters (Sneden et al. 2004a). Self-consistent analyses measuring a large number of elements in numerous stars within a given cluster (Ivans et al. 1999, 2001; Ramírez & Cohen 2002, 2003; Cohen 2004; Cohen & Meléndez 2005) are vital for our understanding of globular cluster chemical evolution. Here, we present an analysis of heavy elements in the cluster NGC 6752 which along with M 13 exhibits the largest spread in the light element abundances. Previous analyses of this cluster include Da Costa & Cottrell (1980), Cottrell & Da Costa (1981), Norris et al. (1981), Suntzeff & Smith (1991), Norris & Da Costa (1995), Minniti et al. (1996), Gratton et al. (2001), Grundahl et al. (2002), Yong et al. (2003), James et al. (2004a), Cavallo, Suntzeff, & Pilachowski (2004), James et al. (2004b), and Carretta et al. (2004) where each study focused upon a handful of abundance ratios and/or a small number of stars. In this paper, we present abundance ratios for 20 elements in 38 bright giants of NGC 6752. We explore the homogeneity of the heavy element abundances as well as compare the abundances of various iron-peak, neutron-capture, and alpha elements with field stars and other globular clusters. Such measurements will provide a more detailed insight into the chemical evolution of this globular cluster.
2 Target selection, observations, and reduction
The targets for this study were drawn from the photometry of Grundahl et al. (1999). The sample consists of 17 stars near the tip of the red giant branch (RGB) and 21 stars near the bump of the RGB. The observations were carried out in service mode with the UVES instrument (D’Odorico et al. 2000) on the ESO VLT UT2 telescope. The stars near the RGB tip were observed at a resolving power R=110,000 with signal-to-noise ratios (S/N) ranging from 250 per pixel in the cooler and brighter stars to 150 per pixel in the warmer and fainter stars. The stars near the RGB bump were observed with a resolving power R=60,000 with S/N=100 per pixel. For the RGB bump stars, the abundances of O, Na, Mg, and Al were presented in Grundahl et al. (2002) and for the RGB tip stars, the abundances of O, Na, Mg, and Al and Mg isotope ratios were presented in Yong et al. (2003). For a complete description of the target selection, observations, and data reduction see Grundahl et al. (2002) and Yong et al. (2003).
Derivation of the stellar parameters was also described in Grundahl et al. (2002) and Yong et al. (2003). Briefly, were derived from the Grundahl et al. (1999) photometry using the Alonso, Arribas, & Martínez-Roger (1999) :[Fe/H]:color relations based on the infrared flux method. Surface gravities were estimated using the stellar luminosities and derived . To estimate the luminosity we assumed a stellar mass of 0.84 , an apparent distance modulus of , a reddening E (Harris 1996), and bolometric corrections were taken from a 14 Gyr isochrone with [Fe/H]=1.54 from VandenBerg et al. (2000). The microturbulence was derived in the usual way by requiring that the abundances from Fe i lines be independent of the measured equivalent width. The stellar parameters for the program stars are presented in Table 1.
| Name1 | Name2 | RA | Dec | V | log g | [Fe/H] | ||
|---|---|---|---|---|---|---|---|---|
| (2000) | (2000) | (K) | (cm s-2) | (km s-1) | ||||
| PD1 | NGC6752-mg0 | 19:10:58 | 59:58:07 | 10.70 | 3928 | 0.26 | 2.70 | 1.62 |
| B1630 | NGC6752-mg1 | 19:11:11 | 59:59:51 | 10.73 | 3900 | 0.24 | 2.70 | 1.60 |
| B3589 | NGC6752-mg2 | 19:10:32 | 59:57:01 | 10.94 | 3894 | 0.33 | 2.50 | 1.59 |
| B1416 | NGC6752-mg3 | 19:11:17 | 60:03:10 | 10.99 | 4050 | 0.50 | 2.20 | 1.60 |
| … | NGC6752-mg4 | 19:10:43 | 59:59:54 | 11.02 | 4065 | 0.53 | 2.20 | 1.60 |
| PD2 | NGC6752-mg5 | 19:10:49 | 59:59:34 | 11.03 | 4100 | 0.56 | 2.10 | 1.59 |
| B2113 | NGC6752-mg6 | 19:11:03 | 60:01:43 | 11.22 | 4154 | 0.68 | 2.10 | 1.59 |
| … | NGC6752-mg8 | 19:10:38 | 60:04:10 | 11.47 | 4250 | 0.80 | 2.00 | 1.68 |
| B3169 | NGC6752-mg9 | 19:10:40 | 59:58:14 | 11.52 | 4288 | 0.91 | 1.90 | 1.63 |
| B2575 | NGC6752-mg10 | 19:10:54 | 59:57:14 | 11.54 | 4264 | 0.90 | 1.80 | 1.63 |
| … | NGC6752-mg12 | 19:10:58 | 59:57:04 | 11.59 | 4286 | 0.94 | 1.80 | 1.62 |
| B2196 | NGC6752-mg15 | 19:11:01 | 59:57:18 | 11.68 | 4354 | 1.02 | 1.90 | 1.60 |
| B1518 | NGC6752-mg18 | 19:11:15 | 60:00:29 | 11.83 | 4398 | 1.11 | 1.80 | 1.60 |
| B3805 | NGC6752-mg21 | 19:10:28 | 59:59:49 | 11.99 | 4429 | 1.20 | 1.80 | 1.60 |
| B2580 | NGC6752-mg22 | 19:10:54 | 60:02:05 | 11.99 | 4436 | 1.20 | 1.80 | 1.61 |
| B1285 | NGC6752-mg24 | 19:11:19 | 60:00:31 | 12.15 | 4511 | 1.31 | 1.90 | 1.63 |
| B2892 | NGC6752-mg25 | 19:10:46 | 59:56:22 | 12.23 | 4489 | 1.33 | 1.70 | 1.60 |
| … | NGC6752-0 | 19:11:03 | 59:59:32 | 13.03 | 4699 | 1.83 | 1.47 | 1.62 |
| B2882 | NGC6752-1 | 19:10:47 | 60:00:43 | 13.27 | 4749 | 1.95 | 1.41 | 1.58 |
| B1635 | NGC6752-2 | 19:11:11 | 60:00:17 | 13.30 | 4779 | 1.98 | 1.39 | 1.59 |
| B2271 | NGC6752-3 | 19:11:00 | 59:56:40 | 13.41 | 4796 | 2.03 | 1.42 | 1.64 |
| B611 | NGC6752-4 | 19:11:33 | 60:00:02 | 13.42 | 4806 | 2.04 | 1.40 | 1.61 |
| B3490 | NGC6752-6 | 19:10:34 | 59:59:55 | 13.47 | 4804 | 2.06 | 1.40 | 1.61 |
| B2438 | NGC6752-7 | 19:10:57 | 60:00:41 | 13.53 | 4829 | 2.10 | 1.33 | 1.84 |
| B3103 | NGC6752-8 | 19:10:45 | 59:58:18 | 13.56 | 4910 | 2.15 | 1.33 | 1.62 |
| B3880 | NGC6752-9 | 19:10:26 | 59:59:05 | 13.57 | 4824 | 2.11 | 1.38 | 1.63 |
| B1330 | NGC6752-10 | 19:11:18 | 59:59:42 | 13.60 | 4836 | 2.13 | 1.37 | 1.60 |
| B2728 | NGC6752-11 | 19:10:50 | 60:02:25 | 13.62 | 4829 | 2.13 | 1.32 | 1.64 |
| B4216 | NGC6752-12 | 19:10:20 | 60:00:30 | 13.64 | 4841 | 2.15 | 1.34 | 1.62 |
| B2782 | NGC6752-15 | 19:10:49 | 60:01:55 | 13.73 | 4850 | 2.19 | 1.35 | 1.61 |
| B4446 | NGC6752-16 | 19:10:15 | 59:59:14 | 13.78 | 4906 | 2.24 | 1.32 | 1.60 |
| B1113 | NGC6752-19 | 19:11:23 | 59:59:40 | 13.96 | 4928 | 2.32 | 1.29 | 1.61 |
| … | NGC6752-20 | 19:10:36 | 59:56:08 | 13.98 | 4929 | 2.33 | 1.32 | 1.59 |
| … | NGC6752-21 | 19:11:13 | 60:02:30 | 14.02 | 4904 | 2.33 | 1.29 | 1.61 |
| B1668 | NGC6752-23 | 19:11:12 | 59:58:29 | 14.06 | 4916 | 2.35 | 1.27 | 1.62 |
| … | NGC6752-24 | 19:10:44 | 59:59:41 | 14.06 | 4948 | 2.37 | 1.15 | 1.65 |
| … | NGC6752-29 | 19:10:17 | 60:01:00 | 14.18 | 4950 | 2.42 | 1.26 | 1.64 |
| … | NGC6752-30 | 19:10:39 | 59:59:47 | 14.19 | 4943 | 2.42 | 1.27 | 1.62 |
For each star, we started by measuring the abundance of Fe. For the adopted model parameters, a stellar atmosphere was taken from the Kurucz (1993) local thermodynamic equilibrium (LTE) stellar atmosphere grid. We interpolated within the grid when necessary to obtain a model with the required , log , and [Fe/H]. The model was used with the LTE stellar line analysis program Moog (Sneden 1973). The equivalent width (EW) of a line was measured using routines in IRAF111IRAF is distributed by the National Optical Astronomy Observatories, which are operated by the Association of Universities for Research in Astronomy, Inc., under cooperative agreement with the National Science Foundation. where in general a Gaussian profile was fitted to an observed profile. Assuming a solar metallicity of (Fe) = 7.50, we obtain [Fe/H] = for NGC 6752 after excluding the star NGC6752-7 (B2438) due to its discrepant iron abundance. (This outlier is most likely the result of a photometric blend which affected the temperature and gravity estimates. In a versus diagram (Figure 1 in Yong et al. 2003, it lies to the blue of the RGB.) Despite the stars spanning a large range on the RGB (10.7 V 14.2, 3900 (K) 4900, 0.3 log 2.4), we find that the iron abundance is constant from star-to-star. (The values for Fe i and Fe ii were presented in Yong et al. (2003) from which we derived (Fe)⊙ = 7.50 using a Kurucz model.)
Previous measurements of the Fe abundance include [Fe/H]=1.54 (Zinn & West 1984), 1.58 (Minniti et al. 1993), 1.52 (Norris & Da Costa 1995), 1.42 (Carretta & Gratton 1997), 1.42 (Gratton et al. 2001), and 1.62 (Grundahl et al. 2002). Kraft & Ivans (2003) found [Fe/H] and [Fe/H] using Kurucz models and [Fe/H] and [Fe/H] using MARCS models. Recently, James et al. (2004a) measured [Fe/H]= and Cavallo et al. (2004) derived [Fe/H]=. The various studies employed a different set of lines and values in their analysis of giants or unevolved stars. While our Fe abundance is slightly lower than other investigators, we conclude that all studies are in reasonable agreement within the uncertainties in the stellar parameters.
An alternative method to derive is by insisting that the abundance from Fe lines be independent of the lower excitation potential, that is, excitation equilibrium. We note that our adopted based on photometry satisfies excitation equilibrium. To derive the surface gravity, an alternative method is to force the abundance from neutral Fe lines to equal the abundance from singly ionized Fe lines, that is, ionization equilibrium. For our adopted surface gravities, we note that ionization equilibrium is satisfied for all but the three coolest stars. In these coolest stars, the abundance from Fe i lines was in agreement with warmer stars. However, the abundance from Fe ii lines appeared to increase slightly in these coolest stars where the maximum discrepancy was Fe ii Fe i = 0.2 dex in the coolest star. We suggested that a mild revision of the temperature scale would ensure that all stars gave the same Fe abundance from neutral and ionized lines (Yong et al. 2003). This would be achieved by a temperature correction running from an increase of by 100K at 3900K and vanishing at about 4200K.
3 Elemental abundances
Using the derived stellar parameters, we determined the elemental abundances by measuring the equivalent widths of atomic lines again using routines in IRAF. Abundances were measured for O, Na, Mg, Al, Si, Ca, Sc, Ti, V, Mn, Co, Ni, Cu, Y, Zr, Ba, La, Ce, Nd, and Eu. In general, Gaussian profiles were fitted to the observed profiles. For strong lines (EWs80mÅ) and lines known to be affected by hyperfine and isotopic splitting, direct integration was used to measure the EWs. The elemental abundance analysis was conducted using Moog. We used the Van der Waals line damping parameter (Unsöld approximation multiplied by a factor recommended by the Blackwell group). The line lists were compiled from Kurucz & Bell (1995), Ivans et al. (2001), Ramírez & Cohen (2002), and Reddy et al. (2003) and are presented in Table 2. Lines of O, Na, Mg, Al, and Fe were presented in Yong et al. (2003). For the lines of Sc, V, Mn, Co, and Ba which are affected by hyperfine and/or isotopic splitting, we employed line lists from Prochaska et al. (2000). For lines of Cu and Eu which are affected by hyperfine and isotopic splitting, we used line lists from Simmerer et al. (2003) and Lawler et al. (2001b) and assumed a solar isotope ratio. For La and Nd, we made use of the updated transition probabilities measured by Lawler et al. (2001a) and Den Hartog et al. (2003). For each of the program stars, the elemental abundance ratios [X/Fe] are presented in Tables 3 and 4. For a particular element in a given star, the abundances derived from different lines are in very good agreement (in general, dex). The adopted Fe abundance was the mean of all Fe lines. Recall that the Fe abundance from neutral and singly ionized lines agree for all but the three coolest stars. Therefore, our abundance ratios are not affected by our choice of Fe abundance such that [X/Fe i] [X/Fe ii] [X/Fe]. In Figures 1 to 5, we plot the abundance ratios [X/Fe] versus . The warmest stars show a larger dispersion in [X/Fe] than the coolest stars. This is most evident for V, Ce, and Eu. We suspect that the increased spread is due to the lower quality of the data and the weakness of the lines. In these warmer and fainter stars, lines of V, Ce, and Eu have EWs 12mÅ and the S/N is lower than for the bright RGB tip stars. We suggest that the increased dispersion in the abundances of fainter stars is not a real feature.
In Table 5, we present the abundance dependences on the model parameters. Our adopted errors are 30, log 0.1, and 0.1. Note that these are internal errors and underestimate the absolute errors. For , we estimated the internal error in the following way. A polynomial fit was made to the RGB in the versus plane. The formal scatter around the relation was 0.009mag in corresponding to an error of about 30K. For the surface gravity, we assumed the basic cluster parameters for the stars, i.e., reddening, distance, etc. Therefore, internal errors in log are due to the 0.01mag uncertainties in the magnitudes. This translates into errors of the order 0.01. However, we adopted an uncertainty of 0.1 in log since this was the minimum value that would produce non-zero changes in [X/Fe] for all elements. For the microturbulence, we plotted versus log and fitted a straight line to the data. The scatter around the line was 0.1 km s-1.
Within the abundance uncertainties, none of the elemental abundance ratios show a strong dependence upon , where we take as a surrogate for evolutionary status. Note that our sample spans more than 1000K in and more than 3 magnitudes in V along the RGB including stars below the RGB bump.
| Species | Wavelength (Å) | EP (eV) | log | Ref.a |
|---|---|---|---|---|
| Si i | 5645.61 | 4.93 | 2.14 | RC02 |
| Si i | 5665.55 | 4.92 | 2.04 | RC02 |
| Si i | 5690.43 | 4.93 | 1.87 | RC02 |
| Si i | 5701.11 | 4.93 | 2.05 | RC02 |
| Si i | 5948.55 | 5.08 | 1.23 | RC02 |
| Si i | 6142.49 | 5.62 | 1.48 | IK01 |
| Si i | 6145.02 | 5.61 | 1.44 | RC02 |
| Si i | 6155.13 | 5.62 | 0.76 | RC02 |
| Si i | 6243.82 | 5.61 | 1.27 | IK01 |
| Si i | 6244.48 | 5.61 | 1.27 | IK01 |
| Si i | 6721.84 | 5.86 | 0.94 | RC02 |
| Ca i | 5260.39 | 2.52 | 1.72 | LUCK |
| Ca i | 5261.71 | 2.52 | 0.58 | LUCK |
| Ca i | 5512.99 | 2.93 | 0.45 | LUCK |
| Ca i | 5581.98 | 2.52 | 0.56 | LUCK |
| Ca i | 5588.76 | 2.52 | 0.36 | LUCK |
| Ca i | 5590.13 | 2.52 | 0.57 | LUCK |
| Ca i | 5601.29 | 2.52 | 0.52 | LUCK |
| Ca i | 5857.46 | 2.93 | 0.23 | RC02 |
| Ca i | 6102.73 | 1.88 | 0.79 | LUCK |
| Ca i | 6122.23 | 1.89 | 0.32 | LUCK |
| Ca i | 6161.29 | 2.52 | 1.27 | IK01 |
| Ca i | 6162.18 | 1.90 | 0.09 | RC02 |
| Ca i | 6166.44 | 2.52 | 1.14 | R03 |
| Ca i | 6169.04 | 2.52 | 0.80 | R03 |
| Ca i | 6169.56 | 2.52 | 0.48 | IK01 |
| Ca i | 6439.08 | 2.52 | 0.39 | LUCK |
| Ca i | 6455.60 | 2.52 | 1.29 | IK01 |
| Ca i | 6471.67 | 2.52 | 0.69 | IK01 |
| Ca i | 6493.79 | 2.52 | 0.11 | LUCK |
| Ca i | 6499.65 | 2.52 | 0.82 | IK01 |
| Sc ii | 5526.82 | 1.77 | 0.13 | PN00 |
| Sc ii | 5657.88 | 1.51 | 0.50 | PN00 |
| Sc ii | 5667.15 | 1.50 | 1.24 | PN00 |
| Sc ii | 5669.04 | 1.50 | 1.12 | PN00 |
| Sc ii | 6245.61 | 1.51 | 0.98 | PN00 |
| Sc ii | 6604.60 | 1.36 | 1.48 | PN00 |
| Ti i | 5173.75 | 0.00 | 1.12 | KB95 |
| Ti i | 5192.98 | 0.02 | 1.01 | KB95 |
| Ti i | 5210.39 | 0.05 | 0.88 | KB95 |
| Ti i | 5648.57 | 2.49 | 0.25 | RC02 |
| Ti i | 5662.16 | 2.32 | 0.11 | RC02 |
| Ti i | 5679.94 | 2.47 | 0.58 | RC02 |
| Ti i | 5689.49 | 2.30 | 0.47 | RC02 |
| Ti i | 5702.69 | 2.29 | 0.57 | RC02 |
| Ti i | 5713.92 | 2.29 | 0.84 | RC02 |
| Ti i | 5716.46 | 2.30 | 0.70 | RC02 |
| Ti i | 5720.48 | 2.29 | 0.90 | RC02 |
| Ti i | 5739.46 | 2.25 | 0.60 | RC02 |
| Ti i | 5739.98 | 2.24 | 0.67 | RC02 |
| Ti i | 5766.33 | 3.29 | 0.36 | RC02 |
| Ti i | 5866.46 | 1.07 | 0.84 | RC02 |
| Ti i | 5880.27 | 1.05 | 2.05 | RC02 |
| Species | Wavelength (Å) | EP (eV) | log | Ref.a |
|---|---|---|---|---|
| Ti i | 5903.32 | 1.07 | 2.14 | RC02 |
| Ti i | 5922.11 | 1.05 | 1.47 | IK01 |
| Ti i | 5937.81 | 1.07 | 1.89 | RC02 |
| Ti i | 5941.75 | 1.05 | 1.52 | RC02 |
| Ti i | 5953.16 | 1.89 | 0.33 | RC02 |
| Ti i | 5965.83 | 1.88 | 0.41 | IK01 |
| Ti i | 5978.54 | 1.87 | 0.50 | IK01 |
| Ti i | 5999.68 | 2.17 | 0.73 | RC02 |
| Ti i | 6091.17 | 2.27 | 0.42 | RC02 |
| Ti i | 6092.80 | 1.89 | 1.38 | RC02 |
| Ti i | 6126.22 | 1.07 | 1.42 | IK01 |
| Ti i | 6146.22 | 1.87 | 1.47 | RC02 |
| Ti i | 6186.15 | 2.17 | 1.15 | RC02 |
| Ti i | 6258.10 | 1.44 | 0.36 | RC02 |
| Ti i | 6258.71 | 1.46 | 0.24 | RC02 |
| Ti i | 6261.10 | 1.43 | 0.48 | RC02 |
| Ti i | 6303.76 | 1.44 | 1.57 | IK01 |
| Ti i | 6312.24 | 1.46 | 1.55 | IK01 |
| Ti i | 6497.69 | 1.44 | 1.93 | RC02 |
| Ti i | 6508.14 | 1.43 | 1.98 | RC02 |
| Ti i | 6554.22 | 1.44 | 1.22 | RC02 |
| Ti i | 6716.68 | 2.49 | 1.04 | RC02 |
| Ti i | 6743.12 | 0.90 | 1.63 | RC02 |
| Ti ii | 5154.08 | 1.57 | 1.92 | KB95 |
| Ti ii | 5185.91 | 1.89 | 1.35 | KB95 |
| Ti ii | 5336.79 | 1.58 | 1.69 | KB95 |
| Ti ii | 5381.03 | 1.59 | 2.08 | KB95 |
| V i | 5727.06 | 1.08 | 0.01 | R03 |
| V i | 6090.22 | 1.08 | 0.06 | R03 |
| V i | 6216.36 | 0.28 | 1.29 | PN00 |
| V i | 6251.82 | 0.29 | 1.34 | PN00 |
| V i | 6274.64 | 0.27 | 1.67 | PN00 |
| V i | 6504.16 | 1.18 | 1.23 | PN00 |
| Mn i | 5537.74 | 2.19 | 2.02 | PN00 |
| Mn i | 6013.53 | 3.07 | 0.25 | PN00 |
| Mn i | 6016.67 | 3.08 | 0.22 | PN00 |
| Mn i | 6021.80 | 3.07 | 0.03 | PN00 |
| Co i | 5342.71 | 4.02 | 0.54 | PN00 |
| Co i | 5352.05 | 3.58 | 0.06 | PN00 |
| Co i | 5530.79 | 1.71 | 2.06 | PN00 |
| Co i | 6455.03 | 3.63 | 0.25 | PN00 |
| Co i | 6632.45 | 2.28 | 2.00 | PN00 |
| Ni i | 5578.73 | 1.68 | 2.64 | KB95 |
| Ni i | 5682.20 | 4.10 | 0.47 | RC02 |
| Ni i | 5748.35 | 1.68 | 3.26 | RC02 |
| Ni i | 5892.88 | 1.99 | 2.34 | RC02 |
| Ni i | 6007.31 | 1.68 | 3.34 | RC02 |
| Ni i | 6086.28 | 4.26 | 0.52 | RC02 |
| Ni i | 6108.12 | 1.68 | 2.45 | KB95 |
| Ni i | 6175.37 | 4.09 | 0.53 | RC02 |
| Ni i | 6176.82 | 4.09 | 0.53 | RC02 |
| Species | Wavelength (Å) | EP (eV) | log | Ref.a |
|---|---|---|---|---|
| Ni i | 6177.25 | 1.83 | 3.50 | RC02 |
| Ni i | 6186.71 | 4.10 | 0.97 | RC02 |
| Ni i | 6204.60 | 4.09 | 1.14 | RC02 |
| Ni i | 6223.99 | 4.10 | 0.99 | IK01 |
| Ni i | 6322.17 | 4.15 | 1.17 | RC02 |
| Ni i | 6360.82 | 4.17 | 1.15 | RC02 |
| Ni i | 6370.35 | 3.54 | 1.94 | RC02 |
| Ni i | 6378.26 | 4.15 | 0.89 | RC02 |
| Ni i | 6598.60 | 4.23 | 0.98 | RC02 |
| Ni i | 6635.12 | 4.42 | 0.83 | RC02 |
| Ni i | 6643.64 | 1.68 | 2.30 | RC02 |
| Cu i | 5105.54 | 1.39 | 1.52 | SS03 |
| Y ii | 5123.22 | 0.99 | 0.83 | PN00 |
| Y ii | 5200.42 | 0.99 | 0.57 | PN00 |
| Y ii | 5509.91 | 0.99 | 1.01 | KB95 |
| Y ii | 5544.61 | 1.74 | 1.08 | RC02 |
| Zr i | 6127.44 | 0.15 | 1.06 | RC02 |
| Zr i | 6134.55 | 0.00 | 1.28 | RC02 |
| Zr i | 6143.20 | 0.07 | 1.10 | RC02 |
| Zr ii | 5112.27 | 1.67 | 0.59 | KB95 |
| Ba ii | 5853.64 | 0.60 | 1.01 | PN00 |
| Ba ii | 6141.73 | 0.70 | 0.08 | PN00 |
| Ba ii | 6496.91 | 0.60 | 0.38 | PN00 |
| La ii | 5303.53 | 0.32 | 1.35 | LB01 |
| La ii | 6390.49 | 0.30 | 1.41 | LB01 |
| Ce ii | 4943.45 | 1.20 | 0.11 | LUCK |
| Ce ii | 5274.24 | 1.04 | 0.32 | LUCK |
| Ce ii | 5472.30 | 1.24 | 0.18 | LUCK |
| Ce ii | 5512.06 | 1.00 | 0.29 | LUCK |
| Nd ii | 4959.12 | 0.06 | 0.80 | DL03 |
| Nd ii | 5092.79 | 0.38 | 0.61 | DL03 |
| Nd ii | 5212.36 | 0.20 | 0.96 | DL03 |
| Nd ii | 5234.19 | 0.55 | 0.51 | DL03 |
| Nd ii | 5249.58 | 0.98 | 0.20 | DL03 |
| Nd ii | 5255.51 | 0.20 | 0.67 | DL03 |
| Nd ii | 5293.16 | 0.82 | 0.10 | DL03 |
| Nd ii | 5319.81 | 0.55 | 0.14 | DL03 |
| Eu ii | 6645.13 | 1.37 | 0.20 | LW01 |
-
a
References for the values
-
DL03
– Den Hartog et al. (2003)
-
IK01
– Ivans et al. (2001)
-
KB95
– Kurucz & Bell (1995)
-
LW01
– Lawler et al. (2001b)
-
LB01
– Lawler et al. (2001a)
-
LUCK
– Luck (2003, private communication)
-
PN00
– Prochaska et al. (2000)
-
RC02
– Ramírez & Cohen (2002)
-
SS03
– Simmerer et al. (2003)
| Name1 | [O/Fe] | [Na/Fe] | [Mg/Fe] | [Al/Fe] | [Si/Fe] | [Ca/Fe] | [Sc/Fe] | [Ti/Fe] | [V/Fe] | [Mn/Fe] |
|---|---|---|---|---|---|---|---|---|---|---|
| NGC6752-mg0 | 0.17 | 0.67 | 0.48 | 1.08 | 0.38 | 0.17 | 0.01 | 0.13 | 0.32 | 0.43 |
| NGC6752-mg1 | 0.46 | 0.38 | 0.46 | 0.82 | 0.41 | 0.03 | 0.04 | 0.05 | 0.45 | 0.47 |
| NGC6752-mg2 | 0.55 | 0.19 | 0.47 | 0.77 | 0.43 | 0.09 | 0.01 | 0.09 | 0.43 | 0.47 |
| NGC6752-mg3 | 0.47 | 0.22 | 0.50 | 0.77 | 0.32 | 0.19 | 0.06 | 0.12 | 0.32 | 0.41 |
| NGC6752-mg4 | 0.38 | 0.29 | 0.47 | 0.90 | 0.34 | 0.18 | 0.01 | 0.12 | 0.33 | 0.41 |
| NGC6752-mg5 | 0.42 | 0.32 | 0.51 | 0.74 | 0.33 | 0.26 | 0.02 | 0.16 | 0.27 | 0.39 |
| NGC6752-mg6 | 0.60 | 0.13 | 0.54 | 0.57 | 0.34 | 0.28 | 0.18 | 0.18 | 0.24 | 0.38 |
| NGC6752-mg8 | 0.40 | 0.34 | 0.50 | 0.74 | 0.32 | 0.22 | 0.01 | 0.09 | 0.36 | 0.48 |
| NGC6752-mg9 | 0.47 | 0.28 | 0.51 | 0.77 | 0.31 | 0.29 | 0.05 | 0.18 | 0.18 | 0.39 |
| NGC6752-mg10 | 0.44 | 0.28 | 0.51 | 0.78 | 0.29 | 0.28 | 0.00 | 0.12 | 0.27 | 0.41 |
| NGC6752-mg12 | 0.66 | 0.09 | 0.48 | 0.09 | 0.27 | 0.30 | 0.04 | 0.12 | 0.26 | 0.42 |
| NGC6752-mg15 | 0.40 | 0.31 | 0.52 | 0.72 | 0.30 | 0.33 | 0.04 | 0.20 | 0.14 | 0.34 |
| NGC6752-mg18 | 0.46 | 0.19 | 0.49 | 0.59 | 0.31 | 0.36 | 0.07 | 0.20 | 0.19 | 0.36 |
| NGC6752-mg21 | 0.01 | 0.57 | 0.42 | 1.18 | 0.35 | 0.38 | 0.01 | 0.17 | 0.14 | 0.36 |
| NGC6752-mg22 | 0.19 | 0.63 | 0.49 | 0.99 | 0.35 | 0.37 | 0.05 | 0.17 | 0.15 | 0.42 |
| NGC6752-mg24 | 0.65 | 0.09 | 0.50 | 0.12 | 0.26 | 0.31 | 0.01 | 0.16 | 0.22 | 0.39 |
| NGC6752-mg25 | 0.59 | 0.14 | 0.53 | 0.51 | 0.33 | 0.38 | 0.04 | 0.19 | 0.14 | 0.39 |
| NGC6752-0 | 0.15 | 0.55 | 0.24 | 1.33 | 0.41 | 0.23 | 0.02 | 0.11 | 0.33 | 0.45 |
| NGC6752-1 | 0.57 | 0.08 | 0.52 | 0.32 | 0.35 | 0.23 | 0.14 | 0.13 | 0.27 | 0.44 |
| NGC6752-2 | 0.09 | 0.60 | 0.39 | 1.18 | 0.32 | 0.26 | 0.10 | 0.19 | 0.26 | 0.44 |
| NGC6752-3 | 0.70 | 0.04 | 0.52 | 0.22 | 0.31 | 0.21 | 0.03 | 0.17 | 0.29 | 0.55 |
| NGC6752-4 | 0.04 | 0.61 | 0.39 | 1.20 | 0.37 | 0.27 | 0.06 | 0.15 | 0.29 | 0.47 |
| NGC6752-6 | 0.09 | 0.54 | 0.46 | 0.96 | 0.27 | 0.25 | 0.06 | 0.12 | 0.19 | 0.50 |
| NGC6752-7 | 0.90 | 0.02 | 0.55 | 0.19 | 0.11 | 0.01 | 0.02 | 0.04 | 0.73 | 0.75 |
| NGC6752-8 | 0.66 | 0.01 | 0.54 | 0.48 | 0.30 | 0.23 | 0.07 | 0.14 | 0.47 | 0.56 |
| NGC6752-9 | 0.65 | 0.02 | 0.52 | 0.13 | 0.32 | 0.21 | 0.07 | 0.10 | 0.35 | 0.48 |
| NGC6752-10 | 0.02 | 0.65 | 0.43 | 1.06 | 0.36 | 0.24 | 0.04 | 0.16 | 0.35 | 0.45 |
| NGC6752-11 | 0.37 | 0.35 | 0.47 | 0.90 | 0.24 | 0.19 | 0.02 | 0.08 | 0.35 | 0.54 |
| NGC6752-12 | 0.29 | 0.27 | 0.50 | 0.41 | 0.35 | 0.23 | 0.01 | 0.14 | 0.35 | 0.49 |
| NGC6752-15 | 0.65 | 0.10 | 0.51 | 0.58 | 0.36 | 0.22 | 0.05 | 0.11 | 0.19 | 0.39 |
| NGC6752-16 | 0.09 | 0.36 | 0.48 | 0.83 | 0.40 | 0.22 | 0.04 | 0.17 | 0.29 | 0.48 |
| NGC6752-19 | 0.29 | 0.22 | 0.48 | 0.59 | 0.29 | 0.21 | 0.04 | 0.13 | 0.60 | 0.52 |
| NGC6752-20 | 0.08 | 0.67 | 0.37 | 1.15 | 0.35 | 0.26 | 0.05 | 0.16 | 0.16 | 0.44 |
| NGC6752-21 | 0.49 | 0.29 | 0.46 | 0.63 | 0.31 | 0.23 | 0.00 | 0.15 | 0.22 | 0.51 |
| NGC6752-23 | 0.11 | 0.59 | 0.34 | 1.25 | 0.36 | 0.24 | 0.00 | 0.12 | 0.29 | 0.51 |
| NGC6752-24 | 0.56 | 0.01 | 0.49 | 0.36 | 0.20 | 0.18 | 0.02 | 0.08 | 0.33 | 0.53 |
| NGC6752-29 | 0.51 | 0.07 | 0.48 | 0.35 | 0.25 | 0.21 | 0.07 | 0.05 | 0.24 | 0.50 |
| NGC6752-30 | 0.61 | 0.15 | 0.49 | 0.56 | 0.32 | 0.28 | 0.04 | 0.16 | 0.17 | 0.45 |
| Name1 | [Co/Fe] | [Ni/Fe] | [Cu/Fe] | [Y/Fe] | [Zr/Fe] | [Ba/Fe] | [La/Fe] | [Ce/Fe] | [Nd/Fe] | [Eu/Fe] |
|---|---|---|---|---|---|---|---|---|---|---|
| NGC6752-mg0 | 0.02 | 0.10 | 0.61 | 0.07 | 0.23 | … | 0.07 | 0.20 | 0.24 | 0.32 |
| NGC6752-mg1 | 0.02 | 0.13 | 0.71 | 0.04 | 0.19 | … | 0.05 | 0.23 | 0.22 | 0.34 |
| NGC6752-mg2 | 0.00 | 0.12 | 0.66 | 0.10 | 0.20 | … | 0.08 | 0.25 | 0.26 | 0.35 |
| NGC6752-mg3 | 0.01 | 0.10 | 0.59 | 0.06 | 0.20 | 0.33 | 0.05 | 0.23 | 0.17 | 0.34 |
| NGC6752-mg4 | 0.00 | 0.11 | 0.61 | 0.06 | 0.19 | 0.35 | 0.07 | 0.24 | 0.29 | 0.35 |
| NGC6752-mg5 | 0.02 | 0.08 | 0.60 | 0.01 | 0.19 | 0.15 | 0.06 | 0.28 | 0.27 | 0.33 |
| NGC6752-mg6 | 0.04 | 0.07 | 0.53 | 0.07 | 0.27 | 0.23 | 0.09 | 0.30 | 0.13 | 0.36 |
| NGC6752-mg8 | 0.03 | 0.11 | 0.60 | 0.12 | 0.17 | 0.31 | 0.17 | 0.17 | 0.24 | 0.30 |
| NGC6752-mg9 | 0.01 | 0.07 | 0.55 | 0.05 | 0.22 | 0.13 | 0.10 | 0.25 | 0.24 | 0.30 |
| NGC6752-mg10 | 0.02 | 0.09 | 0.57 | 0.02 | 0.20 | 0.02 | 0.07 | 0.21 | 0.23 | 0.36 |
| NGC6752-mg12 | 0.01 | 0.09 | 0.55 | 0.05 | 0.17 | 0.03 | 0.10 | 0.23 | 0.24 | 0.34 |
| NGC6752-mg15 | 0.06 | 0.04 | 0.51 | 0.05 | 0.30 | 0.11 | 0.12 | 0.25 | 0.19 | 0.23 |
| NGC6752-mg18 | 0.06 | 0.03 | 0.53 | 0.04 | 0.26 | 0.08 | 0.12 | 0.29 | 0.12 | 0.36 |
| NGC6752-mg21 | 0.13 | 0.05 | 0.53 | 0.01 | 0.27 | 0.05 | 0.17 | 0.28 | 0.28 | 0.37 |
| NGC6752-mg22 | 0.03 | 0.02 | 0.53 | 0.00 | 0.31 | 0.01 | 0.16 | 0.25 | 0.21 | 0.31 |
| NGC6752-mg24 | 0.04 | 0.05 | 0.53 | 0.19 | 0.33 | 0.25 | 0.13 | 0.24 | 0.18 | 0.35 |
| NGC6752-mg25 | 0.06 | 0.03 | 0.55 | 0.03 | 0.37 | 0.03 | 0.16 | 0.30 | 0.20 | 0.36 |
| NGC6752-0 | 0.01 | 0.04 | 0.62 | 0.02 | 0.28 | 0.17 | … | 0.30 | 0.20 | 0.31 |
| NGC6752-1 | 0.04 | 0.01 | 0.60 | 0.02 | 0.08 | 0.12 | … | 0.33 | 0.18 | 0.33 |
| NGC6752-2 | 0.05 | 0.00 | 0.61 | 0.01 | 0.19 | 0.09 | … | 0.36 | 0.12 | 0.45 |
| NGC6752-3 | 0.18 | 0.01 | 0.66 | 0.11 | 0.05 | 0.14 | … | 0.32 | 0.17 | 0.33 |
| NGC6752-4 | 0.18 | 0.04 | 0.63 | 0.00 | 0.00 | 0.10 | … | 0.25 | 0.25 | 0.50 |
| NGC6752-6 | 0.10 | 0.07 | 0.64 | 0.02 | 0.23 | 0.00 | … | 0.34 | 0.24 | 0.35 |
| NGC6752-7 | 0.14 | 0.23 | 0.86 | 0.14 | 0.18 | 0.24 | … | 0.15 | 0.30 | 0.25 |
| NGC6752-8 | 0.02 | 0.02 | 0.68 | 0.04 | 0.20 | 0.10 | … | 0.39 | 0.25 | 0.46 |
| NGC6752-9 | 0.02 | 0.05 | 0.63 | 0.05 | 0.09 | 0.00 | … | 0.42 | 0.26 | 0.33 |
| NGC6752-10 | 0.14 | 0.02 | 0.61 | 0.02 | 0.17 | 0.08 | … | 0.27 | 0.26 | 0.35 |
| NGC6752-11 | 0.14 | 0.06 | 0.66 | 0.04 | 0.09 | 0.04 | … | 0.30 | 0.28 | 0.16 |
| NGC6752-12 | 0.14 | 0.01 | 0.64 | 0.11 | 0.08 | 0.00 | … | 0.19 | 0.25 | 0.31 |
| NGC6752-15 | 0.14 | 0.05 | 0.65 | 0.14 | 0.10 | 0.13 | … | 0.34 | 0.22 | 0.13 |
| NGC6752-16 | 0.02 | 0.04 | 0.56 | 0.03 | 0.22 | 0.05 | … | 0.23 | 0.23 | 0.10 |
| NGC6752-19 | 0.02 | 0.03 | 0.66 | 0.10 | 0.18 | 0.05 | … | 0.26 | 0.22 | 0.21 |
| NGC6752-20 | 0.02 | 0.01 | 0.59 | 0.02 | 0.21 | 0.05 | … | 0.36 | 0.25 | 0.23 |
| NGC6752-21 | 0.02 | 0.03 | 0.61 | 0.03 | 0.18 | 0.08 | … | 0.25 | 0.25 | 0.33 |
| NGC6752-23 | 0.02 | 0.01 | 0.65 | 0.01 | 0.17 | 0.01 | … | 0.19 | 0.25 | 0.17 |
| NGC6752-24 | 0.03 | 0.06 | 0.70 | 0.15 | 0.04 | 0.15 | … | 0.18 | 0.25 | 0.19 |
| NGC6752-29 | 0.11 | 0.08 | 0.71 | 0.09 | 0.11 | 0.13 | … | 0.24 | 0.21 | 0.40 |
| NGC6752-30 | 0.11 | 0.07 | 0.57 | 0.01 | 0.16 | 0.06 | … | 0.18 | 0.24 | 0.35 |


By comparing the predicted scatter in [X/Fe] (due to errors in the stellar parameters) and the measured scatter, we can understand to what extent are the abundance ratios constant. We estimate the predicted scatter as ([X/Fe]) = ([X/Fe]:)2 + ([X/Fe]:log )2 + ([X/Fe]: where ([X/Fe]:), ([X/Fe]:log ), and ([X/Fe]: are taken from Table 5 and represent the uncertainty in [X/Fe] due to changes in the adopted effective temperature, surface gravity, and microturbulence. We have not included the uncertainties in [X/Fe] due to errors in EWs or errors in the input abundance where consideration of these quantities would increase the predicted scatter. Our uncertainties also do not take into account covariance terms which are discussed by McWilliam et al. (1995) and Johnson (2002). While Johnson (2002) shows that these additional covariance terms are small, their contribution depends upon the strength of the lines, the line lists, and the method for determining stellar parameters. Nevertheless, adding more terms such as errors in the EWs or input abundance would further increase our predicted error which already is well matched to the observed scatter. In Table 6, we compare the predicted and observed scatter in abundance ratios (star NGC6752-7 has been excluded in calculating the observed scatter). For O, Na, and Al we find that the predicted scatter is significantly lower than the observed scatter, as expected given that these elements show star-to-star abundance variations of around 1.0 dex. For Mg, the measured scatter slightly exceeds the predicted scatter. While it may be tempting to conclude that Mg shows no variation, we emphasize that the Mg abundance is anticorrelated with Al (see Grundahl et al. 2002 and Yong et al. 2003) and therefore we argue that Mg shows a small star-to-star variation despite the fair agreement between the predicted and observed scatter. For elements heavier than Al, the predicted and observed scatter are well matched.
| NGC6752-mg6a | NGC6752-15b | |||||
|---|---|---|---|---|---|---|
| Abundance | + 30 | log g + 0.1 | + 0.1 | + 30 | log g + 0.1 | + 0.1 |
| [Fe/H] | 0.01 | 0.01 | 0.02 | 0.03 | 0.01 | 0.03 |
| [O/Fe] | 0.01 | 0.04 | 0.01 | 0.02 | 0.05 | 0.03 |
| [Na/Fe] | 0.03 | 0.02 | 0.01 | 0.01 | 0.01 | 0.03 |
| [Mg/Fe] | 0.02 | 0.02 | 0.03 | 0.01 | 0.02 | 0.01 |
| [Al/Fe] | 0.03 | 0.01 | 0.01 | 0.01 | 0.01 | 0.02 |
| [Si/Fe] | 0.01 | 0.02 | 0.01 | 0.02 | 0.01 | 0.02 |
| [Ca/Fe] | 0.04 | 0.01 | 0.04 | 0.01 | 0.01 | 0.01 |
| [Sc/Fe] | 0.01 | 0.04 | 0.02 | 0.03 | 0.04 | 0.01 |
| [Ti/Fe] | 0.05 | 0.01 | 0.02 | 0.01 | 0.01 | 0.02 |
| [V/Fe] | 0.07 | 0.01 | 0.01 | 0.02 | 0.01 | 0.03 |
| [Mn/Fe] | 0.04 | 0.01 | 0.01 | 0.01 | 0.01 | 0.02 |
| [Co/Fe] | 0.02 | 0.01 | 0.01 | 0.02 | 0.01 | 0.04 |
| [Ni/Fe] | 0.02 | 0.02 | 0.02 | 0.01 | 0.01 | 0.02 |
| [Cu/Fe] | 0.02 | 0.01 | 0.02 | … | … | … |
| [Y/Fe] | 0.01 | 0.03 | 0.02 | 0.03 | 0.04 | 0.02 |
| [Zr/Fe] | 0.08 | 0.01 | 0.01 | … | … | … |
| [Ba/Fe] | 0.01 | 0.04 | 0.07 | 0.01 | 0.04 | 0.04 |
| [La/Fe] | 0.01 | 0.03 | 0.03 | … | … | … |
| [Ce/Fe] | 0.01 | 0.04 | 0.01 | 0.02 | 0.04 | 0.03 |
| [Nd/Fe] | 0.01 | 0.03 | 0.02 | 0.02 | 0.04 | 0.02 |
| [Eu/Fe] | 0.02 | 0.03 | 0.02 | 0.02 | 0.04 | 0.03 |
-
a
NGC6752-mg6: =4154 K, log g=0.68 cm s-2, =2.10 km s-1
-
b
NGC6752-15: =4850 K, log g=2.19 cm s-2, =1.35 km s-1
| [X/Fe] | Mean | ||
|---|---|---|---|
| [Fe/H] | 1.61 | 0.03 | 0.02 |
| [O/Fe] | 0.37 | 0.05 | 0.25 |
| [Na/Fe] | 0.28 | 0.03 | 0.24 |
| [Mg/Fe] | 0.47 | 0.03 | 0.06 |
| [Al/Fe] | 0.72 | 0.03 | 0.34 |
| [Si/Fe] | 0.33 | 0.03 | 0.05 |
| [Ca/Fe] | 0.24 | 0.04 | 0.07 |
| [Sc/Fe] | 0.04 | 0.04 | 0.04 |
| [Ti/Fe] | 0.14 | 0.04 | 0.04 |
| [V/Fe] | 0.28 | 0.05 | 0.10 |
| [Mn/Fe] | 0.45 | 0.03 | 0.06 |
| [Co/Fe] | 0.02 | 0.03 | 0.07 |
| [Ni/Fe] | 0.05 | 0.03 | 0.04 |
| [Cu/Fe] | 0.61 | 0.03 | 0.05 |
| [Y/Fe] | 0.02 | 0.04 | 0.07 |
| [Zr/Fe] | 0.18 | 0.08 | 0.10 |
| [Ba/Fe] | 0.06 | 0.07 | 0.13 |
| [La/Fe] | 0.10 | 0.04 | 0.04 |
| [Ce/Fe] | 0.27 | 0.05 | 0.06 |
| [Nd/Fe] | 0.22 | 0.04 | 0.04 |
| [Eu/Fe] | 0.32 | 0.05 | 0.09 |
Note. — Star NGC6752-7 has been omitted due to its deviating [Fe/H].
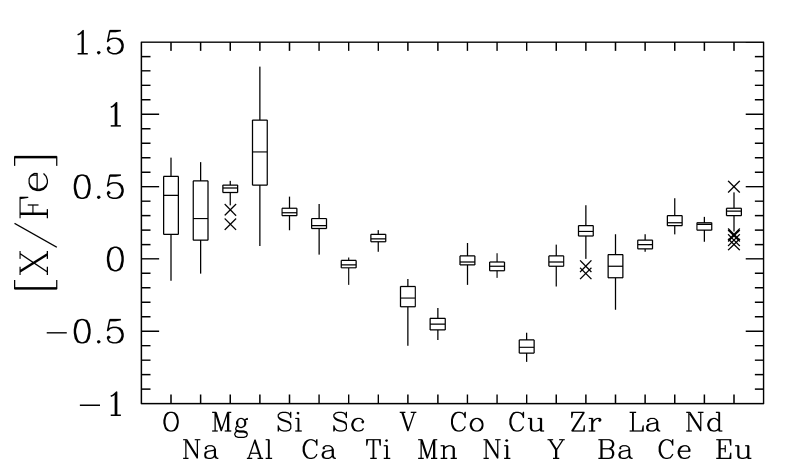
In Figure 6, we plot the summary of our derived abundance ratios for bright giants in NGC 6752 (star NGC6752-7 has been excluded). Following Ivans et al. (1999, 2001) and Ramírez & Cohen (2002, 2003), for each element we plot a box whose upper and lower limits signify the interquartile range (the middle 50% of the data). The line within each box identifies the median. The vertical lines extending from each box represent the total range of the abundance excluding outliers. Outliers are defined as stars that lie more than 3 times the interquartile range from the median. This Figure clearly shows the large range of the star-to-star variation of O, Na, and Al. As a comparison, Sc, Ti, La, and Nd all exhibit a very small range of abundances.
The lack of a significant trend in abundance ratios over the large range in may be regarded as a surprising success of an LTE analysis employing one-dimensional plane parallel model atmospheres. Our results would also suggest that departures from LTE do not greatly affect the elements considered.
In Table 7 we compare our mean abundances for elements heavier than Al with the Norris & Da Costa (1995), James et al. (2004a), and Cavallo et al. (2004) values. For most elements, there is a reasonable agreement between the various studies. The small differences may be entirely attributed to the systematic offsets in stellar parameters and perhaps atomic data. For example, James et al. (2004a) derive from fitting the wings of Hα lines whereas we use the Alonso et al. (1999) :[Fe/H]:color relations. Certainly, the disagreement between our values and Norris & Da Costa (1995) for Nd and La is likely due to the different atomic data where we utilize the recently updated transition probabilities measured by Den Hartog et al. (2003) and Lawler et al. (2001a). It is probably no coincidence that the observed scatter in [X/Fe] for Nd and La is very low. Our Eu abundances differ considerably compared with Norris & Da Costa (1995) and again we identify the different transition probabilities as the likely source of the discrepancy.
| This Study | ND95 | James04 | CPS04 | ||
| Subgiants | Dwarfs | ||||
| Species | Mean () | Mean () | Mean () | Mean () | Mean () |
| [Si/Fe] | 0.33 (0.05) | 0.26 (0.06) | … | … | … |
| [Ca/Fe] | 0.24 (0.07) | 0.40 (0.02) | … | … | 0.26 (0.08) |
| [Sc/Fe] | 0.04 (0.04) | 0.00 (0.05) | … | … | … |
| [Ti/Fe] | 0.14 (0.04) | 0.15 (0.09) | … | … | 0.24 (0.18) |
| [V/Fe] | 0.28 (0.10) | 0.01 (0.08) | … | … | … |
| [Fe/H] | 1.61 (0.02) | 1.52 (0.04) | 1.49 (0.07) | 1.48 (0.07) | 1.58 (0.16) |
| [Ni/Fe] | 0.05 (0.04) | 0.16 (0.03) | … | … | 0.12 (0.12) |
| [Y/Fe] | 0.02 (0.07) | 0.27 (0.09) | 0.01 (0.13) | 0.03 (0.11) | … |
| [Zr/Fe] | 0.18 (0.10) | 0.17 (0.06) | … | … | … |
| [Ba/Fe] | 0.06 (0.13) | 0.00 (0.13) | 0.25 (0.08) | 0.11 (0.09) | … |
| [La/Fe] | 0.10 (0.04) | 0.07 (0.07) | … | … | 0.13 (0.14) |
| [Nd/Fe] | 0.22 (0.04) | 0.07 (0.10) | … | … | … |
| [Eu/Fe] | 0.32 (0.09) | 0.25 (0.06) | 0.40 (0.09) | 0.47 (0.08) | 0.55 (0.12) |
4 Comparison between globular clusters and field stars
The behavior of O, Na, Mg, and Al in NGC 6752 (and numerous other clusters) has been discussed extensively within the literature and is not the main focus of this study. Rather, we turn our attention to elements heavier than Al. Following Sneden et al. (2004a), we compare the abundance ratios between field stars and different globular clusters. For the comparison field stars, we selected the Fulbright (2000) survey (primarily metal-poor dwarfs) and Reddy et al. (2003) survey (thin disk dwarfs) since they concentrated on a large number of elements in samples that exceeded 170 stars. We also included data from the smaller samples of field dwarfs and giants presented by Zhao & Magain (1990), Gratton & Sneden (1991), Burris et al. (2000), and Johnson (2002). For the different globular clusters, we selected those for which high resolution spectra had been obtained of large numbers of stars. While our list of clusters is not as extensive as Sneden et al. (2004a), we do include all clusters with more than 10 stars analyzed. In Table 8, we list the clusters included for comparisons in the following discussion along with their metallicities placed on a uniform scale by Kraft & Ivans (2003, 2004).
| NGC (Other) | [Fe/H]a | Reference |
| 104 (47 Tuc) | 0.70 | Brown & Wallerstein (1992) |
| 288 | 1.41 | Shetrone & Keane (2000) |
| 362 | 1.34 | Shetrone & Keane (2000) |
| 3201 | 1.56 | Gonzalez & Wallerstein (1998) |
| 5272 (M3) | 1.50 | Sneden et al. (2004b) |
| 5904 (M5) | 1.26 | Ivans et al. (2001); Ramírez & Cohen (2003) |
| 6121 (M4) | 1.15 | Ivans et al. (1999) |
| 6205 (M13) | 1.60 | Kraft et al. (1997); Sneden et al. (2004b) |
| 6254 (M10) | 1.51 | Kraft et al. (1995) |
| 6341 (M92) | 2.38 | Shetrone (1996); Sneden et al. (2000c) |
| 6397 | 2.02 | Castilho et al. (2000) |
| 6752 | 1.61 | This study |
| 6838 (M71) | 0.81 | Ramírez & Cohen (2002) |
| 7078 (M15) | 2.42 | Sneden et al. (1997, 2000c) |
| —- (Pal 12) | 0.95 | Cohen (2004) |
4.1 Alpha elements
In Figure 7, we plot the mean abundances for [Si/Fe], [Ca/Fe], and [Ti/Fe] versus [Fe/H]. We include field stars as well as mean values for other globular clusters. These alpha elements are synthesized primarily in massive stars that die as Type II supernovae whereas Fe may be produced in both Type Ia and Type II supernovae. The progenitors of Type II supernovae (i.e., massive stars) have much shorter lifetimes than the progenitors of Type Ia supernovae. A consequence of the different lifetimes and yields is that below [Fe/H]=1.0, the alpha elements are overabundant with respect to Fe, [/Fe]0.4. Above [Fe/H]=1.0, the abundance of the alpha elements decreases from [/Fe]0.4 to [/Fe]=0.0 by solar metallicity in thin disk stars since a growing fraction of the Fe is produced in Type Ia supernovae. In this Figure the well established behavior of the alpha elements with metallicity in field stars is shown. For NGC 6752, the alpha elements are also overabundant with respect to Fe with no evidence from [/Fe] that Type Ia supernovae have contributed. For the globular clusters, the abundances of Si, Ca, and Ti mimic the trends seen in the field stars.

NGC 6752, with respect to [/Fe], is typical of the globular clusters, but not all clusters follow field stars in [/Fe]. A notable exception is Palomar 12. This cluster has a low value of [/Fe] compared to field stars and other globular clusters at the same metallicity (Brown, Wallerstein, & Zucker 1997; Cohen 2004). This cluster appears to lie in a stream extending from the Sagittarius dwarf spheroidal galaxy. Cohen (2004) showed that the abundance ratios in Pal 12 are in good agreement with stars in the Sagittarius dwarf spheroidal galaxy (Bonifacio et al. 2000; McWilliam, Rich, & Smecker-Hane 2003; Bonifacio et al. 2004; Shetrone 2004). That this cluster also appears to be younger than other Galactic globular clusters (Gratton & Ortolani 1988; Stetson et al. 1989) reinforces the idea that Pal 12 was originally a globular cluster associated with the Sagittarius galaxy. The low [/Fe] may be attributed to a region in which the chemical evolution was slow. That is, star formation continued for a sufficiently long period such that Type Ia supernovae had time to evolve and contaminate the stars’ natal gas with iron and other products.
4.2 Iron-peak elements
In Figure 8, we plot the mean abundance of [Sc/Fe], [V/Fe], and [Ni/Fe] versus metallicity in globular clusters and field stars. In field stars, these Fe-peak elements follow the abundance of Fe. Again we find that the globular clusters seem to mimic the trends seen in the field stars. That is, at a given metallicity, [X/Fe]0. For Sc and Ni, NGC 6752 does not appear unusual when compared with other clusters: we note that our V abundance appears low compared to field stars and other clusters. Our mean value [V/Fe]= is lower than the Norris & Da Costa (1995) value of [V/Fe]=. Our predicted scatter for V is well matched to the observed scatter. However, in a given star, the abundances from different V lines showed a higher scatter than for all other elements ( dex). We suggest that our mean error for V (based on the standard deviation of [V/Fe] in all stars) is underestimated. Pal 12 appears to be slightly underabundant in V and Sc with respect to field stars at the same metallicity. As explained in the previous paragraph, Cohen (2004) suggested that the peculiar abundance ratios may be evidence that Pal 12 was originally a globular cluster belonging to the Sagittarius galaxy.

Mn and Cu are odd-Z iron-peak elements that show subsolar abundance ratios with respect to Fe in metal-poor field stars. Inspection of Figure 3 in Gratton et al. (2004) shows that our mean ratios for NGC 6752 [Mn/Fe]=0.45 and [Cu/Fe]=0.61 are in very good agreement with other globular clusters and field stars at the metallicity of NGC 6752 [Fe/H]=1.61.
4.3 Neutron-capture elements
Heavy elements are synthesized via neutron-capture through either the - or the -process. The latter’s site is generally identified with Type II supernovae (i.e., the death of massive stars), and the former with AGB stars. In general, both processes may contribute to the synthesis of a particular element. Dissection of the solar system abundances shows that Eu is primarily a -process product: Burris et al. (2000) put the -process fraction at 97%. On the other hand, Ba in the solar mix is largely a -process product: 85% due to that process and 15% to the -process. Of the other elements we have measured, Y, Zr, La, and Ce approximately follow Ba with -process contributions ranging from 72% to 81%. The remaining element Nd for the solar mix is roughly equally attributed to both processes. There is as yet no firm theoretical guidance on how these - and -process fractions may vary with metallicity and other variables influencing the chemical evolution of a globular cluster.
In Figure 9, we plot the mean abundance of [Y/Fe], [Ba/Fe], and [Eu/Fe] versus [Fe/H] in globular clusters and field stars. The [Eu/Fe] of the field stars rises to [Eu/Fe] with little star-to-star scatter until [Fe/H] . That this behavior mimics that of an -element suggests that Eu and the -elements have a common origin (i.e., Type II supernovae) and that the relative yields from stellar nucleosynthesis of -elements like Mg and Si to Eu are insensitive to the initial metallicity of the stars. The mean [Eu/Fe] for NGC 6752 is similar to that of field stars and other globular clusters of NGC 6752’s [Fe/H]. For [Y/Fe] and [Ba/Fe], the field stars do not show any obvious behavior with metallicity. While the scatter is large, the globular cluster abundances track the field stars.

Some halo stars with large enhancements of neutron-capture elements show scaled solar -process abundance distributions for Ba and heavier elements (e.g., Cowan et al. 1999; Westin et al. 2000; Hill et al. 2002; Sneden et al. 2003). A few elements permit measurements of the isotope ratios. In a handful of metal-poor stars, the isotope ratios for Ba (Lambert & Allende Prieto 2002) and Eu (Sneden et al. 2002; Aoki et al. 2003) are consistent with a scaled solar pure -process mix. That some metal-poor stars show scaled solar -process abundances is evidence that the -process may be universal, at least for heavy elements, . That is, whatever mechanism is responsible for the synthesis of the -process elements (Ba and heavier elements) in the sun may have operated at all metallicities.
In addition to the usual dispersion in O, Na, Mg, and Al, Sneden et al. (1997) found star-to-star variations of Ba and Eu in the globular cluster M 15 with the mean value of [Ba/Fe] and [Eu/Fe] agreeing well with other clusters. Sneden et al. (2004a) note that while the abundances of Ba and Eu vary in M 15, for all stars the ratio [Ba/Eu] is constant. Sneden et al. (2000b) re-observed 3 giants in M 15 in order to conduct a more detailed abundance analysis of heavy elements. They found that the abundance ratios for Ba to Dy matched the scaled solar-system -process distribution. This suggests that the evolution of the heavy element abundances of M 15 is dominated solely by explosive nucleosynthesis in high-mass stars with effectively no contribution from AGB stars.
James et al. (2004a) measured [Ba/Eu]= in unevolved stars in NGC 6752. This value lies between the pure -process and the solar mix. Our [Ba/Eu]= is slightly lower than the James et al. (2004a) value, but within the errors these ratios are in agreement. Our value of [Ba/Eu] also lies between the pure -process and the solar mix and agrees with field stars at the same metallicity. Simmerer et al. (2004) measured the ratio [La/Eu] in a large sample of field stars. [La/Eu] offers an alternative to [Ba/Eu] as a measure of the evolution of the - and -process. La has numerous lines at visible wavelengths and therefore provides a more reliable measure of the -process than Ba whose few lines are often saturated. Our value of [La/Eu]= in bright giants of NGC 6752 is roughly halfway between the pure -process and the solar mix. This value is also in good agreement with field stars at the same metallicity (Simmerer et al. 2004). The -process is believed to occur in low-mass to intermediate-mass AGB stars. The solar mix therefore represents a combination of products of Type II supernovae and AGB stars. That our measured ratios of [Ba/Eu] and [La/Eu] lie between the pure -process and the solar mix indicates that the material from which the cluster stars formed was enriched by AGB ejecta. While these elements may have been synthesized in the cluster, or proto-cluster, an alternative possibility is that they were produced in the halo prior to the formation of the cluster. The latter option may explain the similarity in [Ba/Eu] and [La/Eu] abundances between field and cluster stars of the same metallicity. Unlike the heavier elements, for elements lighter than Ba the abundance ratios observed in metal-poor stars do not match the pure -process solar mix. In representative field stars, the ratios [Sr/Ba] and [Y/Ba] show a large dispersion at low [Fe/H] despite having a constant [Ba/Eu] close to the pure -process value (McWilliam 1998). These measurements (constant [Ba/Eu] combined with variations in [Sr/Ba] and [Y/Ba]) have led to the suggestion that there are multiple sites for the -process (Wasserburg et al. 1996; Sneden et al. 2000a; Qian & Wasserburg 2001). Our cluster value [Y/Ba]=0.03 lies well above the pure -process value and is in good agreement with field stars at the same metallicity.
5 Globular cluster chemical evolution
5.1 Abundance anomalies for light elements
Having discussed elements heavier than Al, we offer some comments relating to the star-to-star abundance variation of light elements. At the heart of the proposed evolutionary scenarios are various mixing mechanisms required to transport material from deep layers within the star to the outer envelope. These mixing processes cannot operate in stars below the RGB bump due to the sharp composition discontinuity left by the deepest penetration of the convective envelope (Sweigart & Mengel 1979). Sweigart & Mengel (1979) also showed that once the composition barrier is removed by the outward moving H-burning shell, mixing mechanisms can tap deep layers where H-burning occurs through the CNO-cycles, and possibly the Ne-Na and Mg-Al chains. Over a wide range of metallicities, Zoccali et al. (1999) have shown that the observed luminosity of the RGB bump agrees with theoretical predictions. The crucial discovery of the O-Na and Mg-Al anticorrelation in unevolved stars in NGC 6752 (Gratton et al. 2001) was proof that the abundance variations of O, Na, Mg, and Al must be primarily due to a primordial scenario. Furthermore, Grundahl et al. (2002) measured abundances of O, Na, Mg, Al, and Li in NGC 6752 giants. They showed that Li is present in stars below the RGB bump, but absent in stars above the bump. That is, mixing in cluster stars cannot occur below the bump but above the bump Li is destroyed by mixing. However, Grundahl et al. (2002) also demonstrated that the anticorrelations between O-Na and Mg-Al are present below the bump with no obvious change in amplitude or in mean abundance, reinforcing the evidence provided by Gratton et al. (2001) that the O, Na, Mg, and Al variations must have a primordial origin. Note that an “evolutionary” component is essential to explain the C, N, and Li abundances as well as C isotope ratios that show a dependence on evolutionary status.
5.2 AGB stars
Based on overabundances of Na and Al in CN strong stars of NGC 6752, Cottrell & Da Costa (1981) first proposed a primordial scenario to explain the abundance variations in which intermediate-mass AGB stars pollute the proto-cluster gas. The envelopes of metal-poor intermediate-mass AGB stars qualitatively have the correct composition to produce the observed abundance anomalies. Two possibilities exist for the AGB pollution scenario. In the first scenario, AGB stars pollute the proto-cluster gas from which the present cluster members form as suggested by Cottrell & Da Costa (1981). In the second scenario, the present cluster members accrete material ejected from AGB stars. Low-mass main sequence stars have thin convection zones whereas evolved giants have deep convective envelopes. If the abundance anomalies were only present in the thin convective zone during the main sequence, they would be diluted as the star ascends the giant branch. Observations show that this does not occur. While calculations by Thoul et al. (2002) have shown that cluster “stars can accrete an appreciable fraction of their initial mass”, it is perhaps more likely that the stars were born with inhomogeneous compositions.
If the abundance variations are due to differing degrees of pollution of natal clouds from intermediate-mass AGB stars, should there be other elements besides O-Al that display a star-to-star variation? There are two possible effects that we identify. The first is that H-burning at high temperatures in AGB stars will alter the H/He ratio. The most obvious direct effect is that the hydrogen abundance should be lower and hence we would expect a higher [Fe/H] in stars with the highest Al abundance. There is an additional consequence of differing H/He ratios on the atmosphere. The increase in He and corresponding decrease in H lowers the continuous opacity (H-) per gram. For an atmosphere with increased He, the appearance of the spectrum would be equivalent to an increase in heavy element abundances and surface gravity (see Böhm-Vitense 1979 for a detailed discussion). It would be of great interest to do a detailed calculation of the expected change in [X/Fe] due to differing ratios of H/He. The second effect that we may expect is a correlation between -process elements and say Al abundance since -process elements are synthesized in AGB stars. However, in metal-poor intermediate-mass AGB stars, the O-Al abundances are altered in the hot-bottom convective envelope. The -process elements are synthesized in thermal pulses and dredge-up. If this is a correct division of responsibility, it is possible that the -process abundances may show little dependence on the O-Al abundance variations. However, as far as we are aware, theoretical predictions of -process yields from metal-poor intermediate-mass (MM⊙) AGB stars are rare. Travaglio et al. (2004) carried out calculations for a range of masses and metallicities but did not publish yields for each model.
5.3 Quantitative problems with the AGB pollution scenario
While the AGB pollution scenario may offer an appealing qualitative explanation for the observed abundance anomalies, a more quantitative consideration reveals a number of serious problems (see Lattanzio et al. 2004 for a review). The AGB models predict much higher ratios of 25Mg/24Mg and 26Mg/24Mg when O is depleted (Denissenkov & Herwig 2003). AGB models also cannot produce the observed pattern of low C and O abundances along with high N abundances (Denissenkov & Weiss 2004). A chemical evolution model of NGC 6752 constructed by Fenner et al. (2004) incorporating recent AGB yields reproduced the Na and Al dispersion. However O was not sufficiently depleted, Mg was produced rather than destroyed, C+N+O was not constant, and 25Mg should be correlated with 26Mg. Fenner et al. (2004) note that all of these problems arise from the addition of He-burning products into the AGB ejecta and that a generation of AGB stars that experience hot-bottom burning but no dredge-up of He-burning products might provide a better match to the observations. We caution that globular cluster chemical evolution modelling is in a developing phase and that the AGB yields are critically dependent on the treatment of convection. While Fenner et al. (2004) found that Mg increases with Al, Denissenkov & Weiss (2004) discuss 24Mg destruction with increasing Al. However, the current theoretical yields and chemical evolution models do not favor the AGB pollution scenario (with intermediate-mass AGBs) as the mechanism responsible for the star-to-star abundance variations in globular clusters.
An alternative pollution scenario has been proposed by Denissenkov & Weiss (2004). In this case, the star-to-star variations may result from mass transfer in binaries in which the more massive star (now a white dwarf) was an RGB and/or AGB star slightly more massive than the present main sequence turn-off cluster stars. To explain the abundance variations, these RGB/AGB stars must have experienced extra mixing during the course of their evolution. That the O-Na and Mg-Al anticorrelations are not seen in field stars would imply a fundamental difference between field and globular cluster stars.
5.4 Additional evidence to probe the origin of the abundance anomalies: heavy element variations
A major goal of our present study is to search for heavy element variations. Our very accurate abundance ratios can be used to search for correlations between heavy elements and Al. This will provide additional clues to the origin of the abundance variations. That the observed scatter is well matched to the predicted scatter is no guarantee that the abundances for Si and heavier elements are constant. For example, the observed and predicted dispersions for Mg are in agreement but Mg and Al are anticorrelated and therefore Mg shows a small star-to-star variation. Do any other elements show correlations with Al?
In Figure 10, we plot [Fe/H], [Si/Fe], and -process elements (Y, Zr, Ba, La, and Ce) versus [Al/Fe]. Different symbols are used for the bump and tip stars which may help reveal whether correlations are real or merely artefacts of effects. There is a hint that the iron abundance [Fe/H] may increase with increasing [Al/Fe]. If verified through a more careful differential analysis, this may indicate that the He abundance increases with increasing [Al/Fe] as expected if the abundance anomalies are produced via H-burning at high temperatures. We find a statistically significant correlation between [Si/Fe] and [Al/Fe]. Such a trend would arise if the reaction 27Al(p,)28Si takes place rather than 27Al(p,)24Mg within the Mg-Al chain. Hot-bottom burning in intermediate-mass AGB stars can produce 28Si from proton capture on 27Al, though the Si yields are expected to be small (Karakas 2003). While the small Si excess may be due to production of 29Si and 30Si via neutron capture in the He shell of AGB stars, the total Si abundance would not change unless some leakage from the Mg-Al cycle into 28Si takes place. A statistically significant slope is also evident between [Y/Fe] and [Al/Fe]. For Zr, the bump stars show a clear correlation between [Zr/Fe] and [Al/Fe] where the Zr abundances are derived from the 5112Å Zr ii line. The Zr abundances for the tip stars come from both Zr i and Zr ii lines. If we consider only abundances from Zr ii lines, the slope (0.12) and error (0.04) for the linear least squares fit between [Zr/Fe] and [Al/Fe] is more significant. [Ba/Fe] is also correlated with [Al/Fe], the third -process element that shows evidence for a variation with [Al/Fe]. On the other hand, the Eu abundance [Eu/Fe] appears uniform across the sample. There is no correlation between Eu and Al abundances across the more than 1 dex spread in the Al abundance, suggesting that the source of the Al (and O, Na, and Mg) abundance variations is not producing Eu.

Perhaps the most direct and accurate indicator of a dispersion in heavy element abundances will be provided by relative abundance ratios between heavy elements. In Figure 11, we plot [Y/Eu], [Zr/Eu], [Ba/Eu], and [Ce/Eu] versus [Al/Fe]. In particular, abundances for Y, Zr, Ce, and Eu come from relatively unsaturated lines of ions in all cases. Again, we find correlations between heavy element abundance ratios and [Al/Fe].

While the correlations between [X/Fe] and [Al/Fe] as well as [X/Eu] and [Al/Fe] are statistically significant, we note that the amplitudes of the abundance variations are small. The 1.3 dex increase in [Al/Fe] is accompanied by roughly 0.1 dex increases in [X/Fe]. As a comparison, for [Mg/Fe] versus [Al/Fe] the formal slope is 0.13 with an uncertainty of 0.01. It is possible that errors in the stellar parameters are producing the correlations. However, our linear least squares fits take into account the uncertainties due to errors in the stellar parameters. Since [Al/Fe] and [Na/Fe] span more than 1 dex and the Al-rich/poor stars are not correlated with , it will be difficult for atmospheric parameter errors to produce a slope between heavy elements and Al.
For the first time, we provide evidence that the -process elements Y, Zr, and Ba are correlated with Al and may therefore exhibit a small star-to-star variation. James et al. (2004a) did not find correlations between Sr, Y, Ba, or Eu and Al in unevolved stars though their spectra were taken with a lower resolving power and S/N. Our results suggest that the stars in which the abundance anomalies were produced also synthesized -process elements to a small degree. While AGB stars may be the most promising candidates for explaining correlations between say Y and Al, recent AGB yields and chemical evolution models show that intermediate-mass AGB stars cannot explain the light element abundance variations. If the variations in Y, Zr, and Ba are real, then the star-to-star dispersion for O-Al abundances may be due to differing degrees of pollution from stars that also ran the -process: perhaps an unknown class of AGB stars.
The lack of significant correlations between the other -process elements (La and Ce) and [Al/Fe] may be due to measurement uncertainties, though both La and Ce have smaller predicted and observed dispersions than Zr and Ba. On the other hand, the lack of trends between La and Al or Ce and Al might be a real effect that can be used to probe the stars in which the Al anomalies were synthesized (presumably the same stars are also responsible for producing the C, N, O, Na, and Mg variations).
6 Summary and concluding remarks
Globular clusters are the oldest Galactic objects and are considered by some to be the basic building blocks of galaxies. Yet, our understanding of their chemical evolution is incomplete. Here we present elemental abundance ratios [X/Fe] for 20 elements in 38 bright giants in the globular cluster NGC 6752 to study the chemical evolution of this cluster. Our sample size and number of elements considered makes this study the most comprehensive spectroscopic abundance analysis of NGC 6752 to date. None of the abundance ratios [X/Fe] show a trend with , that is, evolutionary status. We estimated the predicted scatter due to uncertainties in the adopted stellar parameters (effective temperature, surface gravity, and microturbulence). For all elements heavier than Al, the small observed scatter is well matched by the predicted scatter. The mean abundance ratios [X/Fe] for elements heavier than Al are in good agreement with previous studies of bright giants and unevolved stars in this cluster. The mean [X/Fe] for this cluster are also consistent with other globular clusters as well as field stars at the same metallicity. For elements heavier than Al, the nucleosynthetic processes responsible for the evolution of the elements in field stars must also drive the proto-globular cluster gas to its present metallicity.
The abundance ratio [Ba/Eu]= agrees with previous studies and lies midway between the pure -process value and the solar (-process + -process) mix. Similarly, our measured abundance ratio [La/Eu]= (which takes advantage of recently updated transition probabilities) lies midway between the pure -process and the solar mix and agrees with field stars at the same metallicity (Simmerer et al. 2004). This demonstrates that AGB stars played a role in the chemical evolution of the proto-cluster gas.
Mg is an example where the observed and predicted dispersion are in good agreement, but an anticorrelation with Al indicates a star-to-star variation for Mg. We compared abundance ratios with [Al/Fe] to search for correlations which would reveal small abundance variations. There was a hint of a trend between [Fe/H] and [Al/Fe]. If confirmed from future analyses, this would suggest differing H/He ratios as expected if the abundance anomalies are produced from H-burning at high temperatures. We found a correlation between [Si/Fe] and [Al/Fe] which can be explained if the reaction 27Al(p,)28Si is favored over 27Al(p,)24Mg at the end of the Mg-Al chain. Hot-bottom burning in intermediate-mass AGB stars is expected to produce small amounts of Si. Most importantly, we found correlations between [Y/Fe] and [Al/Fe], [Zr/Fe] and [Al/Fe], as well as [Ba/Fe] and [Al/Fe]. These correlations offer the first evidence for variations in -process elements for NGC 6752. That these elements are correlated with [Al/Fe] suggests that the stars responsible for the synthesis of the Al variations (and presumably all abundance anomalies) also synthesized -process elements. The stellar origins of the light and heavy element abundance variations remain uncertain. Intermediate-mass AGB stars remain a viable candidate as long as theoretical models contain major uncertainties (e.g., the treatment of convection) and published models differ over the composition of the ejecta (e.g., is Mg enriched or depleted? [Fenner et al. 2004; Denissenkov & Weiss 2004]).
Despite measuring the abundances of 20 elements in NGC 6752, there are at least two more elements we wish to measure which will provide strong constraints on the possible role of AGB stars in the chemical evolution of this cluster. Rb and Pb are of particular interest and have not yet been measured in NGC 6752 nor in any other globular cluster. Measurements of Rb will provide further observational constraints on the AGB pollution scenario since the ratio Rb/Zr is sensitive to the neutron density and therefore mass of the AGB star (Lambert et al. 1995; Tomkin & Lambert 1999; Busso, Gallino, & Wasserburg 1999; Abia et al. 2001). Intermediate-mass AGB stars are predicted to have high neutron densities and so we would expect Rb to be overabundant with respect to Y or Zr if such stars have contributed to the evolution of the cluster. Since Pb and Bi are the main products of very metal-poor AGB stars (Busso et al. 1999), we may expect considerable Pb enhancements. These measurements will provide further insight into the chemical evolution of this globular cluster.
Acknowledgements.
We thank the referee, Raffaele Gratton, for helpful comments. DY is grateful to Bruce Carney, Inese Ivans, Amanda Karakas, John Lattanzio, Jennifer Simmerer, and Jocelyn Tomkin for helpful discussions and insights. FG gratefully acknowledges the financial support provided by the Carlsberg Foundation and through a grant from Professor Henning E. Jørgensen. Financial support from The Instrument Center for Danish Astrophysics (IDA) during the last phase of the project is also acknowledged. DLL and DY acknowledge support from the Robert A. Welch Foundation of Houston, Texas. This research has made use of the SIMBAD database, operated at CDS, Strasbourg, France and NASA’s Astrophysics Data System.References
- Abia et al. (2001) Abia, C., Busso, M., Gallino, R., et al. 2001, ApJ, 559, 1117
- Alonso et al. (1999) Alonso, A., Arribas, S., & Martínez-Roger, C. 1999, A&AS, 140, 261
- Aoki et al. (2003) Aoki, W., Honda, S., Beers, T. C., & Sneden, C. 2003, ApJ, 586, 506
- Böhm-Vitense (1979) Böhm-Vitense, E. 1979, ApJ, 234, 521
- Bell et al. (1983) Bell, R. A., Hesser, J. E., & Cannon, R. D. 1983, ApJ, 269, 580
- Bonifacio et al. (2000) Bonifacio, P., Hill, V., Molaro, P., et al. 2000, A&A, 359, 663
- Bonifacio et al. (2004) Bonifacio, P., Sbordone, L., Marconi, G., Pasquini, L., & Hill, V. 2004, A&A, 414, 503
- Briley et al. (2002) Briley, M. M., Cohen, J. G., & Stetson, P. B. 2002, ApJ, 579, L17
- Brown & Wallerstein (1992) Brown, J. A. & Wallerstein, G. 1992, AJ, 104, 1818
- Brown et al. (1997) Brown, J. A., Wallerstein, G., & Zucker, D. 1997, AJ, 114, 180
- Buonanno et al. (1986) Buonanno, R., Caloi, V., Castellani, V., et al. 1986, A&AS, 66, 79
- Burris et al. (2000) Burris, D. L., Pilachowski, C. A., Armandroff, T. E., et al. 2000, ApJ, 544, 302
- Busso et al. (1999) Busso, M., Gallino, R., & Wasserburg, G. J. 1999, ARA&A, 37, 239
- Cannon et al. (1998) Cannon, R. D., Croke, B. F. W., Bell, R. A., Hesser, J. E., & Stathakis, R. A. 1998, MNRAS, 298, 601
- Carretta et al. (2004) Carretta, E., Gratton, R., Lucatello, S., Bragaglia, A., & Bonifacio, P. 2004, A&A in press (astro-ph/0411241)
- Carretta & Gratton (1997) Carretta, E. & Gratton, R. G. 1997, A&AS, 121, 95
- Castilho et al. (2000) Castilho, B. V., Pasquini, L., Allen, D. M., Barbuy, B., & Molaro, P. 2000, A&A, 361, 92
- Cavallo et al. (2004) Cavallo, R. M., Suntzeff, N. B., & Pilachowski, C. A. 2004, AJ, 127, 3411
- Cohen (1978) Cohen, J. G. 1978, ApJ, 223, 487
- Cohen (1979) —. 1979, ApJ, 231, 751
- Cohen (1980) —. 1980, ApJ, 241, 981
- Cohen (1981) —. 1981, ApJ, 247, 869
- Cohen (1999) —. 1999, AJ, 117, 2434
- Cohen (2004) —. 2004, AJ, 127, 1545
- Cohen et al. (2002) Cohen, J. G., Briley, M. M., & Stetson, P. B. 2002, AJ, 123, 2525
- Cohen & Meléndez (2005) Cohen, J. G. & Meléndez, J. 2005, AJ, 129, 303
- Cottrell & Da Costa (1981) Cottrell, P. L. & Da Costa, G. S. 1981, ApJ, 245, L79
- Cowan et al. (1999) Cowan, J. J., Pfeiffer, B., Kratz, K.-L., et al. 1999, ApJ, 521, 194
- Da Costa & Cottrell (1980) Da Costa, G. S. & Cottrell, P. L. 1980, ApJ, 236, L83
- Den Hartog et al. (2003) Den Hartog, E. A., Lawler, J. E., Sneden, C., & Cowan, J. J. 2003, ApJS, 148, 543
- Denissenkov & Herwig (2003) Denissenkov, P. A. & Herwig, F. 2003, ApJ, 590, L99
- Denissenkov & Weiss (2004) Denissenkov, P. A. & Weiss, A. 2004, ApJ, 603, 119
- D’Odorico et al. (2000) D’Odorico, S., Cristiani, S., Dekker, H., et al. 2000, in Proc. SPIE Vol. 4005, p. 121-130, Discoveries and Research Prospects from 8- to 10-Meter-Class Telescopes, Jacqueline Bergeron; Ed., 121–130
- Fenner et al. (2004) Fenner, Y., Campbell, S., Karakas, A. I., Lattanzio, J. C., & Gibson, B. K. 2004, MNRAS, 353, 789
- Freeman & Bland-Hawthorn (2002) Freeman, K. & Bland-Hawthorn, J. 2002, ARA&A, 40, 487
- Fulbright (2000) Fulbright, J. P. 2000, AJ, 120, 1841
- Gonzalez & Wallerstein (1998) Gonzalez, G. & Wallerstein, G. 1998, AJ, 116, 765
- Gratton et al. (2004) Gratton, R., Sneden, C., & Carretta, E. 2004, ARA&A, 42, 385
- Gratton et al. (2001) Gratton, R. G., Bonifacio, P., Bragaglia, A., et al. 2001, A&A, 369, 87
- Gratton et al. (2003) Gratton, R. G., Bragaglia, A., Carretta, E., et al. 2003, A&A, 408, 529
- Gratton & Ortolani (1988) Gratton, R. G. & Ortolani, S. 1988, A&AS, 73, 137
- Gratton & Sneden (1991) Gratton, R. G. & Sneden, C. 1991, A&A, 241, 501
- Grundahl et al. (2002) Grundahl, F., Briley, M., Nissen, P. E., & Feltzing, S. 2002, A&A, 385, L14
- Grundahl et al. (1999) Grundahl, F., Catelan, M., Landsman, W. B., Stetson, P. B., & Andersen, M. I. 1999, ApJ, 524, 242
- Harris (1996) Harris, W. E. 1996, AJ, 112, 1487
- Helfer et al. (1959) Helfer, H. L., Wallerstein, G., & Greenstein, J. L. 1959, ApJ, 129, 700
- Hesser (1978) Hesser, J. E. 1978, ApJ, 223, L117
- Hesser & Bell (1980) Hesser, J. E. & Bell, R. A. 1980, ApJ, 238, L149
- Hill et al. (2002) Hill, V., Plez, B., Cayrel, R., et al. 2002, A&A, 387, 560
- Ivans et al. (2001) Ivans, I. I., Kraft, R. P., Sneden, C., et al. 2001, AJ, 122, 1438
- Ivans et al. (1999) Ivans, I. I., Sneden, C., Kraft, R. P., et al. 1999, AJ, 118, 1273
- James et al. (2004a) James, G., François, P., Bonifacio, P., et al. 2004a, A&A, 414, 1071
- James et al. (2004b) —. 2004b, A&A, 427, 825
- Johnson (2002) Johnson, J. A. 2002, ApJS, 139, 219
- Karakas (2003) Karakas, A. I. 2003, Ph.D. Thesis, Monash University
- Kraft (1994) Kraft, R. P. 1994, PASP, 106, 553
- Kraft & Ivans (2003) Kraft, R. P. & Ivans, I. I. 2003, PASP, 115, 143
- Kraft & Ivans (2004) —. 2004, Carnegie Observatories Astrophysics Series, Vol. 4: Origin and Evolution of the Elements, ed. A. McWilliam and M. Rauch (Cambridge: Cambridge Univ. Press, in press)
- Kraft et al. (1995) Kraft, R. P., Sneden, C., Langer, G. E., Shetrone, M. D., & Bolte, M. 1995, AJ, 109, 2586
- Kraft et al. (1997) Kraft, R. P., Sneden, C., Smith, G. H., et al. 1997, AJ, 113, 279
- Kurucz (1993) Kurucz, R. 1993, ATLAS9 Stellar Atmosphere Programs and 2 km/s grid. Kurucz CD-ROM No. 13. Cambridge, Mass.: Smithsonian Astrophysical Observatory, 1993., 13
- Kurucz & Bell (1995) Kurucz, R. & Bell, B. 1995, Atomic Line Data (R.L. Kurucz and B. Bell) Kurucz CD-ROM No. 23. Cambridge, Mass.: Smithsonian Astrophysical Observatory, 1995., 23
- Lambert & Allende Prieto (2002) Lambert, D. L. & Allende Prieto, C. 2002, MNRAS, 335, 325
- Lambert et al. (1995) Lambert, D. L., Smith, V. V., Busso, M., Gallino, R., & Straniero, O. 1995, ApJ, 450, 302
- Lattanzio et al. (2004) Lattanzio, J., Karakas, A., Campbell, S., Elliott, L., & Chieffi, A. 2004, Memorie della Societa Astronomica Italiana, 75, 322
- Lawler et al. (2001a) Lawler, J. E., Bonvallet, G., & Sneden, C. 2001a, ApJ, 556, 452
- Lawler et al. (2001b) Lawler, J. E., Wickliffe, M. E., den Hartog, E. A., & Sneden, C. 2001b, ApJ, 563, 1075
- McWilliam (1998) McWilliam, A. 1998, AJ, 115, 1640
- McWilliam et al. (1995) McWilliam, A., Preston, G. W., Sneden, C., & Searle, L. 1995, AJ, 109, 2757
- McWilliam et al. (2003) McWilliam, A., Rich, R. M., & Smecker-Hane, T. A. 2003, ApJ, 592, L21
- Minniti et al. (1993) Minniti, D., Geisler, D., Peterson, R. C., & Claria, J. J. 1993, ApJ, 413, 548
- Minniti et al. (1996) Minniti, D., Peterson, R. C., Geisler, D., & Claria, J. J. 1996, ApJ, 470, 953
- Norris et al. (1981) Norris, J., Cottrell, P. L., Freeman, K. C., & Da Costa, G. S. 1981, ApJ, 244, 205
- Norris & Da Costa (1995) Norris, J. E. & Da Costa, G. S. 1995, ApJ, 441, L81
- Osborn (1971) Osborn, W. 1971, The Observatory, 91, 223
- Peebles & Dicke (1968) Peebles, P. J. E. & Dicke, R. H. 1968, ApJ, 154, 891
- Penny & Dickens (1986) Penny, A. J. & Dickens, R. J. 1986, MNRAS, 220, 845
- Peterson (1980) Peterson, R. C. 1980, ApJ, 237, L87
- Popper (1947) Popper, D. M. 1947, ApJ, 105, 204
- Prochaska et al. (2000) Prochaska, J. X., Naumov, S. O., Carney, B. W., McWilliam, A., & Wolfe, A. M. 2000, AJ, 120, 2513
- Qian & Wasserburg (2001) Qian, Y.-Z. & Wasserburg, G. J. 2001, ApJ, 559, 925
- Ramírez & Cohen (2002) Ramírez, S. V. & Cohen, J. G. 2002, AJ, 123, 3277
- Ramírez & Cohen (2003) —. 2003, AJ, 125, 224
- Reddy et al. (2003) Reddy, B. E., Tomkin, J., Lambert, D. L., & Allende Prieto, C. 2003, MNRAS, 340, 304
- Shetrone (1996) Shetrone, M. D. 1996, AJ, 112, 1517
- Shetrone (2004) —. 2004, Carnegie Observatories Astrophysics Series, Vol. 4: Origin and Evolution of the Elements, ed. A. McWilliam and M. Rauch (Cambridge: Cambridge Univ. Press, in press)
- Shetrone & Keane (2000) Shetrone, M. D. & Keane, M. J. 2000, AJ, 119, 840
- Simmerer et al. (2004) Simmerer, J., Sneden, C., Cowan, J. J., et al. 2004, ApJ, 617, 1091
- Simmerer et al. (2003) Simmerer, J., Sneden, C., Ivans, I. I., et al. 2003, AJ, 125, 2018
- Sneden (1973) Sneden, C. 1973, ApJ, 184, 839
- Sneden et al. (2000a) Sneden, C., Cowan, J. J., Ivans, I. I., et al. 2000a, ApJ, 533, L139
- Sneden et al. (2002) Sneden, C., Cowan, J. J., Lawler, J. E., et al. 2002, ApJ, 566, L25
- Sneden et al. (2003) —. 2003, ApJ, 591, 936
- Sneden et al. (2004a) Sneden, C., Ivans, I. I., & Fulbright, J. P. 2004a, Carnegie Observatories Astrophysics Series, Vol. 4: Origin and Evolution of the Elements, ed. A. McWilliam and M. Rauch (Cambridge: Cambridge Univ. Press, in press)
- Sneden et al. (2000b) Sneden, C., Johnson, J., Kraft, R. P., et al. 2000b, ApJ, 536, L85
- Sneden et al. (2004b) Sneden, C., Kraft, R. P., Guhathakurta, P., Peterson, R. C., & Fulbright, J. P. 2004b, AJ, 127, 2162
- Sneden et al. (1997) Sneden, C., Kraft, R. P., Shetrone, M. D., et al. 1997, AJ, 114, 1964
- Sneden et al. (2000c) Sneden, C., Pilachowski, C. A., & Kraft, R. P. 2000c, AJ, 120, 1351
- Stetson et al. (1989) Stetson, P. B., Hesser, J. E., Smith, G. H., Vandenberg, D. A., & Bolte, M. 1989, AJ, 97, 1360
- Suntzeff & Smith (1991) Suntzeff, N. B. & Smith, V. V. 1991, ApJ, 381, 160
- Sweigart & Mengel (1979) Sweigart, A. V., & Mengel, J. G. 1979, ApJ, 229, 624
- Thoul et al. (2002) Thoul, A., Jorissen, A., Goriely, S., et al. 2002, A&A, 383, 491
- Tomkin & Lambert (1999) Tomkin, J. & Lambert, D. L. 1999, ApJ, 523, 234
- Travaglio et al. (2004) Travaglio, C., Gallino, R., Arnone, E., Cowan, J., Jordan, F., & Sneden, C. 2004, ApJ, 601, 864
- Vandenberg et al. (1996) Vandenberg, D. A., Stetson, P. B., & Bolte, M. 1996, ARA&A, 34, 461
- VandenBerg et al. (2000) VandenBerg, D. A., Swenson, F. J., Rogers, F. J., Iglesias, C. A., & Alexander, D. R. 2000, ApJ, 532, 430
- Wasserburg et al. (1996) Wasserburg, G. J., Busso, M., & Gallino, R. 1996, ApJ, 466, L109
- West et al. (2004) West, M. J., Côté, P., Marzke, R. O., & Jordán, A. 2004, Nature, 427, 31
- Westin et al. (2000) Westin, J., Sneden, C., Gustafsson, B., & Cowan, J. J. 2000, ApJ, 530, 783
- Yong et al. (2003) Yong, D., Grundahl, F., Lambert, D. L., Nissen, P. E., & Shetrone, M. D. 2003, A&A, 402, 985
- Zhao & Magain (1990) Zhao, G. & Magain, P. 1990, A&A, 238, 242
- Zinn & West (1984) Zinn, R. & West, M. J. 1984, ApJS, 55, 45
- Zoccali et al. (1999) Zoccali, M., Cassisi, S., Piotto, G., Bono, G., & Salaris, M. 1999, ApJ, 518, L49