Chandra Observations of the Interacting Galaxies NGC 3395/3396 (Arp 270)
Abstract
In this paper we present the results of a 20 ks high resolution Chandra X-ray observation of the peculiar galaxy pair NGC 3395/3396, a system at a very early stage of merging, and less evolved than the famous Antennae and Mice merging systems. Previously unpublished ROSAT HRI data are also presented. The point source population and the hot diffuse gas in this system are investigated, and compared with other merging galaxy pairs.
16 X-ray point sources are detected in Arp 270, 7 of which are classified as ULXs ( erg s-1). From spectral fits and the age of the system it seems likely that these are predominantly high mass X-ray binaries. The diffuse gas emits at a global temperature of 0.5 keV, consistent with temperatures observed in other interacting systems, and we see no evidence of the starburst-driven hot gaseous outflows seen in more evolved systems such as The Mice and The Antennae. It is likely that these features are absent from Arp 270 as the gas has had insufficient time to break out of the galaxy disks. 32% of the luminosity of Arp 270 arises from the diffuse gas in the system, this is low when compared to later stage merging systems and gives further credence that this is an early stage merger.
Comparing the ULX population of Arp 270 to other merging systems, we derive a relationship between the star formation rate of the system, indicated by , and the number () and luminosity () of its ULX population. We find and . These relationships, coupled with the relation of the point source X-ray luminosity () to and (Colbert et al., 2003), indicate that the ULX sources in an interacting system have contributions from both the old and young stellar populations.
keywords:
galaxies: evolution - galaxies: individual: NGC 3395 - galaxies: individual: NGC 3396 - galaxies: interactions - X-rays: galaxies1 Introduction
It is widely believed some of the most dominant mechanisms in galaxy evolution are galaxy collisions and mergers, and that there are very few galaxies that have not been shaped or created through an interaction or merger with another galaxy. As a consequence it could be stated that the formation of many elliptical galaxies is the product of the merger of two spiral galaxies. This was first proposed by Toomre in 1977, illustrated by the ‘Toomre’ sequence (Toomre, 1977). This shows 11 examples from the New General Catalogue (NGC) of Nebulae and Clusters of Stars, from approaching disk systems to near-elliptical remnants. The systems within this sequence have been well studied over a range of wavelengths, including X-ray. Initial observations in X-ray were carried out with the Einstein Observatory, giving limited spatial resolution, these were later followed by observations with improved sensitivity from ROSAT. With the advent of the X-ray satellite Chandra (Weisskopf et al., 2000), these systems and other interacting galaxies have been studied in much greater detail.
With greater resolution the X-ray properties of local galaxies can now be determined, and the nature of the point sources in these systems established. Recent studies of starburst and merging galaxies have included M82 (Kaaret et al., 2001), NGC 253 (Strickland et al., 2000), NGC 3256 (Lira et al., 2002), NGC 4485 /4490 (Roberts et al., 2002), The Mice (Read, 2003), and The Antennae (Fabbiano et al., 2001). In these papers each system is found to have a population of luminous point sources and the components of sub-structure in the diffuse emission have been resolved. Most of these papers deal with the spectral analysis of the point source population and the diffuse gas, allowing a comparison of the system properties with the evolutionary stage it is in.
This paper reports a study of the galaxy pair NGC 3395/3396, which appear in Arp’s Atlas of Peculiar Galaxies (Arp, 1966) as Arp 270 (Also VV 246; Vorontsov-Velyaminov (1959)). At a distance of 28 Mpc (assuming = 75 km s-1 Mpc-1, and accounting for Virgocentric in-fall) the galaxies have a separation of just 12kpc and, from a multicolour broad band photometric study, it has been shown that they are of comparable mass (Hernández-Toledo & Puerari, 2001), NGC 3395, to the west, is classified as a Sc galaxy, and NGC 3396, to the east, as an Irr. From N-body simulations (Clemens et al., 1999) it has been shown that Arp 270 is within 5107 years of its second perigalactic passage, the first occurring approximately 5108 years ago. Further evidence indicating that the two galaxies have interacted previously is the HI tail extending from the south-east of the galaxy (Clemens et al., 1999), although no optical tidal tails have been observed. This places the system at an earlier stage of evolution than the 11 examples given by Toomre (1977).
In this paper we present previous X-ray observations of Arp 270, including previously unpublished results from the ROSAT HRI observation which are described in §2. The Chandra observations and data analysis techniques are detailed in §3. A full discussion of these results is presented in §4. along with multi-wavelength comparisons. Comparisons of the X-ray properties of Arp 270 with other prominent starburst and merging systems are drawn and discussed in §4 and §5. Conclusions and summary are given in §5.
2 Previous X-ray Observations
Arp 270 was initially observed in X-rays with the Einstein IPC (Fabbiano et al., 1992). The image showed very little structure, however, and what there was appeared to be centred on NGC 3395, with suggestions of extensions to the northwest and southwest of the system.
The ROSAT PSPC observations, described in Read & Ponman (1998) (hereafter RP98), showed much more structure. Emission was seen from both galaxies, and this appeared to lie within more extended, diffuse gas. A point source was detected at the nucleus of NGC 3395, while the central point source in NGC 3396 was seen, not at the nucleus, but at a position closer to the companion galaxy. Tentative evidence was also seen for complex emission in the overlapping regions of the two disks, where there also appeared to be quite a good correlation between the X-ray emission and the radio emission of Huang et al. (1994), with both an X-ray and a radio bridge visible between the two galaxies. Not very much could be said as regards the spectral properties of the emission, except that the sources appeared to be best fitted with plasma models, suggestive of the emission from both regions being caused primarily by hot gas, rather than evolved stellar components. The remaining unresolved emission appeared to be contaminated with point source emission. However, a two-component fit did provide some evidence for the existence of low-temperature gas.
Arp 270 was also observed with the ROSAT HRI. These previously unpublished results are presented here, as they provide a useful introduction to the X-ray structure of the system, and bridge the gap between the (relatively) low-resolution of the ROSAT PSPC and the higher resolution of Chandra.
The ROSAT HRI data (ID 600771), covering 24.9 ks and taken in May of 1995, were initially screened for good time intervals longer than 10 s. No further low background selection was made, as we were mainly interested in point sources (which the HRI is far better suited to), and for this purpose the data were still photon-limited. Source detection and position determination was then performed over the full field of view with the EXSAS local detect, map detect and maximum likelihood algorithms (Zimmermann, 1994), using images of pixel size 5′′.
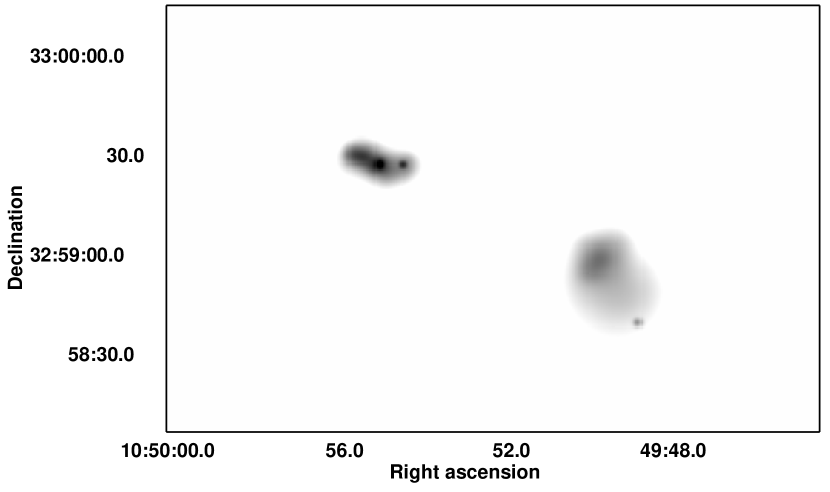
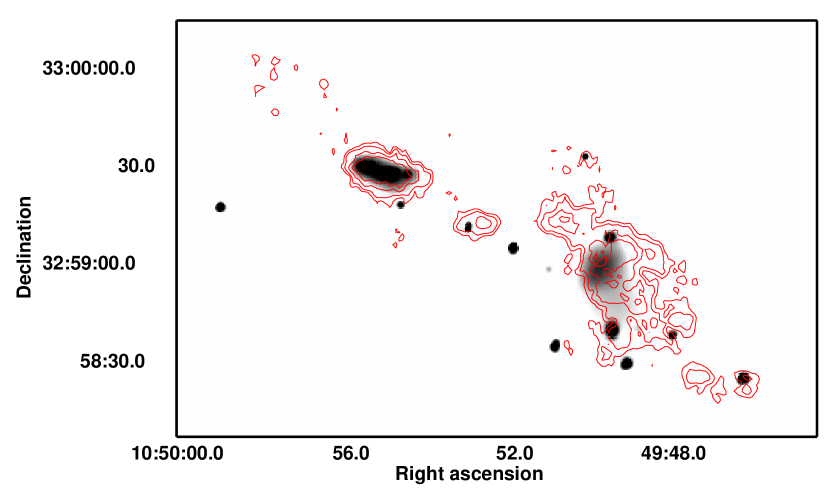
Figure 1 shows smoothed contours of the ROSAT HRI emission from Arp 270 over the full HRI channel range, superimposed on an optical Digital Sky Survey (DSS) image. Sources were formally detected at the positions of the two galaxies, embedded in regions of spatially complex emission (most especially within NGC 3395). Two other interesting sources were detected; a dim source at the southwestern tip of NGC 3395, and a bright source to the northwest of the galaxies.
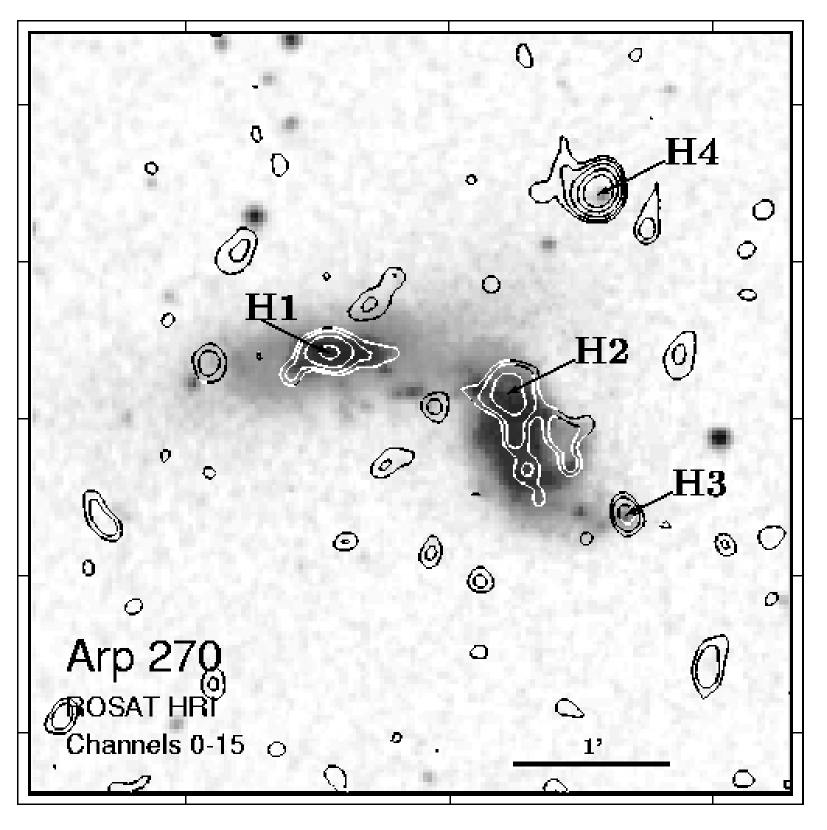
The ROSAT HRI properties of these sources are summarised in Table 1 as follows: Source number column (1; prefixed by H, for HRI), corrected right ascension and declination columns (2) and (3), error on the source position column (4), and likelihood of existence column (5). Probabilities P are related to maximum likelihood values L by the relation , thus a likelihood L of 10 corresponds to a Gaussian significance of 4.0 (Zimmermann, 1994). Also given are the net broad band counts and error column (6), and count rates and errors after applying deadtime and vignetting corrections column (7). The likelihood of the source being extended and the associated extent are given in columns (8) and (9). Note here that H1 (associated with NGC 3396) and especially H2 (NGC 3395) appear extended, whereas H3, to the SW of NGC 3395, and the bright H4 to the NW of the system appear point-like.
| Src. | RA | Dec | Pos.err. | Lik. | Count(err) | Ct.rate | Lik.(ext) | extent |
|---|---|---|---|---|---|---|---|---|
| (2000.0) | (arcsec) | (ks-1) | (arcsec) | |||||
| H1 | 10 49 55.65 | +32 59 25.8 | 1.6 | 22.0 | 29.476.5 | 1.200.26 | 3.8 | 3.3 |
| H2 | 10 49 50.16 | +32 59 09.6 | 2.0 | 10.9 | 32.087.2 | 1.300.29 | 9.0 | 4.9 |
| H3 | 10 49 46.64 | +32 58 23.4 | 1.3 | 13.6 | 13.014.2 | 0.530.17 | 0.0 | - |
| H4 | 10 49 47.50 | +33 00 27.0 | 0.6 | 115.9 | 62.628.4 | 2.550.34 | 0.7 | - |
3 Chandra Observations and Data Analysis
Arp 270 was observed using the ACIS-S camera on board the Chandra X-ray Observatory in two separate pointings on 28th April 2001 and 23rd October 2001 with a total observation time of 22.5 ks. The initial data processing to correct for the motion of the spacecraft and apply instrument calibration was carried out with the Standard Data Processing (SDP) at the Chandra X-ray Center (CXC). The data products were then analysed using the CXC CIAO software suite (v2.3)111http://asc.harvard.edu/ciao and HEASOFT (v5.2). The data were reprocessed, screened for bad pixels, and time filtered to remove periods of high background (when counts deviated by more than 5 above the mean). This resulted in a corrected exposure time of 20 ks, 6.2 ks in the first pointing and 13.8 ks in the second.
3.1 Overall X-ray Structure
A 0.38 keV (from here on referred to as ‘full band’) Chandra image was created from the cleaned events file and adaptively smoothed using the CIAO task csmooth which uses a smoothing kernel to preserve an approximately constant signal to noise ratio across the image, which was constrained to be between 2.4 and 4. Figure 2 shows an optical image of the interacting galaxies from the Palomar 5m telescope with the full band X-ray contours overlaid. From this image it can be seen that the galaxies are resolved into two components. NGC 3395 shows diffuse gas throughout the optical confines of the galaxy, with numerous point sources, while NGC 3396 appears to be more centrally concentrated, with evidence of some structure in the centre of the galaxy. An X-ray bridge is present in the data, and there is evidence of point sources between the galaxies where the disks have started to interact, as was suggested by the HRI data.
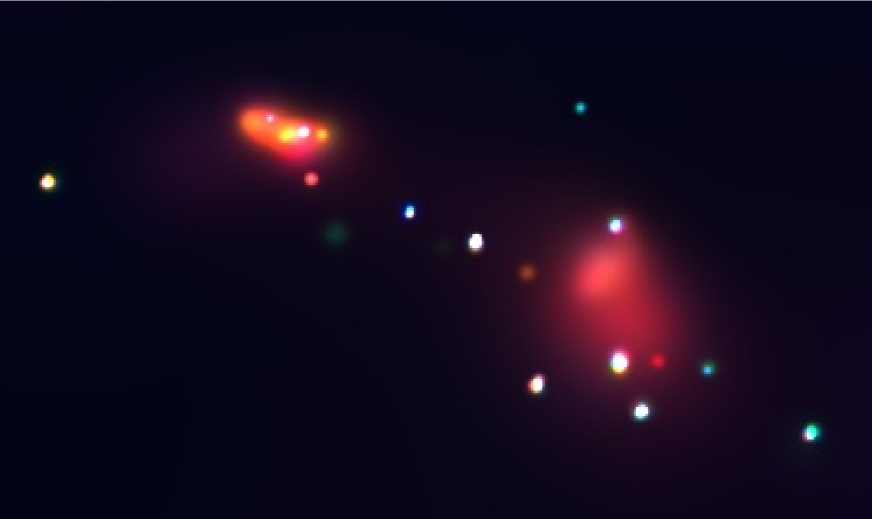
Figure 3 shows a true colour image of the system. Red corresponds to 0.30.8 keV, Green 0.82.0 keV and Blue 2.08.0 keV, hereafter referred to as soft, medium and hard respectively. The images for all three bands were created in the same way as described above, using the same set of smoothing scales for each image. These three images were then combined to create a colour image. The image shows that point-like sources tend to have harder spectra than the diffuse emission; those appearing white imply emission in all three energy bands. Blue and green sources very often indicate heavy X-ray absorption. NGC 3395 shows a diffuse nucleus whilst NGC 3396 has some hard point sources at the nucleus, surrounded by diffuse gas.
3.2 The Discrete Source Population
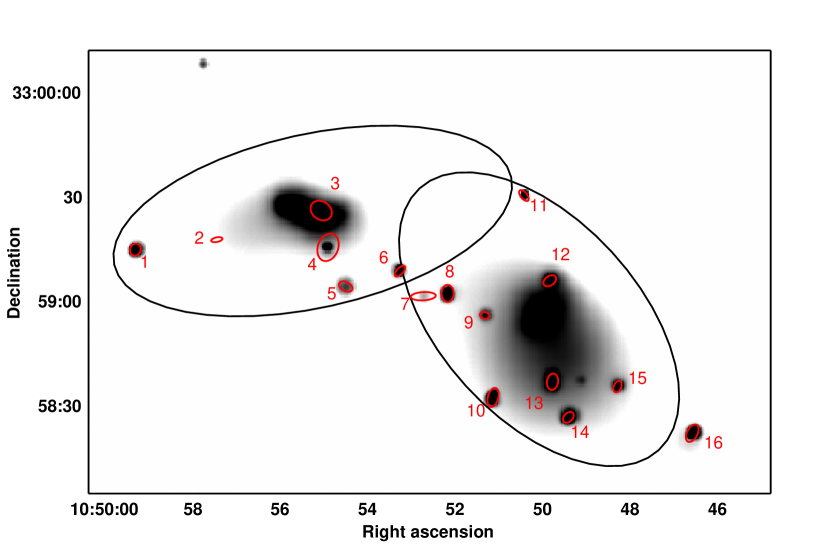
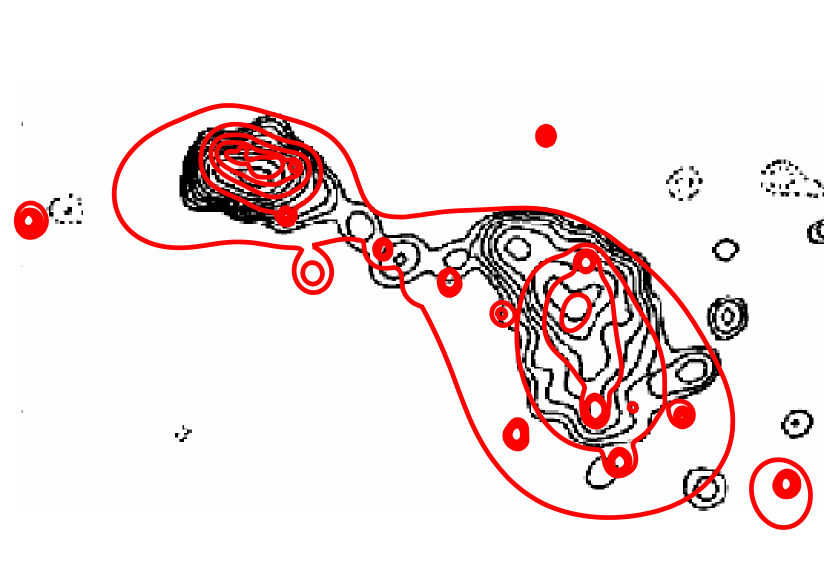
Discrete X-ray sources were detected using the CIAO tool wavdetect. This was run on the full, soft, medium and hard band images, and over the 2, 4, 8, 16 pixel wavelet scales (where pixel width is 0.5′′), with a significance threshold of , which corresponds to one spurious source over a 800 800 pixel grid, the size of our image. 27 sources were detected in the full band energy range. We then limited our sources to those that are within the ellipses of the galaxies, where these values were obtained from LEDA222http://leda.univ-lyon1.fr/. Although one of the sources detected (specifically source 16) is seen to lie outside of the ellipses, it is thought to be associated with an optical and radio counterpart within the galaxies, and has therefore been included in the subsequent analysis. The detected sources and the ellipses overlaid on the full band X-ray image are shown in Figure 4, and the sources are listed in Table 2. In this table, column (1) gives the source identification number given in this paper, columns (2) and (3) give the R.A and Dec. (J2000), column (4) the radius of each source region file and column (5) the count rate for the whole observation, where an M indicates wavdetect only detected a source in the medium band. Columns (6) and (7) indicate the count rate detected by wavdetect for observations 1 and 2 and columns (8) and (9) give the count rate found using aperture photometry. This was calculated by creating a region with a radius of 1′′ at the position of the source and a background region file of a source free annulus. The number of counts were found, which were then converted into count rates, and a background count rate correction was applied. Of the sixteen sources coincident with the galaxy, we would expect a fraction of these to be background objects. Using the Chandra Deep Field South number counts (Giacconi et al., 2001), we estimate the level of contamination in both the soft (0.32.0 keV) and hard (2.08.0 keV) bands. For an area comparable to the D25 ellipses of the galaxies (4.7 square arcminutes), an estimate of 0.45 sources in the soft band (for a flux threshold of 2.210-15erg s-1) is calculated. In the hard band (with a flux threshold of 7.710-15erg s-1) 0.41 background sources are estimated. This corresponds to a source contamination of 3% in the soft band and 5% in the hard band.
| Source No. | R.A | Declination | Source | Net Count Rate (count s ) | ||||
|---|---|---|---|---|---|---|---|---|
| Radius | Wavdetect | Aperture Photometry | ||||||
| arcsec | Total Observation | Obs 1 | Obs 2 | Obs 1 | Obs 2 | |||
| 1 | 10 49 59.35 | +32 59 16.5 | 4.9 | 2.16 0.34 | - | 2.70 0.45 | 0.37 0.28 | 2.58 0.44 |
| 2 | 10 49 57.50 | +32 59 19.5 | 5.4 | 0.24 0.11M | 0.77 0.36 | - | 0.79 0.36 | - |
| 3 | 10 49 55.11 | +32 59 27.7 | 3.0 | 1.67 0.35 | - | 1.77 0.43 | 1.09 0.46 | 0.91 0.29 |
| 4 | 10 49 54.93 | +32 59 17.3 | 4.4 | 0.98 0.26 | - | 0.90 0.30 | 0.37 0.28 | 0.52 0.21 |
| 5 | 10 49 54.54 | +32 59 06.0 | 3.9 | 0.43 0.17 | - | - | 0.30 0.23 | 0.48 0.19 |
| 6 | 10 49 53.28 | +32 59 10.2 | 3.4 | 1.58 0.30 | - | 1.96 0.39 | 0.42 0.28 | 1.75 0.36 |
| 7 | 10 49 52.86 | +32 59 03.3 | 3.9 | 0.40 0.15M | - | - | - | 0.47 0.19 |
| 8 | 10 49 52.21 | +32 59 04.1 | 5.9 | 4.61 0.49 | 5.33 0.94 | 4.29 0.57 | 3.68 0.80 | 3.43 0.51 |
| 9 | 10 49 51.35 | +32 58 57.7 | 4.4 | 0.27 0.12M | - | - | 0.26 0.23 | 0.41 0.17 |
| 10 | 10 49 51.15 | +32 58 34.1 | 4.4 | 2.80 0.39 | 4.05 0.82 | 2.25 0.43 | 3.46 0.75 | 1.63 0.36 |
| 11 | 10 49 50.45 | +32 59 32.1 | 4.9 | 0.52 0.17 | - | 0.71 0.24 | - | 0.70 0.23 |
| 12 | 10 49 49.85 | +32 59 07.8 | 5.4 | 2.20 0.36 | 1.51 0.56 | 2.41 0.45 | 0.61 0.37 | 2.16 0.40 |
| 13 | 10 49 49.79 | +32 58 38.7 | 4.9 | 5.84 0.56 | 2.73 0.68 | 7.31 0.76 | 2.54 0.65 | 4.82 0.61 |
| 14 | 10 49 49.43 | +32 58 28.4 | 4.9 | 3.13 0.41 | 4.40 0.85 | 2.59 0.45 | 3.97 0.80 | 1.92 0.38 |
| 15 | 10 49 48.30 | +32 58 37.3 | 7.4 | 0.64 0.20 | 1.65 0.53 | - | 1.40 0.48 | 0.22 0.15 |
| 16 | 10 49 46.60 | +32 58 23.7 | 7.4 | 2.55 0.37 | 4.27 0.84 | 1.83 0.39 | 3.99 0.81 | 1.03 0.29 |
3.3 Spectral Analysis
Spectra for the 16 detected sources were extracted from the source region files created by wavdetect. The size of each region was selected to ensure that as many source photons as possible were detected whilst minimising contamination from nearby sources and background (see source radii in Table 2). The background files were defined as a source free annulus surrounding and concentric with each source region file, to account for the variation of diffuse emission, and to minimise effects related to the spatial variation of the CCD response. Source spectra were created from both observations, using the CIAO tool psextract. For each source, the two spectra were fitted simultaneously in XSPEC, tying together all the parameters, apart from the normalisations.
Due to the short exposure time of our observations the source region spectra have a maximum of 200 counts. Below 50 counts, a power law model with Galactic absorption column density along the line of sight = 1.98 atom cm-2), 333calculated from nh in FTOOLS and photon index = 1.5 was assumed. Due to the low number of counts the Cash statistic (Cash, 1979) was used in preference to when modelling the data. This was performed in XSPEC (v11.2.0) for all 16 sources, using simple one component models: absorbed power-law or absorbed MEKAL. The data were restricted to 0.36.0 keV as energies below this have calibration uncertainties, and the spectra presented here do not have significant source flux above 6 keV. Before the data were fitted, a correction was applied to the auxiliary response file, to compensate for the continuous degradation in the low energy ACIS QE,444http://cxc.harvard.edu/ciao/why/acisqedeg.html using the CIAO tool corrarf. This degradation effect is thought to be caused by the deposition of material on the ACIS detectors or the cold optical blocking filters. It is most prevalent at low energies and with the continuous build up of contamination the effective low energy QE reduces with time. The best fit models were determined by calculating the Cash statistic. These fits can be seen in Table 3; column (1) gives the source number, column (2) the model used, column (3) the best fit value of , column (4) or , and columns (5) and (6) the values for the X-ray emitted and intrinsic (i.e. corrected for absorption) luminosities. Where statistics were too poor to constrain a multi-parameter model, the assumed power law model described previously was fitted in XSPEC, with all model parameters except the normalisation frozen, this is indicated by an F in the table. A (0.36.0 keV) flux was then calculated from this fit.
| Source No. | Spectral Fit | Luminosity (0.38.0 keV) | |||
|---|---|---|---|---|---|
| Model | (1039 erg s-1) | ||||
| ( atom cm-2) | (keV) | Observed | Intrinsic | ||
| 1 | wabs*mekal | 20 | 2.25 | 0.65 | 0.97 |
| 2 | wabs*power | 2 F | 1.5 F | 0.20 | 0.20 |
| 3 | wabs*power | 0 | 0.68 | 1.27 | 1.27 |
| 4 | wabs*mekal | 15 | 0.24 | 0.15 | 0.44 |
| 5 | wabs*power | 2 F | 1.5 F | 0.15 | 0.15 |
| 6 | wabs*power | 2 F | 1.5 F | 0.48 | 0.55 |
| 7 | wabs*power | 2 F | 1.5 F | 0.21 | 0.22 |
| 8 | wabs*power | 24 | 1.66 | 2.09 | 2.94 |
| 9 | wabs*power | 2 F | 1.5 F | 0.10 | 0.11 |
| 10 | wabs*power | 54 | 2.29 | 1.39 | 3.35 |
| 11 | wabs*power | 2 F | 1.5 F | 0.22 | 0.23 |
| 12 | wabs*power | 16 | 1.38 | 1.18 | 1.44 |
| 13 | wabs*power | 41 | 1.88 | 1.92 | 3.37 |
| 14 | wabs*power | 20 | 1.41 | 1.30 | 1.65 |
| 15 | wabs*power | 32 | 1.02 | 0.41 | 0.50 |
| 16 | wabs*power | 56 | 1.87 | 1.41 | 2.59 |
3.4 Diffuse Emission
From the smoothed image it is clear that there is some sub-structure in the diffuse gas components of both NGC 3395 and NGC 3396. Once the point sources had been identified by wavdetect they could be removed from the data so that the diffuse emission could be seen more clearly. We interpolated over the holes in the data using the CIAO tool dmfilth,555http://cxc.harvard.edu/ciao/threads/diffuse_emission and then smoothed using the method described previously. In Figure 5, it can be seen that there is an additional point source in NGC 3395 in the south-west of the galaxy, and the diffuse gas is more prevalent to the north-east. NGC 3396 has a more complex structure in the centre of the galaxy, with the gas elongated in the east-west direction. There also appear to be sources not formally detected by the source-searching software.


We next investigated the X-ray spectra for the diffuse emission, where the point sources identified in section 3.2 were excluded in the region files created for each galaxy. The spectra for the two galaxies were extracted using the CIAO tool psextract as described previously. Again, the low energy degradation correction, corrarf, was applied. These data were then fitted in XSPEC using an absorbed MEKAL model, with all the parameters tied apart from the normalisation (see Figure 6). Best fit values taken from XSPEC are shown in Table 4. Metallicities were found to be 0.07 for NGC 3395 and 0.05 for NGC 3396, but due to the multi-temperature nature of the gas, it is likely that these very subsolar abundances arise from fitting a single-temperature model (Buote & Fabian, 1998) and are not a true measure of the metallicity of the galaxies. The absorption column of NGC 3395 was found to be 4 atom cm-2, which is consistent with galactic absorption of 2 atom cm-2. The absorption column of NGC 3396 was measured to be 9 atom cm-2. This excess absorption is not unexpected as NGC 3396 contains both HI (Clemens et al., 1999) and molecular gas (Smith & Struck, 2001; Zhu et al., 1999) and is a more compact galaxy than NGC 3395 and, as can be seen from the HI observations (Clemens et al., 1999), is highly inclined to the line of sight.
| Galaxy | Luminosity | ||||
| ( atom cm | keV | (1039 erg s-1) | |||
| Observed | Intrinsic | ||||
| NGC 3395 | 4 | 0.52 | 0.07 | 3.50 0.12 | 4.64 0.16 |
| NGC 3396 | 9 | 0.49 | 0.05 | 2.86 0.14 | 4.87 0.24 |
3.5 X-ray Variability
Our observation was taken in two separate pointings, 6 months apart. Because of this we are able to examine the variability within the system. Sources have been defined to be variable if the difference in count rates, given in columns (8) and (9) of Table 2, is greater than the 2 count rate error for the two observations,
| (1) |
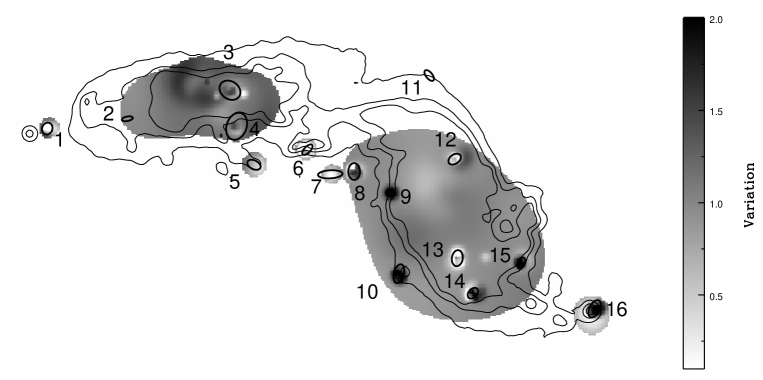
Sources which have been found to vary are 1, 6, 10, 13, 14, 15 and 16, of which sources 10, 13, 14 and 16 are classed as Ultraluminous X-ray Sources (ULX’s), with erg s-1. A variability map has been created so that the locations of the variable sources can be more readily identified (Figure 7). The map was created by taking a ratio of the two observations, the darker features on the map indicate a higher flux in the first observation. This map is a useful tool in highlighting any regions of unresolved point sources. In NGC 3395 a point-like feature can be seen to the west of point source 13. This feature appears lighter than the diffuse gas indicating that there was a greater flux during the second observation. NGC 3396 shows substructure in the centre of the galaxy, with some darker and lighter features indicating that there are point sources not detected by the source-searching algorithms.
4 Discussion
4.1 Source Population
The Chandra ACIS-S has spatial resolution (FWHM) of 0.5′′, and given the distance to Arp 270 of 28 Mpc, one can resolve point sources separated by 70 pc. This has enabled more point sources to be detected than were previously found with the ROSAT HRI, as can be seen by comparing Table 1 with Table 2. Of the four sources detected by the HRI, sources H1 and H3 correspond to source 3 and source 16 in the Chandra data, source H2 lies within 2′′ of source 12, and source H4 was not included in the Chandra data presented here, although it was detected, as it lies 1′ outside the D25 ellipses.
4.1.1 Spectral trends
From Table 3, it can be seen that there is a wide range of spectral parameters within the source population of Arp 270. It is useful to investigate the spectral distribution of the point sources to establish if there are any spectral trends, or if the variable sources have different properties from the other sources. In Figure 10 the intrinsic luminosity is plotted against the best fit value of . Figure 10 plots intrinsic luminosity against the best fit power law index (), and Figure 10 shows against . In these three figures only 8 of the 16 detected sources have been plotted. Of the eight omitted sources, six have low counts, such that the model parameters cannot be well constrained, and the remaining two sources are best fitted with a MEKAL model. The 8 sources that have been plotted have reliable error bounds for , and intrinsic luminosity.


Trends were identified using the Kendall’s rank coefficient which corresponds to a correlation significance in units of Gaussian sigma. Applying this test finds no strong correlation between the properties of the point sources and their variability. However, there does appear to be a weak trend for sources with higher values of to show variability. This could be due to sources with higher values of being close to the galactic plane, indicating that they are likely to be young objects and as such we would expect to see more variability. Alternatively, it could be that this absorption is intrinsic and variable, leading to an observed change in luminosity for these sources. The plot of X-ray luminosity against (Figure 10) shows no correlation between the intrinsic luminosity and the amount of absorption, but there does appear to be a trend (1.48) for more luminous sources to have softer spectra (Figure 10). Also, there is a clear correlation of 2.23 between the photon index and the amount of absorption. This trend is primarily driven by a population of XRBs, which have both a high absorbing column and a soft X-ray spectrum (Figure 10), indicating that they could be black hole binaries (BHBs). Even though these sources show a tendency for increasing softness with luminosity, their spectra would still classify them as sources in a low/hard state. This state is characterised by power law spectral indices in the range 1.5 2.0, and an accretion rate at a low fraction of the Eddington luminosity of the compact object (Tanaka & Lewin, 1995; White et al., 1995). But, this definition would require objects with a mass of 10400 for the luminosities we have observed. This would range from a stellar-mass black hole (320 ) to an intermediate-mass black hole (IMBH; ) (Miller & Colbert, 2003). However, it has recently been suggested that the states of BHBs cannot be defined by their luminosity (McClintock & Remillard, 2003) as it is now clear that the spectral hardness of a BHB is not a direct function of mass accretion rate (Homan et al., 2001). In fact, giving support to this, high luminosity, spectrally hard sources have been detected in NGC 4485/4490 (Roberts et al., 2002) and the transition from a low/soft spectral state to a high/hard one has been observed in some ULXs in The Antennae (Fabbiano et al., 2003), the ULX in NGC 7714 (Soria & Motch, 2004) and the ULX in Holmberg II X-1 (Dewangan et al., 2004). Many of the discrete sources in Arp 270 have high values of , indicating that they could lie within, either a gas rich environment, or in close proximity to the galactic plane. Given the location of these sources, it seems likely that they were triggered in the last episode of star formation. Therefore, we feel it is probable that the sources we have identified are high mass X-ray binaries (HMXRBs), due to both the nature of the individual sources and the system they lie within.


Out of the sixteen sources detected by wavdetect, seven exceed the Eddington limit for a 7 star of 1 erg s-1 and are therefore classified as ULX sources. The spatial resolution of these sources has been investigated to see if there is any evidence of extension. This was done by creating radial profiles of each source, generating PSF models with the CIAO tool mkspf, and comparing in ChIPS. From this it can be concluded that all of the 16 sources are point-like.
4.1.2 The relationship between ULXs and
In a recent paper by Swartz et al. (2004), over 80 galaxies imaged by Chandra were analysed for ULXs. From their analysis a correlation between the far infrared luminosity (), an indicator for star formation, and ULXs in interacting galaxies was found. There is also evidence that the number of ULXs () and the level of significantly increases with merging and interacting galaxies. To investigate this correlation we have compared Arp 270 to four other interacting galaxy pairs (Table 5). These pairs were selected such that they have been studied with Chandra (Fabbiano et al., 2001; Lira et al., 2002; Roberts et al., 2002; Read, 2003) and that the two galaxies are in a pre-merger stage. We attempt to compare systems comparable to Arp 270, although we note that one of the systems, NGC 4485/90, has a mass ratio of 1:4.4,666Taken from the Two Micron All Sky Survey (2MASS); http://irsa.ipac.caltech.edu/Missions/2mass.html not 1:1 as the other systems have. Out of the four systems, three are thought to be at more advanced stages of merging than Arp 270; The Mice (Read, 2003), The Antennae (Fabbiano et al., 2001) and NGC 3256 (Lira et al., 2002). Comparison of N-body simulations of NGC 4485/90 (Elmegreen et al., 1998) with Arp 270 suggests that NGC 4485/90 is at an earlier stage of evolution than Arp 270.
| Galaxy | No of ULXs | Log | / | Mass Ratio | Mass Ratio Reference | Type |
|---|---|---|---|---|---|---|
| System | (erg s-1) | |||||
| NGC 4485/90 | 6 | 43.19 | 0.55 | 1:4.4β | 2MASS | 1st Approach |
| Arp 270 | 7 | 43.63 | 0.81 | 1:1.3γ | Hernández-Toledo & Puerari (2001) | 2nd Approach |
| The Mice | 5a | 44.12 | 1.13 | 1:1.3β | Gavazzi & Boselli (1996) | Disks Colliding |
| The Antennae | 9 | 43.95 | 0.94 | 1:1.05γ | Lauberts & Valentijn (1989) | Disks Colliding |
| NGC 3256 | 14 | 45.19 | 5.83 | f | - | Near nuclear coalescence |
Notes: βCalculated from the R band magnitudes, γ calculated from the K band magnitudes. f individual luminosities for the two galaxies cannot be determined but from the N-body simulations of the system (English et al., 2003) and the existence of the long tidal tails it is likely that this is the product of a near-equal-mass-merger.
The correlation between and is investigated in Table 5, along with a measure for star formation activity, / and the merger status of each system. Column (1) gives the system name, column (2) detected in that system, column (3) Log , (4) /, column (5) the mass ratio and column (6) the status of the system. The FIR luminosities are calculated using the expression (Devereux & Eales, 1989)
| (2) |
with IRAS 60- and 100-m fluxes taken from the IRAS Point Source Catalogue (Moshir, 1990). The optical (B) luminosities were calculated as in Tully (1988)
| (3) |
where is the blue apparent magnitude and is the distance in Mpc. Values of blue apparent magnitude were taken from de Vaucouleurs et al. (1991) (the value for The Mice was taken from NGC 2000.0 (Dreyer, 1988)). From this table it can be seen that / correlates with the stage of evolution that the system is thought to be in, with NGC 4485/90 and Arp 270 having lower values of / than The Mice and The Antennae, which in turn have a lower value of / than NGC 3256.
We find a weak correlation when we compare and per galaxy (0.94); from Figure 11 it can be seen that The Mice is an outlier from this trend. However it is quite feasible that the smaller number of ULXs detected in The Mice is caused by the higher source detection limit of erg s-1 for this observation (Read, 2003). To extrapolate to erg s-1 for The Mice, we used the universal luminosity function derived by Grimm et al. (2003). When this value is used to compare and per galaxy (Figure 11) a stronger correlation of 1.96 is found. Plotting log against log gives a slope of 0.180.13 (excluding NGC 4485/90 from this fit we find a slope of 0.180.11 with a correlation of 1.36). We also found a correlation (1.96) between the luminosity of the ULXs () and , the value of for The Mice was again extrapolated from the universal LF of Grimm et al. (2003). Fitting log against log gives a slope of 0.540.04 (This changes to a slope of 0.57 with a correlation of 2.04 when excluding NGC 4485/90)(Figure 11). Read & Ponman (2001) found the total point source X-ray luminosity for a sample of both normal and starburst galaxies to be correlated with with a slope of (0.660.09), which is in agreement, within errors, with our fit. In Colbert et al. (2003) an expression to estimate the point source X-ray luminosity () was derived.
| (4) |
is made up of contributions from both old and young stellar populations, which correlate with the K-band and FIR+UV luminosities respectively. These correlations motivate the relation derived in Colbert et al. (2003). The contribution from the old population contains some lower luminosity ULXs (Jeltema et al., 2003) while the young population, connected with SFR, contains the most luminous ULXs (Colbert et al., 2003; Swartz et al., 2004; Wolter & Trinchieri, 2004). Our results give further credence to this finding, with our against fit having a steeper slope than our against fit, indicating that the systems with higher contain more luminous ULXs. This suggests that ULXs are a heterogeneous class, made up from a contribution of old and young stellar populations.
4.1.3 Correlation with UV emission
Immler et al. (2003), in a study of the late-type spiral galaxy NGC 1637, have observed that 15% of X-ray point sources in this system are associated with young globular clusters, or star forming knots. Further associations between luminous X-ray point sources and optical counterparts have also been observed in starburst and interacting galaxies, as well as in late-type spirals (Kaaret et al., 2004; Liu et al., 2004; Smith et al., 2004; Soria et al., 2005). The central regions of both galaxies in Arp 270 are shown in Figure 12 where STIS (Space Telescope Imaging Spectrograph) far UV images from the Hubble Space Telescope (Hancock et al., 2003) are shown with X-ray contour overlays of the Chandra full band emission for both NGC 3395 and NGC 3396. The X-ray contours for both galaxies were created from smoothed images, with lower values of smoothing than were previously used. This was done so that the features of both galaxies could be more clearly seen.
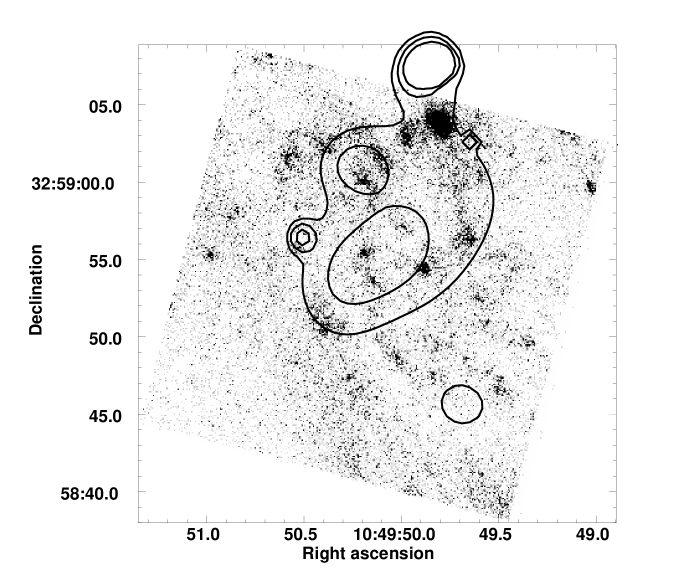
From Hancock et al. (2003), one gravitationally bound knot was identified in NGC 3395, and six in NGC 3396. The only formally identified X-ray source to have a UV counterpart is source 3 (see Figure 4 for source numbering), but as previously mentioned, both galaxies have substructure which is more clearly seen in Figure 12, due to the reduced smoothing. Even so, many of the knots are not detected in the X-ray, implying that they have luminosity below our threshold of 1.4 1038 erg s-1. X-ray sources with optical counterparts (from the APM Catalogue777http://www.ast.cam.ac.uk/apmcat/) were used to check the astrometry, the absolute X-ray source positions are accurate to better than 0.5′′. In NGC 3396 there are two X-ray sources that have been found to be offset from star forming knots in the UV data by 1.0′′ and 1.5′′. The second is source 3, while the first has not been formally identified by wavdetect (these can be seen in the bottom plot in Figure 12). These offsets correspond to displacements of 140 pc and 210 pc respectively. Given that there are 6 UV knots and 4 X-ray sources within 11.6 kpc2 (the area of the UV plate, which lies within the D25 ellipse of NGC 3396), the probability of finding one UV source within 140 pc of an X-ray source is 0.12, and the probability of finding two UV sources within 210 pc of X-ray sources is 0.10. This indicates that these associations are moderately unlikely to be chance near-alignments.
It may be that the offsets indicate that these sources are runaway binaries, HMXRBs that have been kicked out by an asymmetric explosion when the neutron star forms (Lyne & Lorimer, 1994). Taking the mass of both these knots as 2 (Hancock et al., 2003), and assuming that the kickout velocity is equal to the escape velocity for the knot, we calculate 60 km s-1 which corresponds to knot ages of 2.3 Myr and 3.5 Myr, respectively. Previous studies have found kickout velocities of 30100 km s-1 (Cordes & Chernoff, 1998; Fryer & Kalogera, 2001). Using these values we find the first knot to be between 1.5 Myr and 5 Myr and the second knot ranges from 2 Myr and 10 Myr in age. These ages are in agreement with the values found by Hancock et al. (2003), who find evidence for star forming knots as young as 5 Myr. The spectral hardness and luminosity of source 3, coupled with the source’s close proximity to the centre of the galaxy, suggests the possibility that it might be a low luminosity AGN. However, from Clemens et al. (1999) it can be seen that the dynamical centre of the galaxy is offset from this source by 3″, making this interpretation unlikely.
4.1.4 Correlation with and radio emission
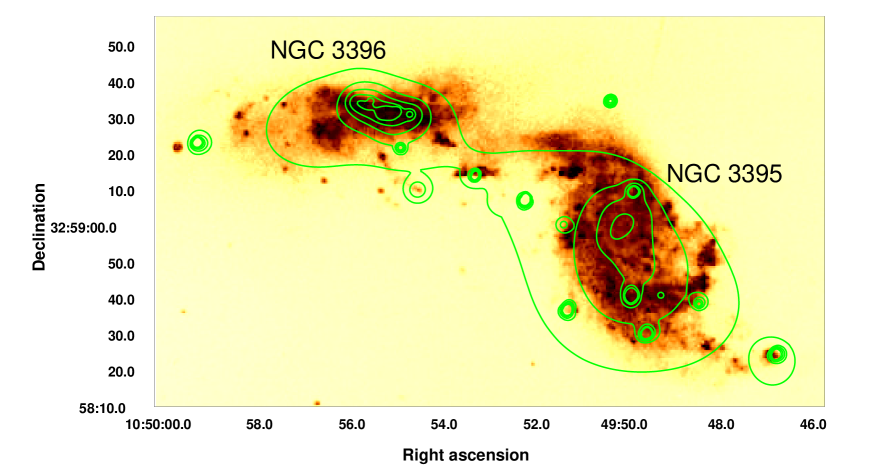
Figure 13 shows emission contours (Garrido et al., 2002) overlaid on the smoothed, full band, X-ray emission. It can be seen from this figure that the position and morphology of the emission closely follows the X-ray emission at the centres of the two galaxies, indicating that these are regions of active star formation. In particular, the good spatial correlation seen between several compact sources detected in both X-ray and are good indicators of the presence of rich associations of massive OB stars and therefore HMXRBs. One association of particular note is with source 6 (see Figure 4 for source numbering), which lies between the two galaxies. It is probable that star formation in this region is taking place now, as a direct consequence of the collision of the two disks of the galaxies. The emission from NGC 3395 is more diffuse than that in NGC 3396, which agrees well with the UV star forming knots for both galaxies. NGC 3395 has 66 identified knots (Hancock et al., 2003) but only one that is thought to be gravitationally bound and could therefore evolve into a globular cluster, whereas, NGC 3396 has 51 identified knots with 6 potential globular clusters. Consequently the emission will appear more diffuse in NGC 3395 as the regions of star formation are smaller and more dispersed than in NGC 3396.
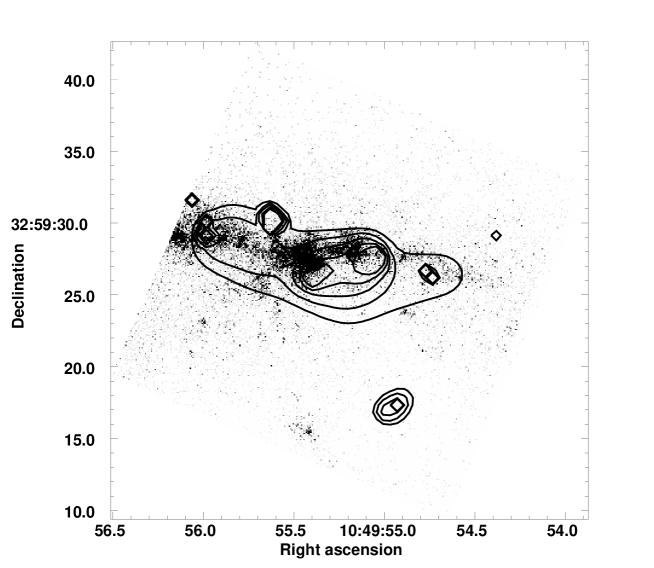
Further evidence of recent star formation in the centres of both galaxies is presented in the radio observation of the galaxy pair by Huang et al. (1994). Figure 14 shows 8415 MHz radio contours with full band X-ray contours overlaid. From this figure a radio continuum bridge between the two galaxies can be seen. This bridge has also been detected optically in the studies of Carpenter (1957), with the optical and radio emission in good agreement. The optical knots in the bridge suggest current or recent star formation and the radio emission appears stronger in these areas. From Figure 2, it can be seen that source 6, as mentioned above, is coincident with an area of optical emission at the centre of the bridge. It can also be seen that an X-ray source (source 5) to the south of NGC 3396 has an optical counterpart. The spectral model for this source was an assumed powerlaw due to the low number of counts. Although the model used indicates that the source could be an XRB, it is also possible that it could be a supernova. From Huang et al. (1994) it was found that the last episode of widespread star formation throughout the system took place 4107yr ago, which is greater than the timescale for massive stars to evolve into supernovae (1107yr). Two of the characteristics used to identify sources as XRBs are the displacement of a source from an optical counterpart and evidence of variability, neither of these are found with source 5. However, the absence of these characteristics does not imply that the source is a supernova, as kickouts do not always occur, and the low number of counts may account for the lack of variability observed. In fact, due to the poor statistics for this source it is impossible to rule out either scenario. Sources 5 and 6 are the only two X-ray sources that have optical counterparts and are external to the central regions of the two galaxies.
Comparing all the multi-wavelength observations it is clear that the centres of both galaxies are sites of vigorous star formation. It is also apparent that the disks of the two galaxies have recently collided, resulting in an active star forming region. It is likely that the bridge observed in both the optical and radio data has been formed by tidal interactions.
4.1.5 The luminosity function
Using the calculated intrinsic luminosity of each of the 16 sources, a luminosity function (LF) was constructed and fitted with Sherpa, using the polynom1d model.888http://cxc.harvard.edu/ciao/ahelp/polynom1d.html This power law fit of log against log , where is the cumulative number of sources above that luminosity, gives a poorly constrained value of slope (-0.64 ). After correcting for source incompleteness by excluding the lower luminosity sources from the fit, setting a conservative limiting value of log =38.4 for the cut-off luminosity, a slope of (-0.92) was attained. This luminosity threshold has been based on our detection threshold of 1.4 erg s-1 for sources external to the body of the galaxies. This value rises in diffuse gas and to allow for this variation a conservative luminosity threshold of 2.5 erg s-1 has been adopted. The cut-off luminosity fit was again poorly constrained and from visual inspection it is apparent that the data requires a broken power law model. However, the statistics of the LF are unable to constrain this fit. Grimm et al. (2003) proposed the existence of a universal luminosity function of HMXRBs, with a normalisation proportional to the star formation rate (SFR) of a galaxy, given by
| (5) |
where = erg s-1, SFR was calculated using the expression (Rosa-González et al., 2002)
| (6) |
From these expressions we find the Grimm et al. (2003) LF to have a slope of -0.71 for Arp 270. This theoretical LF is compared to the cumulative LF after correcting for source incompleteness in Figure 15. The solid line shows the fit to the data and the dot-dashed line indicates the Grimm et al. (2003) LF. Although the LF slopes are in agreement, within errors, the normalisation is lower for the theoretical line, indicating that galaxy SFR may not be a good normalisation factor for LFs. In fact, in Figure 11 we have shown that per galaxy is not directly proportional to , a measure of SFR.
Colbert et al. (2003) have found that LFs in merger and irregular galaxies have quite similar slopes to those in spiral galaxies, but that elliptical galaxies exhibit steeper slopes, finding a mean of -0.650.16 for the merger and irregular galaxies compared to -0.790.24 for spirals and -1.410.38 for ellipticals. In Table 7 all 3 values are consistent with a slope of -0.6, noting the large errors in the Arp 270 LF fit.

4.2 Diffuse Gas
As described in section 2 of this paper, Arp 270 has been observed in X-rays before. The most recent of these observations are detailed in RP98. From the ROSAT data, the total luminosity of Arp 270 was found to be 3.1 erg s-1 (0.12.0 keV), very similar to the findings of this paper, which gives a total luminosity of 3.0erg s-1 (0.36.0 keV). The difference in values can be attributed to the different energy ranges that have been used and the omission of the flux from a quasar in close proximity to Arp 270. This object was included in the ROSAT data but excluded from this study, as it lies 1′ outside the D25 ellipses. It was found in RP98 that 51% of the total emission was made up of diffuse gas, whereas the present analysis shows that only 32% of the total luminosity arises from diffuse gas. This result demonstrates the greater resolving power of Chandra to resolve out point sources from diffuse emission.
4.2.1 Temperature variation
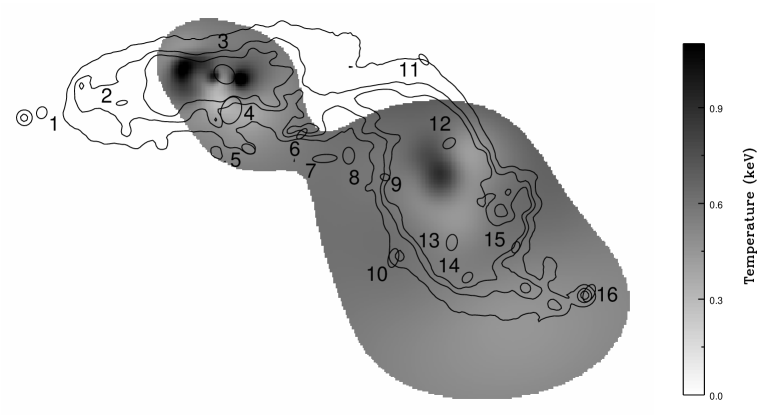
As mentioned above (§3.4), it is not realistic to assume that the diffuse gas has a single temperature. To investigate the spatial variation of temperature, a hardness map has been created as a proxy for temperature (Figure 16). This map was created by taking a ratio of the medium and soft bands of the adaptively smoothed diffuse gas, using the same set of smoothing scales, after background subtraction and point source removal. Features seen in NGC 3396 in the diffuse gas (Figure 5) and the variation map (Figure 7) are also observed to have counterparts in the hardness map. These sources of emission were not formally identified in wavdetect as point sources, but the evidence presented in this paper indicates that they are compact objects, as they all show variability on a six month timescale. The hardest such feature in NGC 3396 has a temperature in excess of 1.1 keV. The diffuse gas across the rest of the galaxy pair emits at 0.5 keV, consistent with diffuse gas temperatures from other merging systems (RP98), with hotter emission of 0.7 keV in the regions of most active star formation.
4.2.2 Physical properties of the diffuse gas
From the spectral fits of the diffuse gas, and some assumptions about the geometry of the emitting region, physical properties of the gas can be derived. Firstly the volume, , of the emitting region of each galaxy has been assumed to be an ellipsoid, with symmetry about the major-axis. The fitted emission measure is equal to and can be used to infer the mean particle number density , with the filling factor, , assumed to be 1. This factor represents the fraction of volume filled by the emitting gas. Although we have assumed this to be 1 in our calculations, there is evidence from hydrodynamical simulations to suggest this value could be 2 per cent (Strickland & Stevens, 2000). Corrections must be applied to the volume to account for the reduction in area due to the removal of point sources. The mean electron density is then used to derive the total gas mass , which leads to the thermal energy , and cooling time , of the hot gas. These parameters can be seen in Table 6, alongside values given in Read (2003) for the two galaxies that comprise The Mice. Although The Mice is likely at a later stage in the merger process than Arp 270, it is believed (Read, 2003) that the diffuse emission from the galaxies does not evolve as rapidly as the point source population. It is therefore useful to compare the diffuse gas parameters of both galaxy systems.
| Galaxy | Galaxy | Semi | Semi | |||||
|---|---|---|---|---|---|---|---|---|
| System | Major-axis | Minor-axis | (cm-3 ) | () | (erg) | (Myr) | ||
| (keV) | (kpc) | (kpc) | () | () | () | () | ||
| Arp 270 | NCG 3395 | 0.52 | 3.3 | 3.1 | 0.051 | 10.20 | 2.5 | 1432 |
| Arp 270 | NGC 3396 | 0.49 | 2.9 | 1.3 | 0.122 | 4.0 | 0.9 | 571 |
| The Mice | NGC 4676A | 0.50 | 3.2 | 3.2 | 0.019 | 6.5 | 1.8 | 480 |
| The Mice | NGC 4676B | 0.46 | 2.6 | 2.6 | 0.025 | 4.3 | 1.2 | 380 |
From this table it can be seen that the temperature of the diffuse gas in all four galaxies agrees well with the expected temperature of 0.5 keV found for diffuse gas in interacting galaxies (RP98). By looking at the mean electron density, it can be seen that NGC 3396 has a significantly higher value than the other three galaxies. This is likely to be caused by the molecular and HI gas content of the galaxy and its high inclination from the line of sight, it could also be the result of emission from the suspected point sources at the centre of the galaxy. Also from Table 6, it can be seen that the cooling times for both galaxies are much greater than the time since the last widespread starburst took place. Even if the low filling factor is included, the cooling times are still greater by a factor of 2, or more.
4.2.3 Origins of the diffuse X-ray emission
From Mattila & Meikle (2001) a relationship between the supernova rate of starburst galaxies and has been calculated:
| (7) |
generally, is expressed in the SN unit (SNu), i.e. the number of supernovae per century per 1010 of blue luminosity. However, in more active galaxies, it is more useful to normalise the observed number of supernovae to , which is known to be proportional to the galaxy star formation rate (Mattila & Meikle, 2001; Mannucci, 2003). Using equation 7, for Arp 270 is calculated to be 0.036 SNyr-1. Assuming that a massive star takes yr to evolve into a supernova and that the last episode of widespread star formation took place yr ago (Huang et al., 1994), we calculate the number of SNe which have occurred within the galaxy pair to be 106. Hence, assuming that each supernova will release erg of energy, the total thermal energy available is erg. This exceeds the value of 3.4 erg we have calculated from spectral modelling of the diffuse gas, although there will be additional energy sinks in the form of gravitational potential energy, wind kinetic energy and radiative losses.
Another possible source of diffuse X-ray emission is unresolved XRBs. We can estimate the X-ray luminosity arising from this contribution by extrapolating the X-ray luminosity below our detection threshold limit of 1.41038erg s-1 using the universal luminosity function derived by Grimm et al. (2003). This gives 1.21039erg s-1, for 1037erg serg s-1, thus showing that XRBs may be responsible for up to 12% of this seemingly diffuse emission. To allow for this XRB contribution we have re-fitted the diffuse gas for both galaxies including an additional powerlaw contribution, with fitted values of and a photon index fixed at =1.5; a typical XRB spectrum (Soria & Wu, 2003). The normalisation for this component has been frozen to limit the XRB contribution to erg s-1 for each galaxy. This spectral model resulted in lower temperature fits for both NGC 3395 and NGC 3396 of 0.51 keV and 0.39 keV respectively, although these values are consistent, within errors, with the previously derived temperatures (Table 4). The intrinsic X-ray luminosities arising from the diffuse gas in the galaxies are now found to be 3.37erg s-1 for NGC 3395 and 4.63erg s-1 for NGC 3396. Deriving the physical parameters of Arp 270 with these new, fitted, values results in a reduction in of and by for NGC 3395. The reduction in NGC 3396 for is , but is lower by , this is due to the lower fitted temperature derived from our spectral fit including an XRB contribution.
4.2.4 Comparisons with other merging systems
A comparison to The Mice highlights the absence of any gaseous outflows from Arp 270. In The Mice, diffuse outflows are seen coming from both galaxies. These features are small and are likely to be young starburst driven winds escaping from the nuclei of the galaxies. Arp 270 does not show these features, presumably since the gas has not had enough time to break out of the galaxy disks to form an outflow.
Evidence from previous studies (RP98) suggests that the galaxy pair NGC 3395/3396 is at an early stage of interaction. Clemens et al. (1999) have observed an HI tail extending from the south-east of the galaxy pair, it is likely that this feature was stripped from NGC 3395 during the system’s first closest approach. This interpretation is strengthened by the lack of optical tidal tails in the system, as well as the absence of gaseous outflows. In more advanced stages of galaxy evolution these features are good indicators of strong galaxy interactions (Toomre & Toomre, 1972).
Although it is known that Arp 270 is an early merger candidate, just where in this sequence it lies has not been defined. From N-body simulations it has been shown that Arp 270 is within approximately 5107 years of its second perigalactic passage (Clemens et al., 1999). By comparing this to N-body simulations carried out on the other merger systems in our sample, a merger time sequence can be established. We can then compare the properties derived from this Chandra observation to the merger systems mentioned previously. Table 7 shows a summary of some key properties of these systems. Column (1) gives the name of each system, (2) the time that has elapsed since the last perigalactic passage, (3) the overall X-ray luminosity of the system, (4) the / ratio, (5) the percentage of luminosity arising from the diffuse emission, and column (6) gives the slope of the luminosity function.
| Galaxy | Time Since First | / | % of | LF | |
|---|---|---|---|---|---|
| System | Perigalactic Passagea | ||||
| Myr | erg s-1 | Diffuse Emission | Slope | ||
| NGC 4485/90 | 40b | 2.00 | 0.55 | 10 | -0.57 0.10 |
| Arp 270 | 50c | 2.95 | 0.81 | 32 | -0.92 |
| The Mice | 180d | 7.03 | 1.13 | 25 | - |
| The Antennae | 210d | 8.40 | 0.94 | 45 | -0.53 0.07 |
| NGC 3256 | 500e | 35 | 5.83 | 80 | - |
By comparing the time-scales from N-body simulations in Table 7, it can be seen that Arp 270 lies second in this merger sample. Although, from the same N-body simulations, it was shown that an initial interaction between the two galaxies has taken place 5 108 years ago, this encounter was a weak fly-by interaction, unlike the strong NGC 3256 merger encounter which took place at the same time. We therefore characterise the timescale since the first strong interaction in Arp 270 as the time of 5 107 years since its second perigalactic passage. With the star formation activity, /, a problem we draw attention to is that, during recent star formation, is greatly enhanced and therefore not a good measure of the galaxy mass. A better indicator would be red luminosity, but these values are not readily available for this sample. Even so, it can be seen in Table 7 that, generally, / does increase with evolution. Again, we see that The Mice appears to be more active than The Antennae although we know, from N-body simulations, that The Antennae is more evolved. Another useful indicator of evolutionary stage is the percentage of luminosity arising from diffuse gas. Read & Ponman (2001) found that the more evolved the system (up to the ultraluminous, core merger stage), the higher the percentage. From Table 7 it can be seen this parameter gives support to Arp 270 being in a later stage of evolution than NGC 4485/90, but earlier than The Antennae and NGC 3256.
5 Conclusions
In this paper the Chandra observations of the interacting galaxy pair NGC 3395/3396 have been presented, along with previously unpublished ROSAT HRI observations. The two galaxies are thought to be of comparable masses, and lie at a distance of 28 Mpc. The pair are at an early stage of interaction, with the galaxy disks just starting to collide. The most interesting points from this paper can be summarised as follows:
-
•
A total of 16 point sources were detected, 15 of these were within the D25 ellipse, with a further source lying less than 10′′ outside the optical confines of the galaxy and obviously associated with an optical feature of NGC 3395. This is 12 more than previously detected with ROSAT. These sources were spectrally fitted using either an absorbed power law model or absorbed MEKAL model. Spectral fits suggest that the X-ray population is predominantly made up of XRBs, which is further supported by the observed variability of 7 of these sources. Given the time since the last starburst 4 years ago (Huang et al., 1994) these are mostly expected to be HMXRBs.
-
•
Of the detected sources, 7 exceed the Eddington limit for a 7 star and are therefore classified as ULXs. The findings of Swartz et al. (2004) indicate that there is a correlation between the number of ULXs and . Further evidence of this is given in this paper: in Figure 11 the slope of the relationship is found to be . We also find that the more active systems host more luminous ULXs. This is indicated by the steeper slope exhibited in our against fit where the slope is . These results, alongside the findings from Colbert et al. (2003) of the relation between point source X-ray luminosity and with , indicate that ULX populations are made up of a mixture of old and young sources.
-
•
X-ray features are found to coincide with the star forming knots found in the FUV data (Hancock et al., 2003). The formally detected source, source 3, resides near the centre of NGC 3396 and has an offset of 1.5″, corresponding to 210 pc. This offset could indicate that the source is a runaway binary, a HMXRB which has been ejected during the formation of the neutron star.
-
•
The luminosity function of the discrete sources, after correcting for source incompleteness, gives a slope of -0.92, which, within errors, is comparable to the value given by Colbert et al. (2003) of -0.65. This fit has been compared to a theoretical LF from Grimm et al. (2003) and, although the LFs have similar slopes, the theoretical line appears to suppress the number of discrete sources, indicating that SFR may not be a good normalisation factor for LFs.
-
•
The morphology of the diffuse gas in NGC 3395 is less compact than NGC 3396, which has some sub-structure running along its major-axis (i.e. in the east-west direction), and is highly inclined to the line of sight. In more evolved systems such as The Mice, hot gaseous outflows have been observed. We detect no such features in Arp 270, suggesting that the gas has not yet become compressed enough to create starburst-driven galactic winds. A bridge between the two galaxies has been detected in the optical and radio data. At the centre of this bridge, between the two galaxies, an X-ray source (source 6) has been detected. It is likely that this source is being triggered by the recent collision of the two galaxy disks.
-
•
The total (0.36.0 keV) X-ray luminosity of Arp 270 is 3.0erg s-1, with 32% of the emission arising from the diffuse gas. This is a smaller percentage of diffuse gas than more evolved merging systems. Less diffuse gas is expected in earlier systems as this emission is due to galactic winds and fountains which arise from a large collection of supernovae. These supernovae can take up to a few years to evolve and merge to form energetic superbubbles. From numerical simulations it is thought that Arp 270 is an early stage merger system, more evolved than NGC 4485/90 but not as evolved as The Mice, The Antennae or NGC 3256.
From this study we have been able to establish that Arp 270 is an example of a young merger candidate. By comparing the diagnostics of this system to other interacting galaxies we have found that the system is consistent with trends identified in RP98. The : value measured in this paper is in agreement with the : relation shown in RP98. We find that 32% of the X-ray emission from this system arises from the diffuse gas. This small percentage is expected in such a young merger system as the gas has not yet been compressed into the nuclei of the galaxies. This is further compounded by the absence of any hot gaseous outflows. These results also show that Arp 270 has a significant population of ULX sources, with almost 50% of the discrete X-ray sources detected exceeding 1 erg s-1. From spectral fitting it is likely that the ULXs are XRBs, an indication which is given further credence by the observed variability of four of these sources.
6 Acknowledgements
We thank the Chandra X-ray Center (CXC) Data Systems and Science Data Systems teams for developing the software used for the reduction (SDP) and analysis (CIAO). We would also like to thank the anonymous referee for helpful comments which improved this paper, and Mark Hancock for providing the FUV FITS files for Arp 270. NJB acknowledges the support of a PPARC studentship.
References
- Arp (1966) Arp H., 1966, ApJS, 14, 1
- Buote & Fabian (1998) Buote D. A., Fabian A. C., 1998, MNRAS, 296, 977
- Carpenter (1957) Carpenter E. F., 1957, PASP, 69, 386
- Cash (1979) Cash W., 1979, ApJ, 228, 939
- Clemens et al. (1999) Clemens M. S., Baxter K. M., Alexander P., Green D. A., 1999, MNRAS, 308, 364
- Colbert et al. (2003) Colbert E., Heckman T., Ptak A., Strickland D., 2003, astro-ph/0305476
- Cordes & Chernoff (1998) Cordes J. M., Chernoff D. F., 1998, ApJ, 505, 315
- de Vaucouleurs et al. (1991) de Vaucouleurs G., de Vaucouleurs A., Corwin H. G., Buta R. J., Paturel G., Fouque P., 1991, Third Reference Catalogue of Bright Galaxies, Volume 1-3, XII, Springer-Verlag Berlin Heidelberg New York
- Devereux & Eales (1989) Devereux N. A., Eales S. A., 1989, ApJ, 340, 708
- Dewangan et al. (2004) Dewangan G. C., Miyaji T., Griffiths R. E., Lehmann I., 2004, astro-ph/0401223
- Dreyer (1988) Dreyer J. L. E., 1988, NGC 2000.0, Cambridge Univ. Press, Cambridge
- Elmegreen et al. (1998) Elmegreen D. M., Chromey F. R., Knowles B. D., Wittenmyer R. A., 1998, ApJ, 115, 1433
- English et al. (2003) English J., Norris R. P., Freeman K. C., Booth R. S., 2003, AJ, 125, 1134
- Fabbiano et al. (1992) Fabbiano G., Kim D.-W., Trinchieri G., 1992, ApJs, 80, 531
- Fabbiano et al. (2003) Fabbiano G., Zezas A., King A. R., Ponman T. J., Rots A., Schweizer F., 2003, ApJ, 584, L5
- Fabbiano et al. (2001) Fabbiano G., Zezas A., Murray S., 2001, ApJ, 554, 1035
- Fryer & Kalogera (2001) Fryer C. L., Kalogera V., 2001, ApJ, 554, 548
- Garrido et al. (2002) Garrido O., Marcelin M., Amram P., Boulesteix J., 2002, A&A, 387, 821
- Gavazzi & Boselli (1996) Gavazzi G., Boselli A., 1996, A UBVJHK photometric catalogue of 1022 galaxies in 8 nearby clusters, Gavazzi, G.; Boselli, A., eds., New York: Gordon and Breach Science Publishers,
- Giacconi et al. (2001) Giacconi R., Rosati P., Tozzi P., Nonino M., Hasinger G., Norman C., Bergeron J., Borgani S., Gilli R., Gilmozzi R., Zheng W., 2001, ApJ, 551, 624
- Grimm et al. (2003) Grimm H.-J., Gilfanov M., Sunyaev R., 2003, MNRAS, 339, 793
- Hancock et al. (2003) Hancock M., Weistrop D., Eggers D., Nelson C. H., 2003, AJ, 125, 1696
- Hernández-Toledo & Puerari (2001) Hernández-Toledo H. M., Puerari I., 2001, A&A, 379, 54
- Homan et al. (2001) Homan J., Wijnands R., van der Klis M., Belloni T., van Paradijs J., Klein-Wolt M., Fender R., Méndez M., 2001, ApJs, 132, 377
- Huang et al. (1994) Huang Z., Yin Q., Saslaw W. C., Heeschen D. S., 1994, ApJ, 423, 614
- Immler et al. (2003) Immler S., Wang Q. D., Leonard D. C., Schlegel E. M., 2003, ApJ, 595, 727
- Jeltema et al. (2003) Jeltema T. E., Canizares C. R., Buote D. A., Garmire G. P., 2003, ApJ, 585, 756
- Kaaret et al. (2004) Kaaret P., Alonso-Herrero A., Gallagher J. S., Fabbiano G., Zezas A., Rieke M. J., 2004, MNRAS, 348, L28
- Kaaret et al. (2001) Kaaret P., Prestwich A. H., Zezas A., Murray S. S., Kim D.-W., Kilgard R. E., Schlegel E. M., Ward M. J., 2001, MNRAS, 321, L29
- Lauberts & Valentijn (1989) Lauberts A., Valentijn E. A., 1989, The surface photometry catalogue of the ESO-Uppsala galaxies, Garching: European Southern Observatory
- Lira et al. (2002) Lira P., Ward M., Zezas A., Alonso-Herrero A., Ueno S., 2002, MNRAS, 330, 259
- Liu et al. (2004) Liu J., Bregman J. N., Seitzer P., 2004, ApJ, 602, 249
- Lyne & Lorimer (1994) Lyne A. G., Lorimer D. R., 1994, Nature, 369, 127
- Mannucci (2003) Mannucci F., et al. 2003, A&A, 401, 519
- Mattila & Meikle (2001) Mattila S., Meikle W., 2001, MNRAS, 324, 325
- McClintock & Remillard (2003) McClintock J. E., Remillard R. A., 2003, astro-ph/0306213
- Mihos et al. (1993) Mihos J. C., Bothun G. D., Richstone D. O., 1993, ApJ, 418, 82
- Miller & Colbert (2003) Miller M. C., Colbert E. J. M., 2003, astro-ph/0308402
- Moshir (1990) Moshir M., et al. 1990, IRAS Faint Source Catalogue, version 2.0
- Read (2003) Read A. M., 2003, MNRAS, 342, 715
- Read & Ponman (1998) Read A. M., Ponman T. J., 1998, MNRAS, 297, 143
- Read & Ponman (2001) Read A. M., Ponman T. J., 2001, MNRAS, 328, 127
- Roberts et al. (2002) Roberts T. P., Warwick R. S., Ward M. J., Murray S. S., 2002, MNRAS, 337, 677
- Rosa-González et al. (2002) Rosa-González D., Terlevich E., Terlevich R., 2002, MNRAS, 332, 283
- Smith & Struck (2001) Smith B. J., Struck C., 2001, AJ, 121, 710
- Smith et al. (2004) Smith B. J., Struck C., Nowak M. A., 2004, astro-ph/0412039
- Soria et al. (2005) Soria R., Cropper M., Pakull M., Mushotzky R., Wu K., 2005, MNRAS, 356, 12
- Soria & Motch (2004) Soria R., Motch C., 2004, A&A, 422, 915
- Soria & Wu (2003) Soria R., Wu K., 2003, A&A, 410, 53
- Strickland et al. (2000) Strickland D. K., Heckman T. M., Weaver K. A., Dahlem M., 2000, AJ, 120, 2965
- Strickland & Stevens (2000) Strickland D. K., Stevens I. R., 2000, MNRAS, 314, 511
- Swartz et al. (2004) Swartz A. S., Ghosh K. K., Tennant A. F., Wu K., 2004, astro-ph/0405498
- Tanaka & Lewin (1995) Tanaka Y., Lewin H., 1995, in X-ray Binaries, Lewin, W.H.G. and van Paradijs, J. and van der Heuvel, E.P.J., eds., Cambridge Univ. Press, p.126
- Toomre (1977) Toomre A., 1977, in Evolution of Galaxies and Stellar Popultations, Tinsky B. M., Larson T. B. eds, Yale University Observatory, New Haven, p.401
- Toomre & Toomre (1972) Toomre A., Toomre J., 1972, ApJ, 178, 623
- Tully (1988) Tully R. B., 1988, Nearby Galaxies Catalog, Cambridge Univ. Press, Cambridge
- Vorontsov-Velyaminov (1959) Vorontsov-Velyaminov B. A., 1959, Atlas and Catalogue of Interacting Galaxies, Sternberg State Astronomical Institute, Moscow State University
- Weisskopf et al. (2000) Weisskopf M. C., Tananbaum H. D., Van Speybroeck L. P., O’Dell S. L., 2000, Proc. SPIE Vol. 4012, X-Ray Optics, Instruments, and Missions III, Joachim E. Truemper; Bernd Aschenbach; Eds., p. 2
- White et al. (1995) White N. E., Nagase F., Parmar A. N., 1995, in X-ray Binaries, Lewin, W.H.G. and van Paradijs, J. and van der Heuvel, E.P.J., eds., Cambridge Univ. Press, p.1
- Wolter & Trinchieri (2004) Wolter A., Trinchieri G., 2004, astro-ph/0407446
- Zhu et al. (1999) Zhu M., Seaquist E. R., Davoust E., Frayer D. T., Bushouse H. A., 1999, AJ, 118, 145
- Zimmermann (1994) Zimmermann H. U., 1994, EXSAS User Guide, 4th edition