email: breitschwerdt@astro.univie.ac.at
2Department of Mathematics, University of Évora, R. Romão Ramalho 59, 7000 Évora, Portugal
email: mavillez@galaxy.lca.uevora.pt
Overview of the ISM Phases: Evolution of Large and Small Scale Structures in 3D high resolution HD and MHD simulations
Abstract
We review recent 3D high resolution numerical HD and MHD studies of a multi-component and multi-phase ISM. The computational grid was chosen large enough in the disk to represent typical ISM gas patterns, and in the halo to include the full extent of the Galactic fountain. The evolution of the ISM is driven by supernovae of all types and followed for 400 Myrs, long enough to get rid of memory effects of the initial distributions. The results are substantially different from previous classical analytical models and entail: (i) a very inhomogeneous distribution of ISM gas, (ii) a high level of supernova driven turbulence, (iii) an active Galactic fountain flow, reaching out to about 5 kpc on either side of the disk, (iv) a low volume filling factor for the hot gas of about 20%, (v) a very weak correlation between magnetic field and gas density, , for , and, (vi) about 50% of the gas disk mass with , residing in classically thermally unstable temperature regimes.
1 Introduction
Modern history of the interstellar medium (ISM) commences with the discovery of the hot component (HIM) with the Copernicus satellite, revealing a diffuse wide-spread Ovi resonance line doublet in absorption towards background stars (Jenkins & Meloy 1974, York 1974). Earlier, following the discovery of the X-ray background by Giacconi et al. (1962), diffuse soft X-ray emission below 2 keV was observed (Bowyer et al. 1968). While much of its harder part has been resolved into point sources according to deep field observations with the Chandra (Mushotzky et al. 2000) and XMM-Newton (Hasinger et al. 1998, 2001) X-ray observatories, the emission below keV must be largely thermal in origin coming from a hot plasma. It became therefore clear, even in the early days, that a new “phase” of the ISM had been discovered, which should dominate by volume, and due to the implied temperature range ( K) must be mainly generated by shock heating of supernova remnants (SNRs). We note parenthetically that the gas causing the Ovi absorption cannot be the one emitting in soft X-rays, since in collisional ionization equilibrium in the latter Ovii would dominate Ovi by two orders of magnitude.
It was shown by Cox & Smith (1974) that a supernova (SN) rate of per years is sufficient to maintain a large scale Galactic tunnel network. A corollary of their work was that the Hi should be distributed in filaments, some of them dense enough to be associated with tunnel walls. The filamentary structure of the cold gas is actually also found in our 3D high resolution simulations (Avillez & Breitschwerdt 2004, 2005), which will be discussed here in some detail. The disk-halo circulation (or Galactic fountain, cf. Shapiro & Field 1976, Bregman 1980, Kahn 1981) reinforced by the clustering of O and B stars in the disk, was certainly a salient feature missing in the early studies. McKee & Ostriker (MO, 1977) have tried to put all the wisdom of the ISM into a coherent picture, coined the three-phase ISM model. One of the most interesting features is the transformation of the “phases” into one another by different physical processes, such as e.g. radiative cooling, heat conduction, photoionization and evaporation. In general ISM physics, the term “phases” refers to the stable branches (upon entropy perturbations) in the -diagram. The underlying assumption of the MO model is that the ISM is in global pressure equilibrium.
A heavily non-linear system like the ISM is susceptible to changes in the initial conditions, as it is known from deterministic chaos theory. Therefore the richness of phenomena cannot be covered in an analytical model, and detailed numerical simulations are required. It is therefore not surprising that the MO model fails, e.g., in the predicted volume filling factors of the diffuse ionized gas (DIG) and especially of the HIM; the latter is at least a factor of 2 too high. This is partly due to the fact that clustered SNe were not considered, as was done in the so-called “chimney” model (Norman & Ikeuchi 1989). Here break-out and establishment of the fountain flow was accounted for, but the physics of break-out was rather idealistic.
Not surprisingly, all analytic models and low resolution 2D simulations have underestimated the rôle of turbulence and have missed the amount of gas which resides in thermally unstable regimes, as will be discussed in some detail in this review.
2 3D High Resolution Simulations
2.1 The model
| a | b | c | d | e |
|---|---|---|---|---|
| 1 | 0.171 | 0.354 | 0.298 | 0.178 |
| 2 | 0.108 | 0.342 | 0.328 | 0.223 |
| 4 | 0.044 | 0.302 | 0.381 | 0.275 |
| 8 | 0.005 | 0.115 | 0.526 | 0.354 |
| 16 | 0.000 | 0.015 | 0.549 | 0.436 |
| a SN rate in units of the Galactic SN rate. | ||||
| b K. | ||||
| c K. | ||||
| d K. | ||||
| e K. | ||||
The hydrodynamical (HD) and magnetohydrodynamical (MHD) equations are solved on a Cartesian grid of kpc size in the Galactic plane and extending kpc into the halo (for details see Avillez 2000, and Avillez & Breitschwerdt 2004). The kernel of the model consists of a three-dimensional HD or MHD code that uses adaptive mesh refinement (AMR) in a block-based structure in combination with Message Passing Interface (MPI) suitable for massive parallel computations. This will ensure the full capturing of the disk-halo-disk cycle, i.e. the Galactic fountain flow. The grid is centered on the solar circle, with a finest adaptive mesh refinement resolution of 0.625 (HD) and 1.25 pc (MHD), respectively, in the layer kpc. Following the observations, basic physical ingredients of the model are: (i) massive star formation in regions of converging flows (, being the gas velocity) where density and temperature are cm-3 and T K, respectively; (ii) the distribution of masses and individual stellar life times are derived from a Galactic initial mass function for massive stars; (iii) SN explosions occur at a Galactic rate and with a canonical energy of erg (including the scale height distributions of types Ia, Ib and II); (iv) the gas is immersed in a gravitational field provided by the stellar disk, following Kuijken & Gilmore (1989); (v) radiative cooling (assuming an optically thin gas in collisional ionization equilibrium) with a temperature cut-off at 10 K, and uniform heating due to starlight varying with (Wolfire et al. 1995); (vi) in case of the MHD simulation, an initially disk parallel magnetic field composed of random () and uniform () components, with total field strength of G ( and G). The establishment of the fountain flow up to vertical heights of kpc takes about Myr, so that a simulation time of 400 Myr seems adequate in order to recover the main features. Boundary conditions are periodic on the side walls of the computational box and outflow on its top and bottom.
2.2 The results
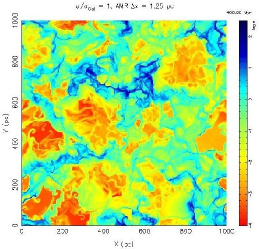
In comparison to other authors, our results cover a large fraction of the galactic disk and the halo and yet retain a high spatial resolution, and follow the evolution over a time scale long enough to have erased all memory effects imprinted by the initial conditions. These have always to be chosen in an artificial way, since we are only capturing a small window of a galaxy’s long history. In Fig. 1 the distribution of the major quantities (for HD simulations), characterizing the physical state of the ISM in the disk, is shown: gas density , pressure (where is Boltzmann’s constant), and the gas temperature . The first row represents these variables for the Galactic SN rate and the second for .
Looking at the density and temperature, we see that the structure of the ISM is very inhomogeneous. There are regions of SNR and superbubble (SB) size at very low density and high temperature, interspersed with shock compressed layers, originating from colliding laminar flows. The pressure is considerably lower than in most (analytical) models and it is not at all uniform, showing substantial variation of more than one order of magnitude; note that this was one of the basic assumption of the three-phase MO model. Another most remarkable result is that almost half of the ISM mass resides in thermally unstable phases. How is this possible? The classical Field (1965) criterion, according to which instability is expected to set in, if , where is the heat loss function per unit mass, is insufficient, since a gas element does not just sit there and cool down. On the contrary, due to the high level of turbulence, it is constantly shuffled around and finds itself in widely different environments. Thus, one possibility to get around catastrophic energy losses is if the typical eddy crossing time is less than the radiative cooling time, i.e., (with being the turbulent velocity fluctuation amplitude and the eddy scale). For Kolmogoroff turbulence, which seems to exist in a variety of different ISM environments, we obtain in the inertial range for wavelengths , cm, for values corresponding to the warm neutral medium (WNM) of about K (cf. Avillez & Breitschwerdt 2005). We find that of the mass in the disk (see Table 2) is concentrated in the classical thermally unstable regime K with of the warm neutral medium (WNM) mass enclosed in the K gas, consistent with recent observations by Heiles & Troland (2003).
From Table 1 the interesting result can be deduced, that even for SN rates as high as 16 times the Galactic rate (corresponding already to starburst conditions), the volume filling factor of the hot gas remains below 50%. In our Galaxy its values is only 17% in the HD and 21% in the MHD simulations (cf. Table 2), and therefore considerably lower than the 50-70% in the MO model. The main reason for this discrepancy lies in the fact, that clustered SN explosions can enforce break-out of SBs and thus establish a fairly efficient Galactic fountain.
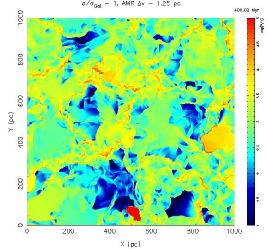
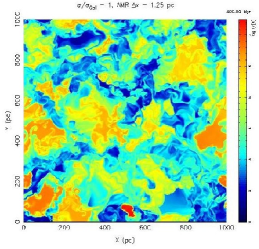
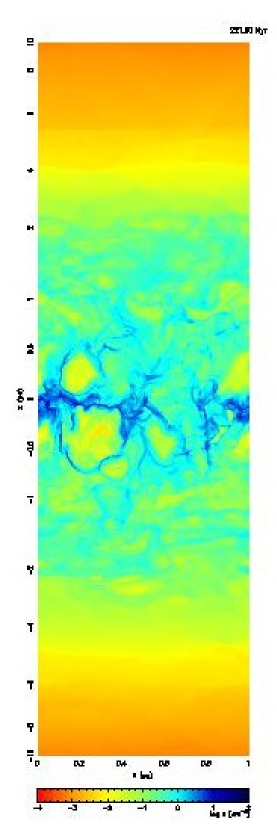
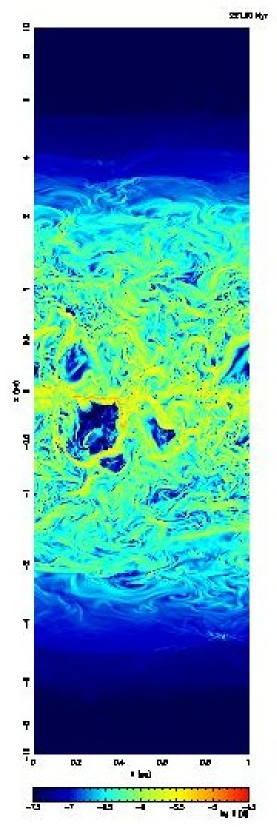
The MHD simulations have been carried out under the same general conditions as the HD calculations, except that the resolution limit was 1.25 pc. After several stellar cycles the disk gets disrupted due to SNR and SB break-out. The left panel of Fig. 2 shows the presence of a wiggly and thin disk of cold gas overlayed by a frothy thick disk composed of neutral (light blue) and ionized (greenish) gas. The break-out of SBs can be nicely seen, especially in the southern hemisphere, where large bubbles of diameters of pc expand into the halo, one even opening up. The magnetic field map shows the thin magnetized disk overlayed by beautiful magnetic loops, seen in Fig. 2 (right) in projection stacked on top of each other, magnetic islands, and clouds wrapped in field lines moving downwards. There is also cold gas descending along the loops. From these maps it can be immediately seen that the simulations must take into account very large heights on either side of the midplane, allowing for the setup of the disk-halo-disk circulation. Considering the controversial discussions during the late 80’s, mainly based on analytical calculations and 2D simulations, whether SBs can break out of the disk, and finally blow out into the halo, this problem seems to be resolved now. Unless a galaxy has an extremely strong magnetic field, and if the field strength initially decreases with proportional to the gas density, the set-up of the galactic fountain flow can be at most delayed but not inhibited, as can be seen from Fig. 2.
| T | a [%] | b [%] | c | |||
| [K] | HD | MHD | HD | MHD | HD | MHD |
| K | 5 | 6 | 44.2 | 39.9 | 7 | 10 |
| 46 | 29 | 49.0 | 43.7 | 15 | 15 | |
| 10 | 11 | 4.4 | 8.5 | 25 | 21 | |
| 22 | 33 | 2.0 | 7.4 | 39 | 28 | |
| 17 | 21 | 0.3 | 0.5 | 70 | 55 | |
| a Occupation fraction. | ||||||
| b Mass fraction. | ||||||
| c Root mean square velocity in units of km s-1. | ||||||
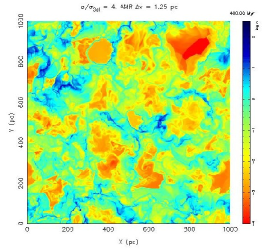
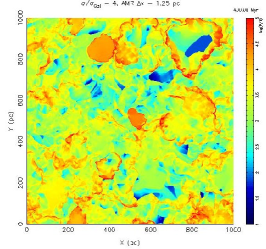
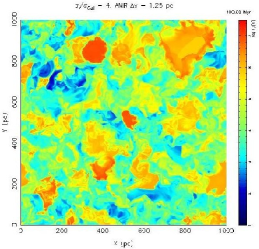
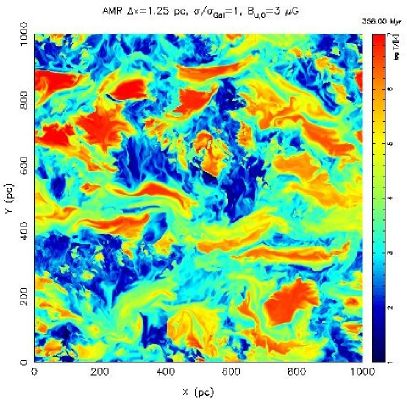
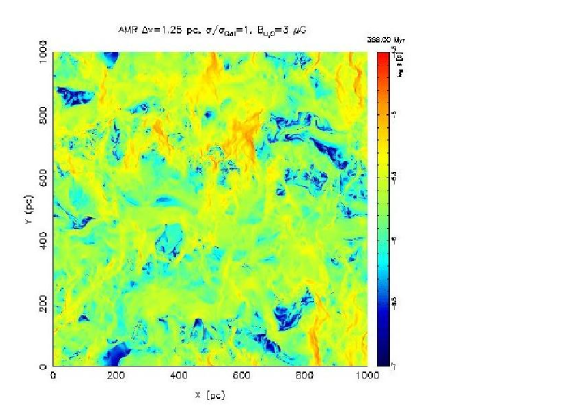
In the disk itself, the distribution of hot gas shows some features of banana-shaped SBs (see Fig. 3 left), as would be expected for an evolved bubble, when magnetic tension overcomes internal pressure, and the bubbles can indeed shrink in the direction perpendicular to the field wrapped around the shell (see also Ferriére et al. 1991). Although there is some general field alignment of structures, the field itself is fairly non-uniform, exhibiting small-scale structures (see Fig. 3 right).
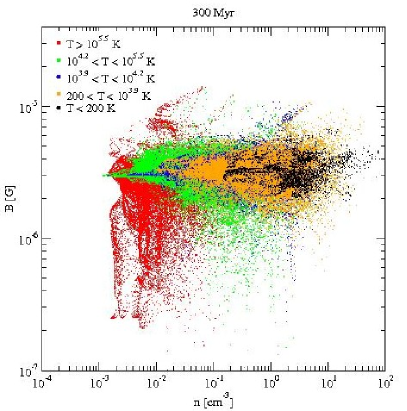
As the magnetic lines of force are frozen into the ISM plasma, there are some general arguments, that there should be a correlation, , between mass density and magnetic Field strength . Chandrasekhar and Fermi (1953) have argued that if the field is coupled to randomly moving gas clouds, the Alfvén speed will be proportional to the turbulent velocity, and hence . Extracting a scatter plot of versus from our data cube, it can be seen that during the evolution of the system the field strength broadened its distribution, spanning two orders of magnitude after 400 Myr. Dense regions have stronger field strengths and rarefied regions weaker strengths. Fig. 4 (left) shows almost no correlation between magnetic field strength and gas density except to some extent for the cold dense regions (see also Heitsch et al. 2004).
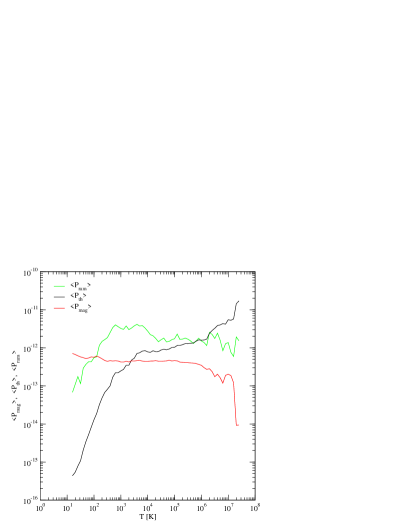
We may finally ask ourselves what is actually driving the ISM flows, and also the turbulence. In Fig. 4 (right) we have plotted the volume averaged pressures (magnetic pressure in red, thermal pressure in black, and ram pressure in green) against temperature, in order to get an idea of the driving forces for the various ISM phases and the unstable intermediate regimes. The result can be summarized as follows: for low temperatures, magnetic pressure dominates, whereas for high temperatures, clearly thermal pressure is the main driving agent. But for all temperatures between 100 K and K ram pressure dominates.
3 Conclusions
The ISM is a complex and highly non-linear system of gas, dust, magnetic field and cosmic rays, powered by stellar photons, winds, and most importantly, by supernova explosions. It is therefore not surprising, that it shows a large variety of phenomena, e.g. phase transitions, filamentary structure of cold and warm gas, highly turbulent flows etc.. From analytical calculations, one can derive the existence of phases, and their respective volume filling factors, under certain assumptions, such as global pressure equilibrium. However, quantitative estimates are rather difficult to obtain, and can even be misleading, because some of the assumptions are questionable. We have therefore followed a new approach, where the evolution of a representative section of the magnetized gas disk and its overlying halo are followed for an evolution time of 400 Myrs, with high spatial subparsec resolution. We thus find a highly turbulent medium, containing about half of its mass in thermally unstable temperature regimes, and exhibiting a large scale Galactic fountain. We believe that the basic features of the ISM are captured in our simulations. Future work includes the effects of e.g. cosmic rays, non-equilibrium cooling and self-gravity of the gas on the local and global ISM.
Acknowledgements. DB thanks the organizers for hospitality and financial support.
References
- [2000] Avillez M.A. 2000, MNRAS 315, 479
- [2005] Avillez M.A., Breitschwerdt, D. 2005, A&A (in press), astro-ph/0502327
- [2004] Avillez M.A., Breitschwerdt, D. 2004, A&A 425, 899
- [1968] Bowyer, C.S., Field, G.B., Mack, J.F. 1968, Nature 217, 32
- [1980] Bregman, J.N. 1980, ApJ 236, 577
- [1953] Chandrasekhar, S., Fermi, E. 1953, ApJ, 118, 113
- [1974] Cox, D.P., Smith, B.W. 1974, ApJ 189, L105
- [1991] Ferrière, K.M., Mac Low, M.-M., Zweibel, E.G. 1991, ApJ, 375, 239
- [1965] Field, G.B. 1965, ApJ 142, 531
- [1962] Giacconi, R., Gursky, H., Paolini, F.R., Rossi, B. 1962, Phys. Rev. Letters 9, 439
- [2001] Hasinger, G., et al. 2001, A&A 365, L45
- [1998] Hasinger, G., Burg, G., Giacconi, R., Schmidt, M., Trümper, J., Zamorani, G. 1998, A&A 329, 428
- [2003] Heiles, C., Troland, T. H. 2003, ApJ, 586, 1067
- [2004] Heitsch, F., Zweibel, E.G., Slyz, A.D., Devriendt, J.E.G. 2004, ApJ 603, 165
- [1974] Jenkins, E.B., Meloy, D.A. 1974, ApJ 193, L121
- [1981] Kahn, F.D. 1981, in: Investigating the Universe, ed. F.D. Kahn, Reidel Dordrecht, p. 1.
- [1989] Kuijken, K., Gilmore, G. 1989, MNRAS 239, 571
- [1977] McKee, C.F., Ostriker, J.P. 1977, ApJ 218, 148
- [2000] Mushotzky, R.F., Cowie, L.L., Barger, A.J., Arnaud, K.A. 2000, Nature 404, 459
- [1989] Norman, C.A., Ikeuchi, S. 1989, ApJ 345, 372
- [1976] Shapiro, P.R., Field, G.B. 1976, ApJ 205, 762
- [1995] Wolfire, M.G., McKee, C.F., Hollenbach, D., Tielens, A.G.G.M., & Bakes, E.L.O. 1995, ApJ, 443, 152
- [1974] York, D.G. 1974, ApJ 193, L127