The K20 survey.
The K20 survey is a near infrared-selected, deep () redshift survey targeting galaxies in two independent regions of the sky, the Chandra Deep Field South and the field around the quasar , for a total area of 52 arcmin2. The total -selected sample includes 545 objects. Low-resolution () optical spectra for 525 of them have been obtained with the FORS1/FORS2 spectrographs at the ESO/VLT, providing 501 spectroscopic identifications (including 12 type-1 AGN and 45 stars); consequently, we were able to measure redshifts and identify stars in 96% of the observed objects, whereas the spectroscopic completeness with respect to the total photometrically selected sample is 92% (501/545). The K20 survey is therefore the most complete spectroscopic survey of a near infrared-selected sample to date. The K20 survey contains 444 spectroscopically identified galaxies, covering a redshift range of , with a mean redshift ; excluding the 32 “low-quality” redshifts does not significantly change these values. This paper describes the final K20 spectroscopic catalogue, along with the technique used to determine redshifts, measure the spectral features and characterize the spectra. The classification of the galaxy spectra has been performed according to a simple parametric recipe that uses the equivalent widths of the two main emission lines ([OII]3727 and H+[NII]) and two continuum indices (the 4000Å break index, , and a near-UV color index, (28-39)). We defined three main spectroscopic classes: red early-type galaxies, blue emission-line galaxies and the intermediate galaxies, which show emission lines but a red continuum. More than 95% of the examined galaxies is included in one of these spectral types and a composite spectrum is built for each of the three galaxy classes. The full spectroscopic catalogue, the reduced individual spectra and the composite spectra are released to the community through the K20 web page (http://www.arcetri.astro.it/∼k20/).
The blue emission-line and the early-type galaxies have been divided in redshift bins, and the corresponding composite spectra have been built, in order to investigate the evolution of the spectral properties of the K20 galaxies with redshift. The early-type average spectra are remarkable in their similarity, showing only subtle but systematic differences in the index, which are consistent with the ageing of the stellar population. Conversely, the star-forming galaxies present a significant “blueing” of the optical/near-UV continuum with redshift, although the [OII] equivalent width remains constant (Å) in the same redshift intervals. We reproduce the observed properties with simple, dust-free population synthesis models, suggesting that the high-redshift galaxies are younger and more active than those detected at lower redshift, whilst the equivalent width of the emission lines apparently require a lower metallicity for the low-redshift objects. This may be consistent with the metallicity-luminosity relationship locally observed for star-forming galaxies.
Key Words.:
galaxies evolution – galaxies: distances and redshifts1 Introduction
Despite the success of photometric techniques in selecting samples of high-redshift galaxies, spectroscopy still represents a more powerful approach to investigate the nature and evolution of galaxies thanks to the larger amount of information contained in galaxy spectra with respect to broad-band photometry. The 8–10m-class telescopes and their modern multi–object spectrographs allow to perform deep spectroscopic surveys and derive the spectral properties of large samples of faint galaxies.
Among the several tools currently available to investigate galaxy evolution, the selection and study of samples of faint galaxies in the near-infrared (especially in the -band) is one of the most powerful for ground-based observations thanks to three main features. First, the -band selection is free from strong biases against or in favor of particular classes of galaxies and minimizes the k-correction effects up to redshift (Cowie et al. HawaiiK (1994)). Second, the effects of dust extinction and obscuration are smaller in near-infrared samples. Third, as the rest-frame near-IR luminosity is known to trace the galaxy mass, samples of galaxies selected in the -band allow to trace the cosmic history of galaxy mass assembly up to . These advantages make -band surveys, although they contain a smaller number of objects than the optical ones, more suitable to investigate galaxy evolution with respect to optical samples, the latter being biased toward star-forming galaxies with little dust extinction and sensitive to the rest-frame ultraviolet luminosity dominated by hot short-lived massive stars (i.e., not representative of the global galaxy stellar mass).
Following this approach, several near-infrared surveys have been and are being undertaken, with some of them based mostly or exclusively on photometric redshifts and others making use of deep spectroscopy (see Salvato et al. 2004111http://www.mpe.mpg.de/∼mara/surveys/ for a recent ”survey of surveys”). Among the optical spectroscopic surveys designed to identify faint -selected galaxies down to , there are those of Songaila et al. (songaila (1994)), Cowie et al. (cowie96 (1996)), Cohen et al. (1999a , 1999b ; CFGRS), Drory et al. (MUNICS (2001); MUNICS), Cimatti et al. (2002c ; K20), and Abraham et al. (GDDS (2004); GDDS). The typical size of the spectroscopic samples is in the range of about 200–500 objects selected from fields of 15–100 arcmin2. The percentages of objects with spectroscopic identification with respect to the photometric samples range from 80% (e.g. Cohen et al. 1999b ; Abraham et al. GDDS (2004)) to 90% (e.g. Cimatti et al. 2002c ; this work). The two most recent spectroscopic surveys (K20 and GDDS) were designed with two different approaches. The GDDS sample was selected to , covers an area of 304 arcmin2, and very deep spectroscopy was concentrated on a subset of candidates at . The K20 survey was based on a sample selected at from an area of 52 arcmin2, and spectroscopy was carried out for all the objects without any redshift pre-selection; the spectroscopic sample contains 444 galaxies covering a wide redshift range of , with a mean redshift . Both surveys were capable of covering the so-called “redshift desert” by identifying a substantial number of galaxies at .
The importance of near-infrared surveys has been demonstrated by the discovery of substantial populations of distant galaxies which are missed by traditional optical surveys (see McCarthy McCarthy (2004) for a recent review), and by the possibility of using the resulting samples to successfully investigate several aspects of galaxy evolution (e.g. Cimatti 2004a ), to perform stringent comparisons with models of galaxy formation (e.g. Cimatti et al. 2002b ; Somerville et al. Somerville04 (2004)), and to place the first constraints on the evolution of the stellar mass density in the Universe (e.g. Dickinson et al. dickinson (2003); Drory et al. drory (2004); Fontana et al. K20_6 (2004); Glazebrook et al. glaze (2004)). Overall, the results of near-infrared surveys suggest a scenario where the luminosity function, and the stellar mass density and function are characterized by a little and slow evolution to . The picture becomes more controversial at higher redshifts, where the evolution of the near-IR luminosity function and cosmic stellar mass density is faster, and the properties and role of the massive galaxies found at (e.g. Franx et al. franx (2003); van Dokkum et al. vandokkum (2003); Daddi et al. 2004a ; Glazebrook et al. glaze (2004); Cimatti et al. 2004b ; Saracco et al. saracco (2004)) have still to be clarified.
In this paper, we present the spectroscopic sample resulting from the K20 survey, discuss the spectral classification and main properties of the identified objects, show the average spectra of different classes of galaxies, and explore the existence of spectral evolutionary trends as a function of redshift. Together with this paper, we publicly release the K20 sample, the individual spectra and the average spectra on the K20 survey web page. kms-1Mpc-1, and are adopted throughout this paper.
2 The K20 survey and its main results
The K20 survey was based on an ESO VLT Large Program aimed at obtaining mostly optical and some near-infrared spectra of a complete sample of 545 objects down to (Vega system), to derive their redshifts and spectral properties, and to investigate galaxy evolution up to .
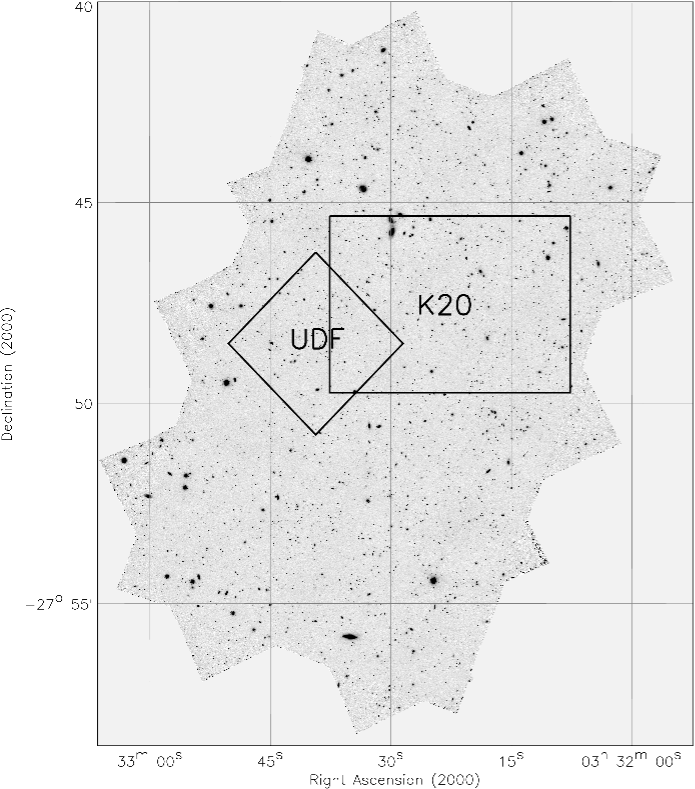
The sample was extracted from two independent fields, with a total surveyed area of 52 arcmin2. The targets were selected from a 32.2 arcmin2 area of the Chandra Deep Field South (CDFS; Giacconi et al. CDFS (2001)) and from a 19.8 arcmin2 area around the z=3.7 quasar (Q0055; Cristiani et al. Q0055 (1995)). The K20 32.2 arcmin2 field in the CDFS is also located within the 150 arcmin2 southern field of the GOODS project, where several multi-wavelength public data are or will be available (Dickinson et al. GOODS_1 (2004); Giavalisco et al. GOODS_2 (2004)). The K20 field in the CDFS overlaps marginally with the Hubble Ultra Deep Field (HUDF; Beckwith et al. 2005, in preparation; see Figure 1). The K20 sample characteristics, the photometric properties and completeness of the sample, and the photometric redshifts were already described in detail by Cimatti et al. (2002c , hereafter Paper III).
With respect to the spectroscopy discussed in Paper III (observations in 1999-2000), additional spectroscopic data were obtained in 2002 by K20 team members (see Cimatti et al. manifold (2003); Cimatti et al. 2004b ; Daddi et al. 2004a ). This new spectroscopy allowed us to increase the overall spectroscopic redshift completeness of the total K20 sample (i.e. both K20 fields together) from 87% (Paper III) to 92%. Moreover, if also the ESO/GOODS public spectra in the GOODS-South field published so far (Vanzella et al. fors2goods (2004)) are added222For five galaxies the redshift has been obtained from ESO/GOODS data., the spectroscopic redshift completeness in the CDFS/K20 32.2 arcmin2 sub-field alone is 94%. We emphasize that the K20 survey represents a significant improvement with respect to other surveys for faint -selected galaxies thanks to its high spectroscopic redshift completeness (the highest to date) extended to very faint red objects, the larger sample and the availability of well-trained and reliable photometric redshifts (see Fig. 9 and 10 of Cimatti et al. 2002c ).
The main scientific results of the K20 survey have been published in a number of recent papers which discuss various aspects of galaxy evolution: the spectral and clustering properties of Extremely Red Objects (EROs) (Cimatti et al. 2002a , Paper I; Daddi et al. K20_2 (2002), Paper II), the comparison between the observed redshift distribution and those predicted by different models of galaxy formation (Cimatti et al. 2002b , Paper IV), the evolution of the near-infrared luminosity density and luminosity (Pozzetti et al. K20_5 (2003), Paper V), the X-ray and morphological properties of EROs (Brusa et al. EROS_X (2002); Cimatti et al. manifold (2003)), the study of the large scale structure in the CDFS (Gilli et al. gilli (2003)), the evolution of the stellar mass density and function (Fontana et al. K20_6 (2004), Paper VI), the evolution of the galaxy blue Luminosity Function (Poli et al. poli (2003)), the nature and role of massive star-forming galaxies at (Daddi et al. 2004a ; de Mello et al. demello (2004)), the discovery of old and massive spheroids up to (Cimatti et al. 2004b ), the definition of a new photometric technique for a joint selection of star-forming and passive galaxies at (Daddi et al. 2004b ), and the study of the rest-frame -band morphology as a function of redshift based on HST/ACS imaging of the CDFS field (Cassata et al. cassata (2004)).
The sample presented in this paper is formed by all the extra-galactic objects with a redshift measured from optical (or near-infrared) spectra obtained by our team in the framework of the K20 survey: the total sample includes 545 objects, 347 in the CDFS and 198 in the Q0055 field. We obtained optical spectra for 525 objects and identified 501 of them, including 45 stars. In addition, it was necessary to apply a further redshift restriction () in order to perform the spectral classification, since the wavelength range with the spectral features used for classification cannot be seen in our optical spectra at higher redshifts. Some relevant numbers are given in Table 1.
|
-
(a)
stands for ‘z-quality’: galaxies with secure redshifts have .
3 Spectroscopic observations and data reduction
The spectroscopic observations were obtained at the ESO Very Large Telescope (VLT) UT1 and UT2 equipped with FORS1 (in MOS mode, using 19 movable slitlets) and FORS2 (in MXU mode, where up to 50 targets could be simultaneously observed through a laser-cut mask), respectively. The optical spectroscopy was collected during 20 nights distributed over a period of four years (1999-2000, 2002), and different set-ups were adopted: in particular, a slit width of 1 arcsec and the grisms 150I, 200I and 300I were used, providing dispersion of 5.5, 3.9, 2.6 Å/pixel and spectral resolution of R=260, 380, 660 respectively333See the ESO web page http://www.eso.org/instruments/fors/inst/grisms.html for more details.. The integration times were generally comprised between 15 minutes and 8 hours, depending on the brightness of the sources. Dithering along the slits between two fixed positions was adopted, whenever possible, for the spectroscopy of faint objects in order to efficiently remove the CCD fringing and the strong sky lines in the red part of the spectra.
The data reduction was carried out using IRAF444IRAF is distributed by the National Optical Astronomy Observatories, which are operated by the Association of Universities for Research in Astronomy, Inc., under cooperative agreement with the National Science Foundation. tasks and treating separately each slit in the masks. The frames were bias-subtracted and flat-field corrected in the standard way. Cosmic ray removal was performed on the individual images using the IRAF script xzap from the DIMSUM package555Deep Infrared Mosaicking Software, a package written by Eisenhardt, Dickinson, Stanford and Ward, available at http://iraf.noao.edu/contrib/dimsumV2.. For the non-dithered spectra, the sky background was removed using a third-order polynomial fit along the spatial direction and avoiding the region including the object. When the dithering technique was adopted, the individual exposures were co-added following the classical A-B-B-A procedure, routinely used in near-infrared spectroscopy. As the objects were spatially well sampled, the shift-and-add operation was performed on integer number of pixel basis. After sky-subtraction, all the spectra were optimally extracted (Horne optextr (1986)). The wavelength scale calibration was achieved using the He-Ne-Ar arc spectra, obtained with the same mask configuration as the science observations. These calibration spectra were used to obtain a polynomial dispersion relation with typical r.m.s. values of the order of Å.
A precise absolute flux calibration is a difficult task for spectra accumulated over many nights, with different instrumental set-ups and in varying observing conditions. Only a relative flux calibration was carried out using various standard stars for each run and a correction for the atmospheric extinction was applied using the ESO standard extinction curve. For most of the objects the relative flux calibration appears to be quite good, as demonstrated by the fact that repeated spectra of the same objects agree well with each other, although obtained with different slit/grism. However, we did not try to correct for the slit losses and as a consequence we do not have absolute measurements of the spectral fluxes. Therefore, the present study is mostly focused on flux ratio measurements (line equivalent widths and continuum indices), which are insensitive to absolute flux calibration uncertainties.
Finally, averaging all the useful spectra obtained in each single MOS/MXU exposure, we created a template for the optimal correction of the atmospheric absorption bands around 6870 Å (B-band) and 7600 Å (A-band) for each set of observations. These templates were obtained by fitting a low-order polynomial to the mean spectrum, dividing the average by this smooth continuum, and setting the correction template to the value of this ratio in the telluric band regions, and to unity elsewhere.
4 Redshift determination and spectral features measurement
The majority of K20 objects was very faint with respect to the background, and most of the spectra had rather low signal-to-noise ratio (). Thus, the redshifts have been interactively measured using IRAF tasks, this approach being better at finding real spectral features than a completely automatic identification technique. Moreover, through the visual inspection of the two-dimensional sky-subtracted spectral image it is possible to check the reliability of the identified features.
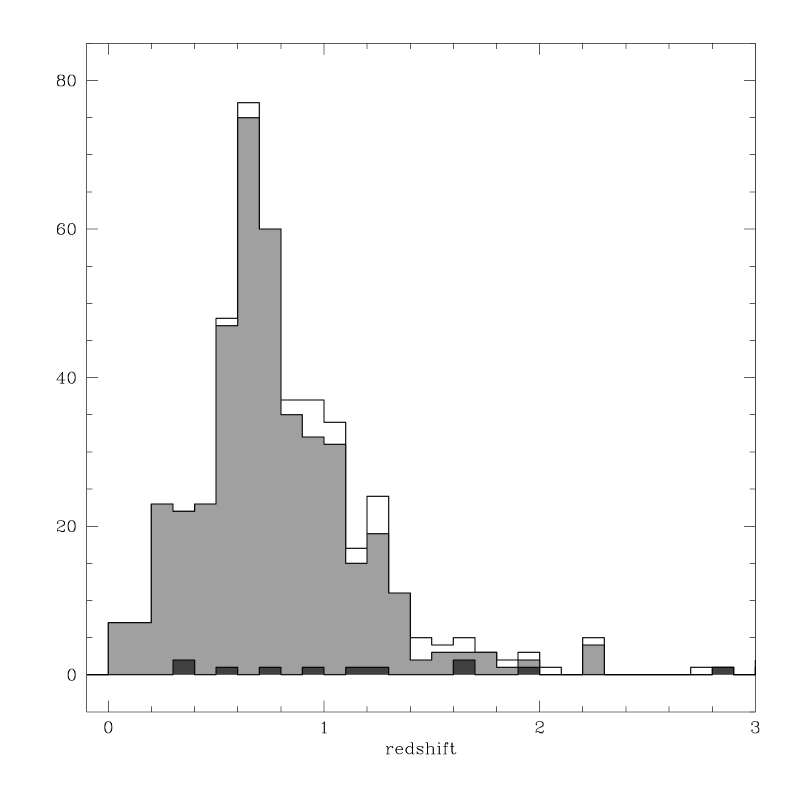
The redshifts derived from absorption line spectra have been obtained using xcsao, by cross-correlating the galaxy spectrum with a set of templates, and following Tonry & Davis (xcorr (1979)). In a first step we used as templates the spectra from Kinney et al. (kinney (1996)), then, to refine the redshift measurement, we adopted as template also the high- composite spectra obtained from our own survey database (see below). For emission-line spectra, the redshift was obtained with the IRAF task rvidlines, by means of multiple Gaussian fitting of the spectral features. All the redshifts were independently identified by two of the authors (MM, AC or ED), cross-checked, and the results were successively validated by at least one other member of the team. At the end of the analysis, the spectroscopic redshifts were divided into two categories: “secure” redshifts (when several features were detected with good confidence) and “lower-quality” redshifts (when only one weak emission-line was detected and ascribed to [OII]3727, or when spectral features were only tentatively identified). Galaxies with “lower-quality” flag () are 32, with respect to the total of 444 galaxies identified in the sample. The redshift distribution of the K20 spectroscopic catalogue is presented in Figure 2 for both the galaxy and quasar samples. As shown in the figure, the average redshift of the galaxies with () is higher than that of the total sample.
During the phase of redshift determination, also a “visual” (and somewhat subjective) spectral classification was attributed to each extragalactic object with secure redshift. This preliminary spectral classification subdivided the objects into: type-1 AGN (i.e. with broad emission lines), emission-line galaxies, early-type galaxies with no emission lines and intermediate galaxies (red, early-type galaxy continuum and emission lines).
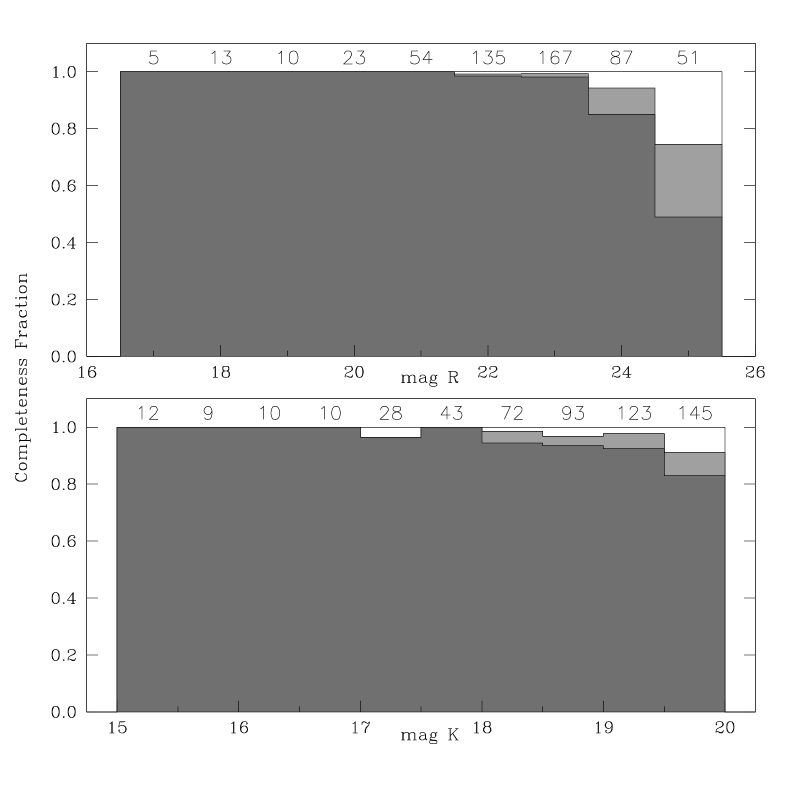
The completeness of the spectroscopic identifications as a function of both and observed magnitudes is shown in Figure 3. Of the observed sample, 97% is identified down to =19.5; this efficiency drops to 91% only in the faintest half-magnitude bin. As expected, and supported by Figure 3, the R magnitude primarily determines the efficiency in the redshift measurements, since most of the unidentified objects are those with the reddest colors (i.e., faintest optical magnitudes), representing the most challenging targets to be spectroscopically identified.
The measurement of the spectral quantities was performed using semi-automatic procedures which exploited the IRAF task splot: first, the continuum was automatically fitted in fixed spectral ranges, but the procedures also allow interactive adjustments of the continuum level in order to improve the line measurement in noisy spectra. Then, the equivalent widths (EWs) and fluxes of the most prominent emission lines were measured using both a Gaussian fitting algorithm and direct integration of the continuum-subtracted line profiles. The fluxes measured with the two techniques were in excellent agreement (in more than 90% of the cases the two values agree to within 15%). The equivalent widths are given in the rest-frame, with positive or negative values for emission or absorption lines respectively. The errors were estimated taking into account both the measured rms of the continuum close to the lines and the difference between the two measurement techniques. We focused our analyses on equivalent width measurements and continuum flux ratios, since the absolute spectrophotometry of our spectra is not fully reliable and not corrected for slit losses.

We measured equivalent widths and fluxes for [OII]3727, H, [OIII]5007, and H+[NII]6548,6583666our spectral resolution did not allow to separate the doublet [NII]6548,6583 from H., as well as the strength of the 4000Å break (; Bruzual Bruzual83 (1983)). In addition, an ultra-violet color index was calculated by measuring the mean continuum intensity in the rest-frame wavelength ranges Å (a range typically used to define a star-formation UV indicator; see Madau, Pozzetti & Dickinson madau (1998)) and Å (the shortward band of the definition):
| (1) |
The continuum flux was measured in fixed spectral ranges, and our procedure computes the average with a sigma-clipping technique, ensuring that spikes due to bad sky subtraction and/or to cosmic rays residuals did not affect the measured values. The errors were then computed from the standard deviation. Figure 4 shows the distribution of measurements of the main spectral features for the entire sample. The median uncertainty for an individual equivalent width is Å. It is worth noting that we have not accounted for the stellar absorption in the measurements of the Balmer emission lines, since the spectral resolution and the low S/N in our spectra do not allow a simultaneous fit of both the absorption and emission components. Usually the effect of the underlying stellar component in absorption is accounted for by applying an ‘ad hoc’ correction to the rest-frame EWs (see Kennicutt K92 (1992), Lamareille et al. 2dFLZ (2004)), but since these correction values are determined from local galaxy samples we preferred to leave the equivalent widths uncorrected. As seen in the top middle panel of Figure 4, only the H line is observed both in emission and absorption. The absence of H in absorption is probably due to the following causes: first, of the 41 galaxies with H measured in absorption, only 8 include H in the spectral range, four of them with a faint (EW4) emission line and four without any measurable feature. Moreover, since on average the EW of the H line in absorption is expected to be similar to that of H (see Charlot & Longhetti CeL (2001) and references therein), it is not surprising that we did not measure H in absorption in the reddest and usually noisy spectral region.
The two color index distributions show a bimodal structure, more evident in the (28-39). This property, already seen both in the observed color distribution (Balogh et al. balogh (2004), Bell et al. bell04 (2004)) and in the intrinsic color indices (Kauffmann et al. kauff (2003)), is a manifestation of underlying blue and red galaxy populations. It is worth to note that the distribution in the K20 survey is remarkably similar to those of optical surveys such as the Stromlo-APM Survey (-selected, Tresse et al. tresse (1999)) and the Sloan Digital Sky Survey (-selected, Kauffmann et al. kauff (2003)). The bimodality in the color indices has been exploited in our endeavor to classify the K20 galaxies in different, and coherent, spectral classes (see below).

In order to estimate our emission-line detection limits, the signal-to-noise ratio in the continuum adjacent to the lines was measured. Figure 5 shows the relation between the S/N in the continuum and the rest-frame equivalent widths for the [OII]3727, the most common line in our sample: from this figure it is clear that the emission line has been detected down to a rest-frame equivalent width of Å for the bulk of the K20 galaxies. The lower envelope of the measured EWs (dotted line in Figure 5) is well represented by the curve
| (2) |
where is the resolution element (in Å) of our spectra and is the significance level of the detectable line, expressed in terms of sigma of the continuum noise (Colless et al. LDSS (1990); see also Manning manning (2002)). We adopt a and, measuring the S/N in the continuum of the spectra without a detectable emission line, we can estimate the EW upper limits also for these galaxies.
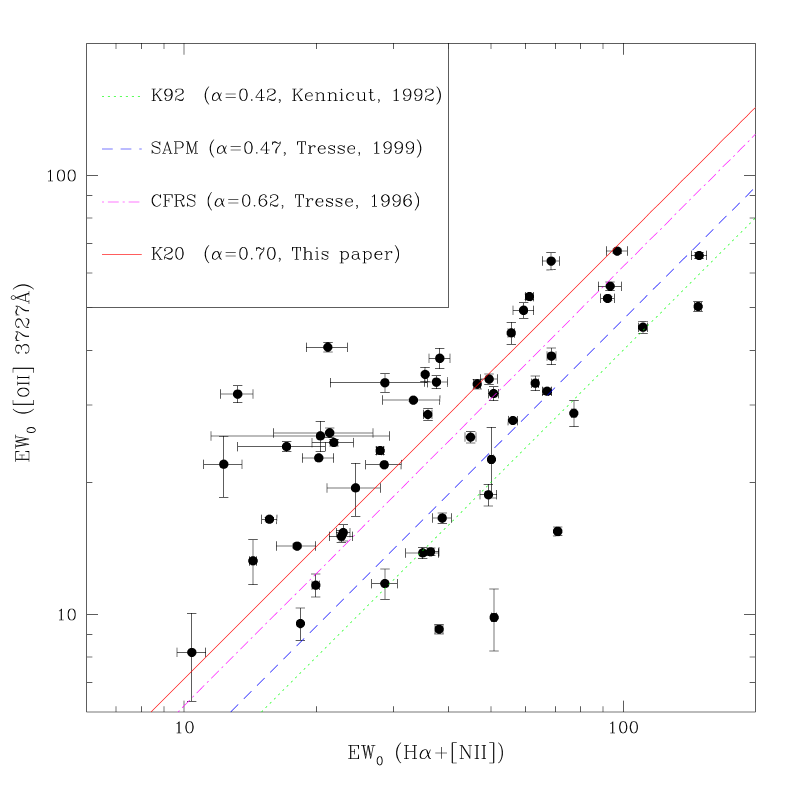
Figure 6 displays the rest-frame equivalent widths of the [OII]3727 line and H+[NII]6548,6583 complex for the star-forming galaxies belonging to the K20 sample: the solid line was obtained by fitting the data with an error-weighted linear regression which yields, although with a large dispersion (r.m.s. = 21Å), the best-fit relationship
| (3) |
The [OII]3727 line is often used as an indicator of star formation activity since it is the most prominent near-UV line, being visible in optical spectra of high-redshift galaxies, where H becomes inaccessible. A relationship between the equivalent widths of the two emission lines was calibrated in local spectroscopic surveys (i.e. Kennicutt K92 (1992), K92). In Figure 6 we show, along with the best-fit to our data (solid line), the relationships found in literature, such as those obtained by K92 for a local sample of galaxies (, dotted line), by Tresse et al. (tresse (1999)) for the Stromlo-APM survey (SAPM, , dashed line) and Tresse et al. CFRSXII (1996) for the Canada-France Redshift Survey (the CFRS sub-sample with and , dash-dotted line). The correlation between ) and EW(H) in the K20 survey is significantly different from that measured locally. Moreover, the various samples suggest a trend with redshift, since in our sample the median redshift of the galaxies with H in the observed spectral range is . In view of these results, the relationship for local galaxies calibrated by Kennicutt (K92 (1992)) cannot be simply extrapolated to higher redshifts to estimate the star formation rate. This is not a new result: it confirms the conclusions drawn by Tresse et al. (tresse (1999)), but it is important to point out that the K20 data confirms the trend to higher redshifts. This tendency is also confirmed by near-IR spectroscopy of a sample of high-redshift () galaxies from the CFRS (Tresse et al. (tresse02 (2002)).
These differences in the average ratio between EW([OII]) and EW(H) can be ascribed to variations in metallicity or ionization state (see Kewley et al. kewley (2004)). We can confidently exclude that these differences are caused by extinction, because we did not find any redshift dependence in the extinction indicators we measured (i.e., the mean H/H line ratio is similar to the value measured in the K92 sample; see Caira et al., in preparation). It is nowadays commonly believed that this effect mainly reflects an observational bias introduced by the different luminosity ranges bracketed in the various samples rather than a true evolutionary redshift trend, since various authors have clearly shown that the [OII]/H flux ratio correlates with luminosity both in nearby surveys (SAPM survey, Charlot et al. Charlot02 (2002); Nearby Field Galaxy Survey, Jansen, Franx, & Fabricant jansen (2001)) and in high-redshift galaxy samples (Tresse et al. tresse02 (2002)).
5 Galaxy spectroscopic classifications
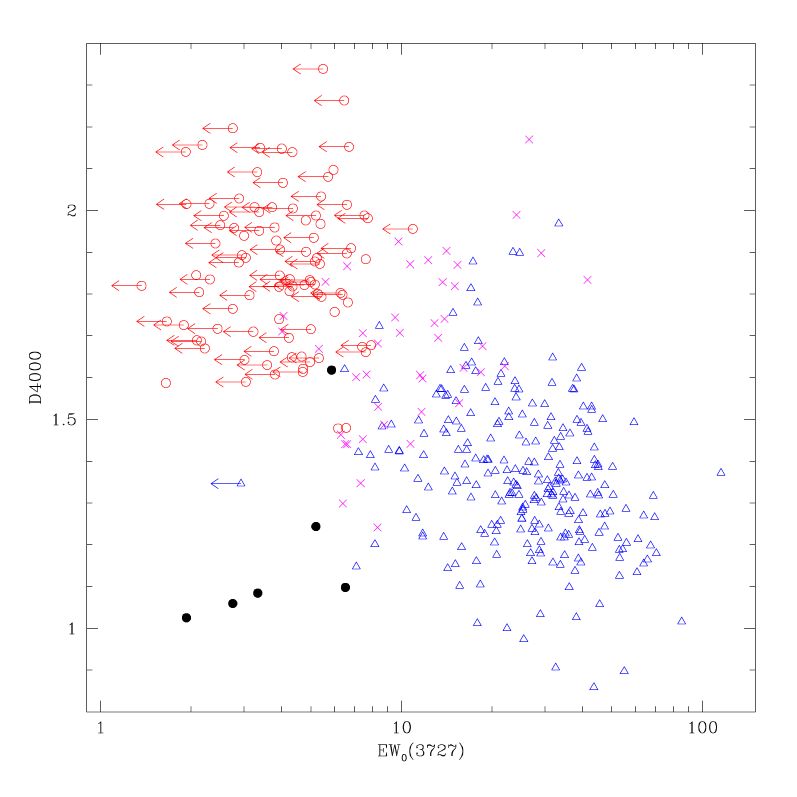
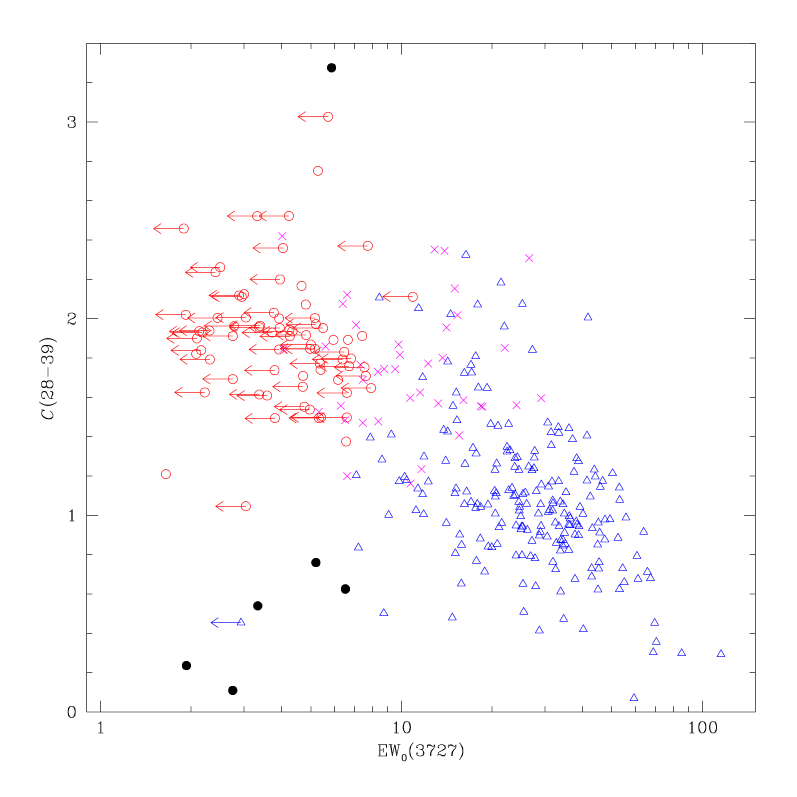
A simple parametric classification scheme was adopted, motivated by the graphs of Figure 8 and Figure 8, where the - and -(28-39) planes are shown, with the different symbols referring to the preliminary visual classification: the filled circles are type-1 AGN, empty circles represent the galaxies with early-type spectra showing no emission lines, empty triangles the galaxies with blue emission-line spectra, and crosses the intermediate objects, with both a red continuum and emission lines. As expected, the continuum indices correlate with the [OII]3727 equivalent width (and also with the H+[NII]6548,6583 EW, due to the relationship between the two lines shown in Figure 6). Moreover, although the preliminary classification was obviously based on visual perception of the same spectral features as those plotted in Figures 8 and 8, the segregation of the different spectroscopic classes in the EW-continuum index planes is really satisfactory.
Encouraged by the above findings, we decided to classify the galaxies in our sample according to their position in the four-dimensional parametric space defined by the EWs of the two main emission lines ([OII]3727 and H+[NII]) and by the two continuum indices ( and (28-39)). We included in our analysis only galaxies with , as the region with the spectral features most useful for classification ( and EW([OII])) can be seen only up to this redshift in the optical band. In the subsequent discussion, we will use the sample of galaxies with secure redshift in the range (402 objects). A four-digit code has been assigned to each galaxy of the sample. Each single digit can take one of three values: 0, 1, and 2, if the corresponding spectral feature is outside the spectral range, is typical of a red passive early-type galaxy or is indicative of a blue active emission-line galaxy, respectively. After a careful analysis of Figures 8 and 8 and after few trials in order to minimize the differences between the old and new classification systems, we fixed the following limits: the leftmost class digit is equal to 1 if [OII]3727Å, the second digit is equal to 1 if Å, the third digit is equal to 1 if and the rightmost digit is equal to 1 if (28-39); each digit value is set to 2 otherwise. We consider a galaxy to be classifiable according to this scheme only if its code includes at least two non-zero digits. Three main spectroscopic classes have thus been identified:
-
•
Red, passive early-type galaxies: all non-zero digits are equal to 1. The galaxies belonging to this group are not currently undergoing significant star formation detectable with the typical sensitivity of our spectra and thus we qualify them as passively evolving.
-
•
Blue, emission-line galaxies: all non-zero digits are equal to 2. These galaxies are undergoing some level of star formation, as witnessed by the relatively intense emission lines and blue continuum indices.
-
•
Emission-line galaxies with a red continuum: the two leftmost digits (related to the emission lines) are set to 2, whilst the last two digits (continuum indices) are equal to 1. These galaxies show an antithetical behavior in the stellar/gaseous components and usually present intermediate spectral properties.
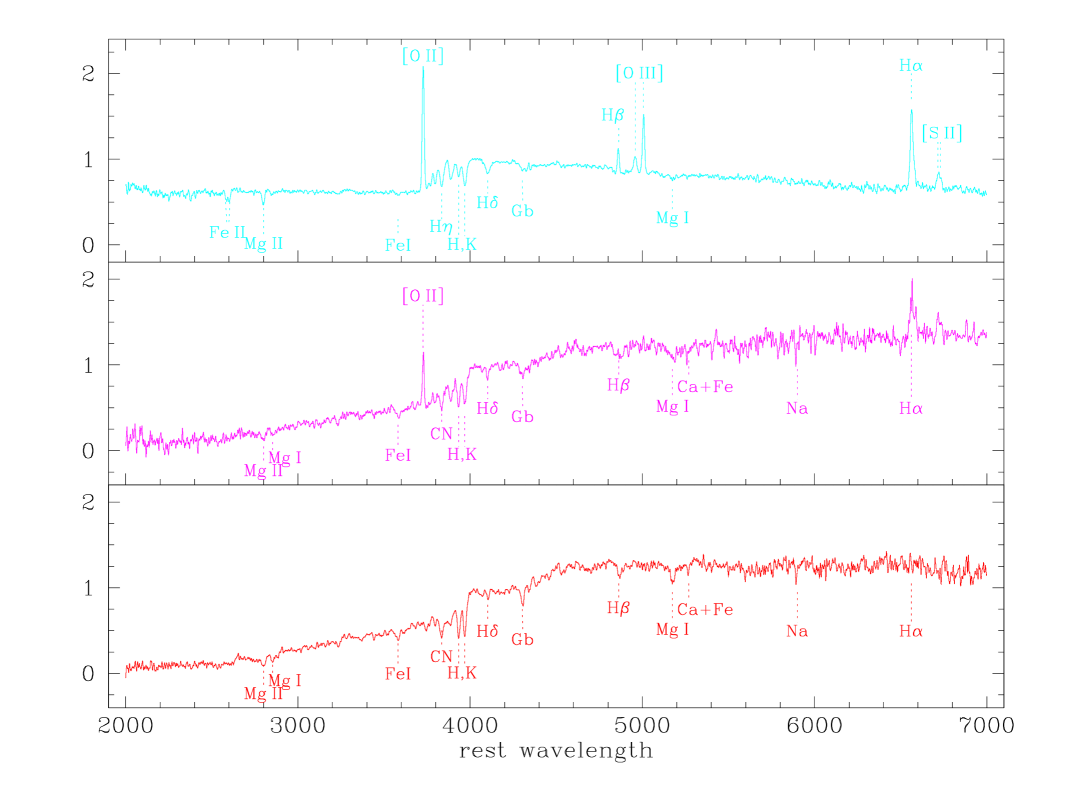
Table 2 lists the number of K20 galaxies belonging to each spectroscopic class, and the composite spectra (see following paragraph) of the three main galaxy types are plotted in Figure 9. The continuum in the composite of the emission-line galaxies with red continuum indices is almost indistinguishable from that of the purely passive galaxies composite. Therefore, this class of intermediate objects should be mainly composed of elliptical galaxies undergoing a modest star-formation episode rather than of heavily reddened star-forming galaxies. There are 45 objects with emission lines and red , and they represent 15% of the whole emission-line galaxy population (45/(45+246), see Table 2); this percentage is in good agreement with the result found in the analysis of the local blue-selected SAPM galaxies (see Figure 11 of Tresse et al. tresse (1999)).
The strength of this classification system is highlighted by the fact that only 18 out of 402 examined galaxies are not included in one of the three main parametric classes. These “outliers” are composed by a heterogeneous mix of objects, such as galaxies with very blue continuum and no emission lines (possibly Post-Starburst galaxies), or emission-line galaxies with a red (28-39) but without a strong , a spectral shape that is suggestive of star formation extincted by dust. Indeed, to the latter group of galaxies belong most of the dusty starforming EROs identified in the K20 survey (Cimatti et al. 2002a ). Possibly, some of the unclassified spectra are affected by noise or flux calibration problems.
A detailed morphological analysis of the K20 galaxies located within the CDFS sky region was performed, exploiting the public GOODS HST/ACS imaging available in that field (Cassata et al. cassata (2004)). The comparison between morphological and spectroscopic classification shows an excellent agreement: in particular, the objects belonging to the spectral class of early-type galaxies are almost all identified with spheroids (elliptical, S0 and bulge-dominated spirals). Galaxies with emission-line spectra appear to correspond to a more heterogeneous population of visual morphologies, but the large majority of them (92%) are associated with late-type and irregular ones.
Finally, we did not attempt to sub-divide the galaxies with emission lines into Starburst, type-2 Seyfert and LINER classes; given the large redshift range observed and the spectral window limited to the optical, in the majority of the objects not all the diagnostic lines required for an accurate spectral classification were present in the spectra.
|
6 Composite spectra
Two composite spectra were generated for each galaxy class by deriving both the mean and median of all of the spectra included in that class. We found that the two resulting composite spectra do not differ significantly when at least 20 spectra were combined. Only the brightest emission lines ([OII] and H) show slightly smaller equivalent widths in the median composite spectra, as expected due to the skewed distribution of the EWs (see Figure 4). In order to build up the composites, each spectrum was shifted to the rest-frame according to its redshift (with a 2 Å rest-frame bin777At the median redshift of the analyzed galaxy sample (z=0.73), a rest frame bin of 2 Å is only slightly less than the typical pixel size used in the spectroscopic observations.), and normalized in the 4000-4500 Å wavelength range, which is always present in the observed spectroscopic window. To each individual spectrum was assigned the same weight, thus avoiding biasing the final composite towards the brightest galaxies. Finally, all the spectra belonging to a common spectroscopic class were stacked, and along with the average (median) spectrum, also a sigma (semi-quartile) spectrum was computed.
Hereinafter we adopt the mean composite spectra, but all of the following results would apply equally if the median composites were used. In Figure 9 the average spectra of the three main spectroscopic classes are plotted.
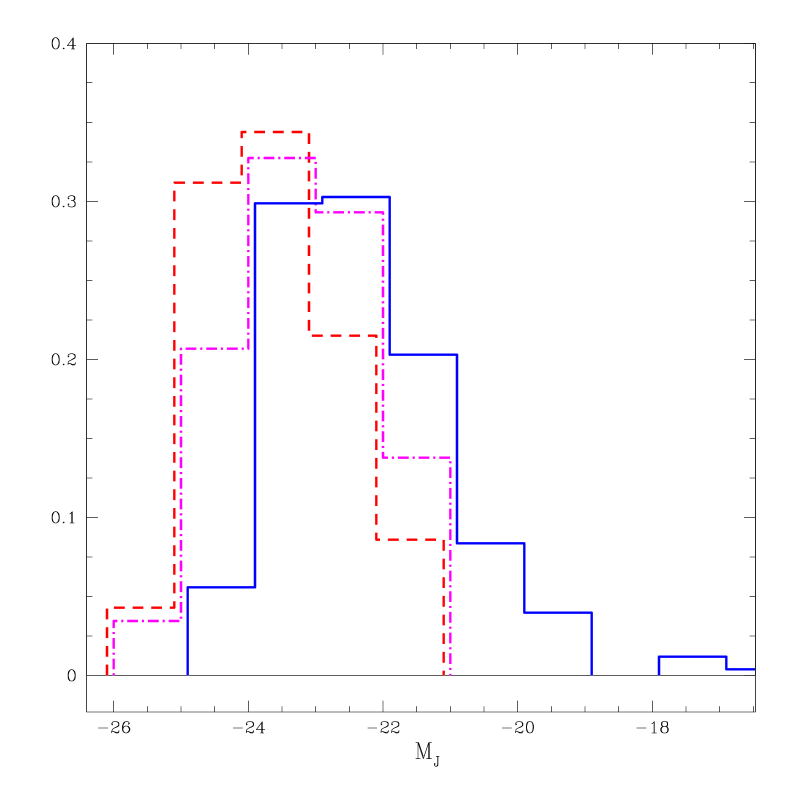
Figure 10 shows the frequency distribution, for the different spectroscopic classes, of the absolute magnitude computed in the rest frame -band following Pozzetti et al. (K20_5 (2003), Paper V). The distribution of the blue emission-line galaxies and that of the early-type galaxies (both passive and with emission lines) are significantly different (the Kolmogorov-Smirnov test indicates that the two distributions differ at much more than 99.9 per cent confidence), red galaxies being, as expected, more luminous on average than star-forming ones.
|
-
(a)
- color, measured in a 2″diameter aperture.
-
(b)
stands for ‘z-quality’, the reliability of the redshift determination.
-
(c)
spectroscopic class (see text).
-
(d)
hyperlink to the spectrum FITS file.
7 Release of the spectroscopic catalogue
An excerpt from the spectroscopic catalogue of the Q0055 field is presented in Table 3; the full catalogues (for both the CDFS and Q0055 fields) are available at the K20 web site http://www.arcetri.astro.it/∼k20/. In detail the content of Table 3 is as follows:
-
•
Column 1: Internal K20 identification number;
-
•
Column 2-3: Right ascension and declination (equinox 2000.0);
-
•
Column 4: Total (SExtractor BEST) -band magnitude;
-
•
Column 5: - color, measured in a 2″-diameter aperture;
-
•
Column 6: Redshift;
-
•
Column 7: Redshift quality flag: “1” indicates a solid redshift determination, “0” a tentative redshift determination and “-1” no redshift determination;
-
•
Column 8: Spectroscopic classes as assigned in Section 5: “0” is for objects classified as stars, “1” is for red passive early-type galaxies (four-digit classification = 1111), “2” for blue emission-line galaxies (2222), “1.5” for intermediate galaxies with emission lines but red continuum indices (2211), ”3” for galaxies which are not included in one of the three previous classes and ”4” is for broad-line AGN. We recall that objects with only a tentative redshift () are not classified.
-
•
Column 9: In the web catalogue the last column contains a hyperlink to the one-dimensional object spectrum, which can be downloaded as a FITS file.
8 Evolution of the spectral properties of the K20 spectroscopic sample
The majority of the spectra in the K20 survey was of relatively low and consequently the measurement of the individual spectral parameters was subject to substantial uncertainties. Therefore we decided to explore the average spectral evolution of different populations using the higher composite spectra of galaxy classes. The average spectra of spectroscopic subsamples selected by redshift and/or luminosity are known to be well suited to study the mean properties of galaxy populations, and the following discussion is based mainly upon such composites. An analysis of individual object spectra can be found in Caira (caira (2004)) and Caira et al., in preparation.
8.1 Early-type galaxies
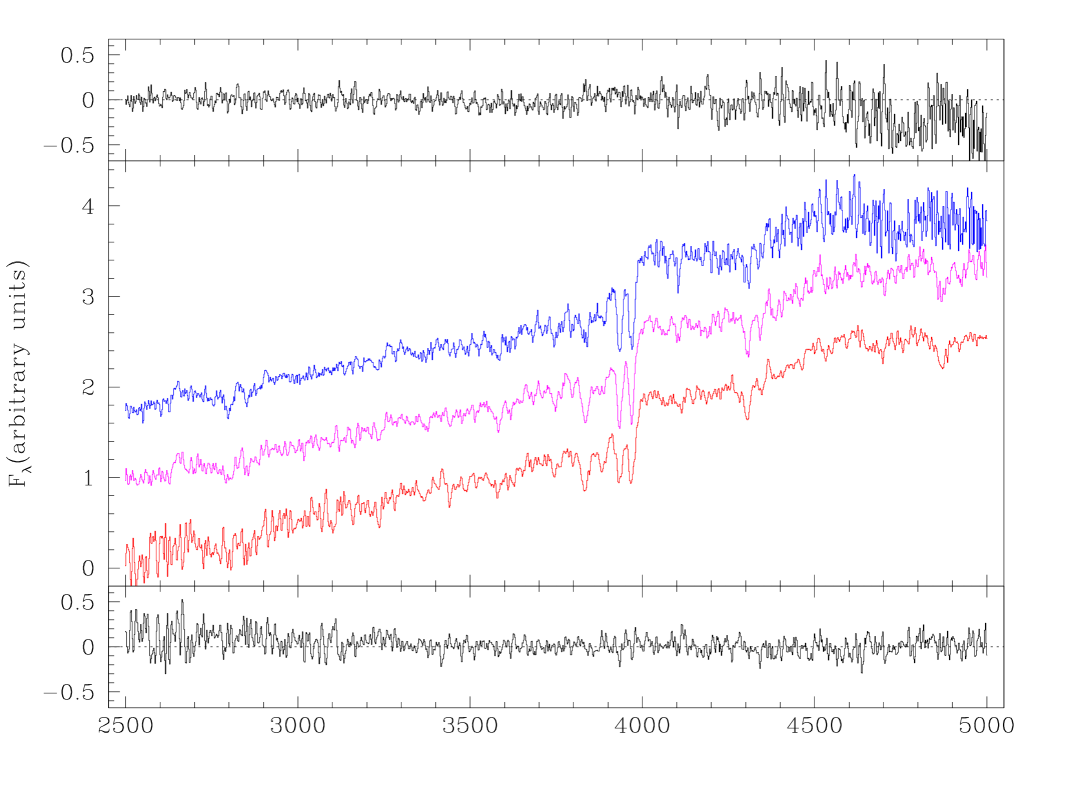
Figure 11 shows the composite spectra of the K20 objects belonging to the class of the early-type galaxies, divided in three redshift bins: in the low-z interval () 18 objects are included, and the median redshift is ; in the high-z interval () 26 objects are included, with . The highest number of galaxies (49) is included in the intermediate-redshift range (), with and with the majority of the objects belonging to the two overdensities which are present in the K20 survey area (see Paper III). The three composite spectra are remarkably similar, as clearly shown by the upper/lower panels of Fig. 11, where the difference spectra between high-z and intermediate-z composites (top), and between low-z and intermediate-z composites (bottom) are displayed. The difference spectra are smooth, with zero mean and the relative variation888 between two composite spectra in contiguous redshift bins is typically smaller than 6% over the full wavelength range. The deviations found at the edges of the difference spectra are probably due to the noise increasing in the blue part of the low-z composite and in the red part of the high-z composite, since the number of spectra contributing to the mean is lower in these wavelength ranges.
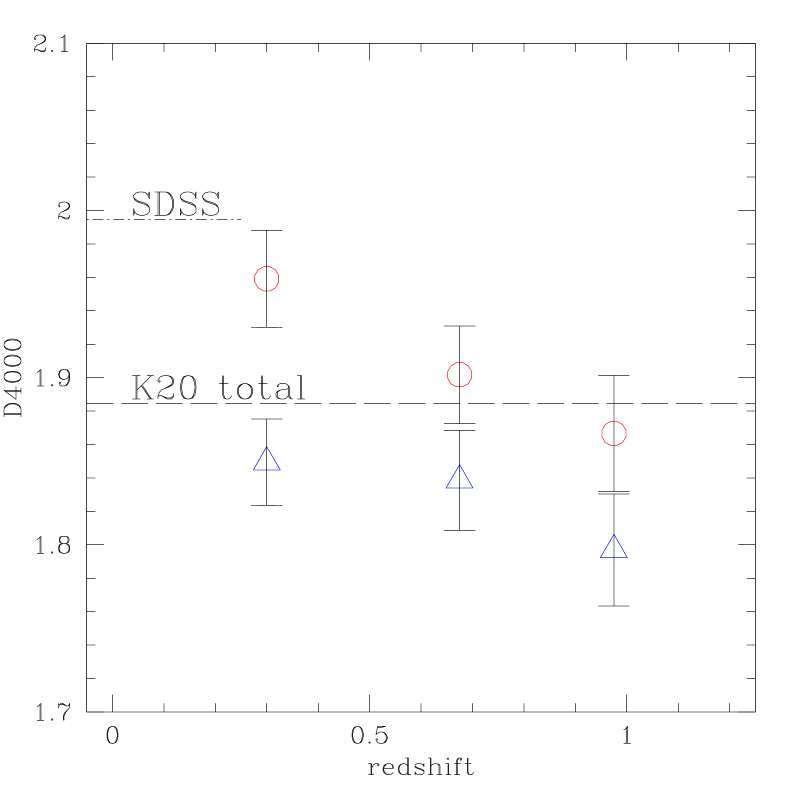
The average composites of the early-type class are also strikingly similar to the Sloan Digital Sky Survey (SDSS) mean spectrum for the same galaxy population (Eisenstein et al. SDSS_E (2003)), although small differences are noted in the 4000Å break and continuum colors, which are systematically bluer in our templates. We decided to further explore the evolution of the K20 early galaxy population by checking the luminosity dependence of the composites: in each redshift bin we divided the galaxies in two equally populated groups, according to their absolute magnitude MJ, and we created the corresponding composites. Figure 12 shows the strengths of the index measured in the six average spectra, where the circles and the triangles represent the brighter and fainter galaxy populations, respectively. It is evident that small (note the different scale of the y-axes in Figure 12 and 8) but systematic differences are present in the index. This plot shows a correlation of the index with both redshift and luminosity; qualitatively, the trend with redshift is consistent with an older stellar population at lower redshift (at fixed metallicity), while the trend with luminosity is consistent with higher formation redshift for the more luminous early-type galaxies.
Such mild evolution up to in the early-type galaxy population, at least in the mean spectral characteristics, is in agreement with the previous results of the K20 survey, namely: 1) the high-redshift formation of the “old” passively evolving EROs (Cimatti et al. 2002a , Paper I); 2) the small, if any, decrease of the number density of the early-type galaxies up to (Pozzetti et al. K20_5 (2003), Paper V); 3) the existence of old, massive spheroidal galaxies at (Cimatti et al. 2004b ) and 4) the change, with redshift and stellar mass content, of the M∗/L ratio in early-type galaxies, suggesting that the stellar population formed at higher redshift in the most massive early-type galaxies (Fontana et al. K20_6 (2004), Paper VI). All the above statements fit into a coherent picture where a substantial number of massive spheroids were fully assembled at redshifts much greater than one, an essential piece of information for the understanding of the formation and evolution of elliptical galaxies (see also Glazebrook et al. GDDS (2004)).
8.2 Blue emission-line galaxies
A different behavior is shown by the average spectra of the class of emission-line blue galaxies. The composite spectra in four redshift intervals are presented in Figure 13. The redshift intervals have been chosen in such a way to have a similar number of objects in each bin, and the galaxies with absolute magnitude , which are observed only locally (), have been excluded; the composite spectra are shown only in the wavelength range in which more than 20 spectra contribute to them. Although galaxies with significantly different star-formation histories are likely to contribute to each composite spectrum, an analysis of these spectra may still give some clues on the average properties of our emission-line galaxies as a function of redshift. The shape of the continuum shows a blueing with redshift, particularly evident in the highest redshift bin, where the spectrum increases toward the blue at wavelengths shortward than [OII]. This is quantitatively seen in Table 4, where the number of objects contributing to the four composite spectra shown in Fig. 13, their median absolute magnitude and the measured value of EW([OII]), and (28-39) are given. While the EW([OII]) is approximately constant in the four spectra, the value of (28-39) in the two high-redshift bins is significantly smaller than the value measured in the low redshift bins.

In order to explain the observed redshift evolution, the four composite spectra of Fig. 13 have been fitted (continuum + absorption lines) using the BC03 models (Bruzual & Charlot BC03 (2003)) with exponentially decreasing star formation with time-scale , a Salpeter IMF with Mup = 125 M☉, solar metallicity, and with ages running up to the age of the Universe at the corresponding average redshifts. In addition, in absence of reliable indicators of extinction (only for a sub-sample of the galaxies in the first redshift bin do we have H in our spectra), we have adopted models with no extinction. As a consequence, the results we briefly discuss below should be taken only as indicative of possible trends. The spectra in the first two redshift bins are well represented by models with , which correspond to a ratio between the current SFR and the past average SFR (the Scalo parameter; Scalo scalo (1986)) in the interval . With the same model, the composite spectrum in the highest redshift bin is better represented with and the corresponding values are in the interval .
|
These fits suggest that, as expected, the high-redshift emission-line galaxies are “younger” and more “active” (i.e., with higher ) than those detected at lower redshift. For a given model, with the same mass function, metallicity and ionization parameter (), we would therefore expect a higher [OII] equivalent width for the high-redshift galaxies (Magris et al. magris (2003)), while the measured equivalent widths in the four composites are similar to each other (see Table 4). The observed values of the [OII] EW (30Å) suggest that the average metallicity of the galaxies in the four composite spectra are solar or sub-solar (see Figure 8 in Magris et al. magris (2003)). From the dust-free models computed by Magris et al.999See http://www.cida.ve/∼magris/ademis/datafile1.txt., we find that the expected [OII] equivalent width for the best-fit models of the high-redshift composite is indeed of the order of Å for , while they are of the order of Å for the low-redshift composite. The higher observed equivalent width would apparently require a somewhat lower average metallicity for the low-redshift objects. Since the low-luminosity galaxies are included only in the lower redshift bins, this effect might be induced by the luminosity-metallicity correlation for star forming galaxies (see Kobulnicky kobul (2004) for a recent review of its evolution with redshift). To better evaluate the possibility of a luminosity effect in our composite spectra, in each redshift bin we have further subdivided the galaxies in two equally populated sub-samples ( objects in each sub-sample) as a function of absolute magnitude MJ. Indeed, we find that the average spectra of the faint galaxies are bluer in all redshift bins, with higher [OII] equivalent widths, except for the highest redshift bin in which the two values for the bright and faint sub-sample are consistent with each other. In addition, in the low redshift composites the [OIII]/H ratio is significantly higher in the sub-sample of fainter galaxies, consistently with the expectations from a metallicity - luminosity correlation. Note, however, that these differences in the [OIII]/H ratio can also be due to different average values of the ionization parameter . A more detailed analysis of the properties of the star-forming galaxies in our sample will be presented elsewhere (Caira et al., in preparation).
9 Conclusions
In this paper we presented a spectroscopic study of galaxies selected in the K20 survey, based on the optical data obtained at the ESO VLT with the FORS1 and FORS2 spectrographs. The K20 sample includes 545 objects down to , and we observed 525 of them, providing 501 redshift identifications. The spectroscopic completeness is therefore 92%, the highest to date for surveys selected in the near-infrared. The identified sample includes 45 stars, 12 broad-line AGN and 444 “normal” galaxies, 412 of which have highly reliable redshifts. The spectral catalogue, with derived redshifts and reduced spectra, has been released to the community (http://www.arcetri.astro.it/∼k20/).
The main results of this work can be summarized as follows:
-
1.
The spectroscopic catalogue of the K20 survey, now released, includes the following set of measurements: redshifts, equivalent widths of four optical lines (from [OII] to H), two continuum indices ( and (28-39)) and a spectral classification. This large collection of information, along with the high completeness of the spectroscopic sample, provides a powerful tool to investigate the nature and evolution of the extragalactic population.
-
2.
We defined a “fair” spectroscopic classification, which makes use of four spectral parameters to objectively divide the galaxies in three main classes; all but 18 of the K20 galaxies can be placed in one of the following categories: 1) early-type galaxies, with only absorbing lines and red continuum; 2) star-forming galaxies, with emission lines and blue continuum; 3) intermediate galaxies, with emission lines but red continuum, similar to that of the objects belonging to the first group.
-
3.
Composite spectra for the three main spectroscopic classes have been computed and used to improve the redshift determination. These templates are publicly released along with the spectroscopic catalogue.
-
4.
Using the composite spectra divided into redshift bins, we found that the average spectra of the early-type galaxies are remarkable in their similarity, and only small but systematic differences with redshift are detected in the ; qualitatively such differences are consistent with the ageing of the stellar population. Conversely, the star-forming galaxies included in the class of objects with emission lines and blue continuum indices show a clear and monotonic “blueing” of the continuum with increasing redshift. We compared the emission line galaxy composites with simple dust-free models from BC03, finding that the galaxies at high redshift are more active (i.e., have a higher ratio between the current and the past average SFR) than those included in the lower redshift bins. The observed values of the [OII] equivalent width also suggest a solar or sub-solar metallicity of the galaxies, with a somewhat lower average metallicity for the low- objects in order to explain the approximate constancy of the [OII] EW throughout the redshift intervals. This may be at least partly due to the metallicity-luminosity relationship for star-forming galaxies. However, we stress that at this stage these interpretations should be taken only as indicative of possible trends, as they strongly depend on the assumptions made about the extinction and ionization.
Most the aspects of the spectroscopic analysis of faint galaxy samples presented in this paper will be investigated further by the current and future massive spectroscopic survey, (i.e. SDSS; VIMOS VLT Deep Survey, Le Févre et al. VVDS (2004)), even though none of these giant projects owns, to our knowledge, the dual characteristic of selection in the near-infrared band and high level of spectroscopic completeness which make the K20 survey such a powerful instrument for the study of galaxy evolution.
Acknowledgements.
We thank the VLT support astronomers for their kind assistance and competent support during the observations. We are grateful to C. Vignali and G.M. Stirpe for his careful reading of the paper and P. Ciliegi for his help with Figure 1.References
- (1) Abraham, R.G., Glazebrook, K., McCarthy, P.J., et al. 2004, AJ, 127, 2455
- (2) Balogh, M.L., Baldry, I.K., Nichol, R., et al. 2004, ApJ, 615, L101
- (3) Bell, E.F., Wolf, C., Meisenheimer, K., et al. 2004, ApJ, 608, 752
- (4) Bouwens, R.J., Illingworth, G.D., Blakeslee, J.P., et al. 2004, ApJ, 611, L1
- (5) Brusa, M., Comastri, A., Daddi, E., et al. 2002, ApJ, 581, L89
- (6) Bruzual, G., 1983, ApJ, 273, 105
- (7) Bruzual, G. & Charlot, S., 2003, MNRAS, 344, 1000
- (8) Caira, G., 2004, Laurea Thesis, Universitá di Bologna
- (9) Cassata, P., Cimatti, A., Franceschini, A., et al. 2004, MNRAS, 357, 903
- (10) Charlot, S. & Longhetti, M., 2001, MNRAS, 323, 887
- (11) Charlot, S., Kauffmann, G, Longhetti, M., et al. 2002, MNRAS, 330, 876
- (12) Cimatti, A., Daddi, E., Mignoli, M., et al. 2002a, A&A, 381, L68
- (13) Cimatti, A., Pozzetti, L., Mignoli, M., et al. 2002b, A&A, 391, L1
- (14) Cimatti, A., Mignoli, M., Daddi, E., et al. 2002c, A&A, 392, 395
- (15) Cimatti, A., Daddi, E., Cassata, P., et al. 2003, A&A, 412, L1
- (16) Cimatti, A., 2004, in “Multiwavelength Mapping of Galaxy Formation and Evolution”, eds. R. Bender and A. Renzini (ESO/USM/MPE Proc.), astro-ph/0401101
- (17) Cimatti, A., Daddi, E., Renzini, A., et al. 2004b, Nature, 430, 184
- (18) Cristiani, S., D’Odorico, S., Fontana, A., et al. 1995, MNRAS, 273, 1016
- (19) Cohen, J.G., Hogg, D.W., Pahre, Michael A., et al. 1999a, ApJS, 120, 171
- (20) Cohen, J.G., Blandford, R., Hogg, D.W., et al. 1999b, ApJ, 512, 30
- (21) Colless, M., Ellis, R.S., Taylor, K. & Hook, R.N. 1990, MNRAS, 244, 408
- (22) Cowie, L.L., Gardner, J.P., Hu, E.M., et al. 1994, ApJ, 434, 114
- (23) Cowie, L.L., Songaila, A., Hu, E.M. & Cohen, J.G. 1996, AJ, 112, 839
- (24) Daddi, E., Cimatti, A., Broadhurst, T., et al. 2002, A&A, 384, L1
- (25) Daddi, E., Cimatti, A., Renzini, A., et al. 2004a, ApJ, 600, L127
- (26) Daddi, E., Cimatti, A., Renzini, A., et al. 2004b, ApJ, 617, 746
- (27) de Mello, D.F., Daddi, E., Renzini, A., et al. 2004, ApJ, 608, L29
- (28) Dickinson, M., Papovich, C., Ferguson, H.C. & Budavári, T., 2003, ApJ, 587, 25
- (29) Dickinson, M., Stern, D., Giavalisco, M., et al. 2004, ApJ, 600, L99
- (30) Drory, N., Feulner, G., Bender, R., et al. 2001 MNRAS, 325, 550
- (31) Drory, N., Bender, R., Feulner, G., et al. 2004, ApJ, 608, 742
- (32) Eisenstein, D.J., Hogg, D.W., Fukugita, M., et al. 2003, ApJ, 585, 694
- (33) Fontana, A., Pozzetti, L., Donnarumma, I., et al. 2004, A&A, 424, 23
- (34) Franx, M., Labb , I., Rudnick, G., et al. 2003, ApJ, 587, L79
- (35) Giacconi, R., Rosati, P., Tozzi, P., et al. 2001, ApJ, 551, 624
- (36) Giavalisco, M., Ferguson, H.C., Koekemoer, A.M., et al. 2004, ApJ, 600, L93
- (37) Gilli, R., Cimatti, A., Daddi, E., et al. 2003, ApJ, 592, 721
- (38) Glazebrook, K., Abraham, R.G., McCarthy, P.J., et al. 2004, Nature, 430, 181
- (39) Jansen, R.A., Franx, M. & Fabricant, D., 2001, ApJ, 551, 825
- (40) Hammer, F., Flores, H., Lilly, S.J., et al. 1997, ApJ, 481, 49
- (41) Horne, K., 1986, PASP, 98, 609
- (42) Kauffmann, G., Heckman, T.M., White, S.D.M., et al. MNRAS, 341, 33
- (43) Kennicutt, R.C., 1992, ApJ, 388, 310
- (44) Kewley, L.J., Geller, M.J. & Jansen R.A., 2004, AJ, 127, 2002
- (45) Kinney, A.L., Calzetti, D., Bohlin, R.C., et al. 1996, ApJ, 467, 38
- (46) Kobulnicky, C., 2004, in “The evolution of Starbursts”, Proceedings of the Bad Honnef Workshop, astro-ph/0410684
- (47) Lamareille, F, Mouhcine, M., Contini, T., Lewis, I. & Maddox, S., 2004, MNRAS, 350, 396
- (48) Le F vre, O. Vettolani, G. Paltani, S., et al. 2004, A&A, 428, 1043
- (49) Madau, P., Pozzetti, L. & Dickinson, M. 1998, ApJ, 498, 106
- (50) Magris C.G., Binette, L. & Bruzual A.G. 2003, ApJS, 149, 313
- (51) Manning, C.V., 2002, ApJ, 574, 599
- (52) McCarthy, P.J., 2004, ARA&A, 42, 477
- (53) Poli, F., Giallongo, E., Fontana, A., et al. 2003, ApJ, 593, L1
- (54) Pozzetti, L., Cimatti, A., Zamorani, G., et al. 2003, A&A, 402, 837
- (55) Saracco, P., Longhetti, M., Giallongo, E., et al. 2004, A&A, 420, 125
- (56) Scalo, J.M. 1986, Fund. Cosmic Phys., 11, 1
- (57) Somerville, R.S., 2004, in “Multiwavelength Mapping of Galaxy Formation and Evolution”, eds. R. Bender and A. Renzini (ESO/USM/MPE Proc.), astro-ph/0401570
- (58) Songaila, A., Cowie, L.L., Hu, E.M. & Gardner, J.P. 1994, ApJS, 94, 461
- (59) Tonry, J., & Davis, M. 1979, AJ, 84, 1511
- (60) Tresse, L., Maddox, S., Loveday, J. & Singleton, C. 1999, MNRAS, 310, 262
- (61) Tresse, L., Rola, C., Hammer, F., et al. 1996, MNRAS, 281, 847
- (62) Tresse, L., Maddox, S., Le Févre, O. & Cuby, J.-G. 2002, MNRAS, 337, 369
- (63) van Dokkum, P.G., Förster Schreiber, N.M., Franx, M., et al. 2003, ApJ, 587, L83
- (64) Vanzella, E., Cristiani, S., Dickinson, M., et al. 2004, A&A, submitted (astro-ph/0406591)