Multiband Optical Photometry and Bolometric Light Curve of the Type Ia Supernova 2004S
Abstract
We present broad band CCD photometry of the Type Ia supernova SN 2004S, which appeared in the galaxy MCG-05-16-021, obtained during 2004 February 12 to March 22. Multiband and bolometric light curves constructed using our data as well as other available data are presented. The time of B band maximum and the peak magnitudes in different bands are obtained using the fits of light curve and colour templates. We clearly see a strong shoulder in band and a second maximum in band. SN 2004S closely resembles SN 1992al after maximum. From the peak bolometric luminosity we estimate the ejected mass of to be 0.41 .
keywords:
supernovae: general - supernovae: individual: SN 2004S1 INTRODUCTION
In recent years significant progress has been made in the study of Type Ia Supernovae (SNe), but many of their properties remain fairly uncertain. Supernovae of Type Ia are among the most luminous stellar outbursts and because of the homogeneity in their properties (Höflich et al., 1996) have been regarded as standardizable candles for determining extragalactic distances and deriving cosmological parameters. They are thought to be thermonuclear explosions of carbon-oxygen white dwarfs (Hoyle & Fowler, 1960). However, Type Ia supernovae are suspected to be not a perfectly homogeneous group, from both their light curves and spectra (Pskovskii, 1970, 1977; Barbon, Ciatti, & Rosino, 1973; Barbon et al., 1990; Branch, 1981; Elias et al., 1985; Frogel et al., 1987; Phillips et al., 1987; Cristiani et al., 1992). Some SNe have shown significant deviations such as SN 1991T (Filippenko et al., 1992a; Phillips et al., 1992; Jeffery et al., 1992; Mazzali et al., 1995) and SN 1991bg (Filippenko et al., 1992b; Leibundgut et al., 1993; Turatto et al., 1997; Mazzali et al., 1997). The classic Si II and Ca II lines were seen very late and with diminished strength in SN 1991T and its early spectrum was dominated by Fe III lines (Filippenko et al., 1992a; Ruiz-Lapuente et al., 1992) while the nebular phase was very similar to other SN Ia (Leibundgut et al., 1993). SN 1991bg was a strongly subluminous event which established the existence of a wide range of luminosities among Type Ia supernovae (Filippenko et al., 1992b; Leibundgut et al., 1993). SN 1991bg showed an absorption trough near 4000Åwhich was attributed to Ti II ( 4395Å, 4444Åand 4468Å) absorption (Filippenko et al., 1992b; Mazzali et al., 1997). Other supernovae showing remarkable deviations are SN 1999ac, a slow rise and fast decliner (Labbe et al., 2001; Phillips et al., 2003), SN 2000cx, a fast riser and slow decliner had unusually blue (B-V) colours 30 days after blue maximum (Li et al., 2001; Candia et al., 2003), while SN 1986G (Phillips et al., 1987) appeared to have properties between normal supernova and the extreme case of SN 1991bg. SN 1999by is a rare example of a “peculiar”, fast declining SN Ia. Recently Garnavich et al. (2004) presented detailed photometric and spectroscopic observations of SN 1999by. It is one of the few SNe to show significant intrinsic polarization (Howell et al., 2001). Li et al. (2003) describe the even stranger SN 2002cx, which had premaximum spectra like 1991T, a luminosity like SN 1991bg (subluminous event), a slow late time decline and unidentified spectral lines. In spite of these differences in SNe Ia, they still seem to follow a few common patterns in their behavior (Leibundgut, 2000). Of these, the correlation between the linear decline rate and luminosity is the best known (Phillips, 1993). The template fitting or (the number of magnitudes in B band by which the SN declines in the first 15 days after maximum) method (Hamuy et al., 1996a; Phillips et al., 1999), the multi-colour light curve shape correction (Riess et al., 1996, 1998), and the stretch factor (Perlmutter et al., 1997) exploit this property of SNe Ia to determine their luminosities.
In this paper, we report optical photometry of the Type Ia supernova SN 2004S. This supernova (mag 16 on red CCD images) was discovered on 2004 February 3.54 UT by Martin (2004) at Perth Observatory with the 0.61 - m Perth/Lowell Automated telescope in the course of the Perth Automated Supernova Search. The position of the supernova was reported by Biggs (2004) to be R.A. = .50 , Dec. = (J2000). The SN is situated W and S of the galaxy MCG-05-16-021. Spectrophotometry obtained at CTIO by Suntzeff et al. (2004) on February 6.1 UT identifies it as a type Ia supernova with an expansion velocity of 9300 km/sec.
We have carried out multi-colour optical photometric observations during the early decline phase. We have used these in combination with data available in the literature to study the development of the optical light curve. The details of the photometric observations are presented in the next section while the development of the light curve and other properties of the supernova are discussed in the sections to follow.
2 OBSERVATIONS AND DATA REDUCTION
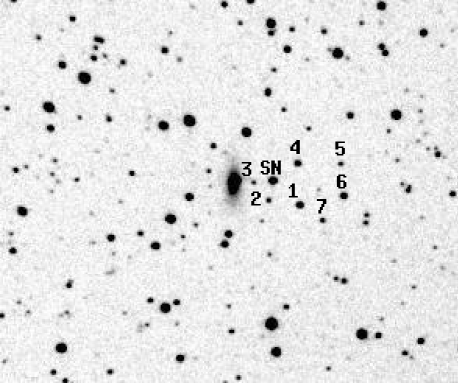
We began optical photometry of SN 2004S approximately eight days after the discovery. The observations were carried out from ARIES, Nainital, India at 27 epochs during the period 2004 February 12 to March 22 using a 1024 1024 CCD camera attached to the f/13 Cassegrain focus of the 104-cm Sampurnanand Telescope. One pixel of the CCD chip corresponds to a square of 0.38 arcsec while the entire chip covers a field of 6 6 on the sky. The gain and read out noise of the CCD camera are 12 electrons per Analogue to Digital Unit (ADU) and 7 electrons respectively. Due to its large negative declination the supernova had to be observed at a low elevation through large airmass. This precluded U band observations, but we were able to carry out photometry at BV bands during most of the nights until March 22, beyond which it became too faint to follow. Exposure times in the early decline phase of the B,V, and band images were 300, 300, 120 and 120s respectively whereas the exposure time was increased considerably in the later phase so as to get a good signal. The exposure time in this phase varied from 10 min in and to 30 min in B and V bands. We observed several bias and twilight flat frames with the CCD camera to calibrate the supernova images using standard techniques. Data reduction was carried out using IRAF111IRAF is distributed by the National Optical Astronomy Observatory, USA. and MIDAS softwares. The images were bias corrected and flat fielded using the CCD reduction package in IRAF. For photometric calibrations we have used comparison stars 1, 2, 4, 5, 6 and 7 of Krisciunas (2004a). The standard magnitudes for the local calibrators as determined by Krisciunas (2004a) are given in Table 1 corresponding to the stars marked in the finder chart in Figure 1. The calibration stars were observed along with SN 2004S. The instrumental magnitudes of SN 2004S and the comparison stars were estimated using aperture photometry in IRAF. We determined the zeropoints for our system on each observing night by matching the instrumental magnitudes to the values given in Table 1 to obtain the standard magnitude of the SN. The difference in the measured (, , and ) and standard (, , and ) BV magnitudes of calibration star 1 is plotted in Figure 2. We see that the difference is consistent with zero, with standard deviations 0.02, 0.04, 0.05 and 0.06 mag in B, V, and passbands respectively. These standard deviations were added in quadrature to the instrumental errors in order to get the final estimates of error in the determined magnitudes in different bands. The resulting BV magnitudes of SN 2004S based on our observations are provided in Table 2 along with errors.
| Star No. | B | V | R | I |
|---|---|---|---|---|
| 1 | 16.44 | 15.61 | 15.16 | 14.74 |
| 2 | 18.50 | 17.45 | 16.79 | 16.22 |
| 3 | 18.18 | 17.60 | 17.30 | 16.91 |
| 4 | 17.89 | 16.53 | 15.65 | 14.86 |
| 5 | 18.55 | 17.52 | 16.88 | 16.33 |
| 6 | 16.28 | 15.59 | 15.19 | 14.78 |
| 7 | 17.85 | 17.00 | 16.51 | 16.07 |

| Date (UT) | Time in JD | B (mag) | V (mag) | (mag) | (mag) |
|---|---|---|---|---|---|
| 2004 02 12.614 | 2453048.1141 | 14.85 0.022 | 14.58 0.041 | 14.52 0.051 | 14.76 0.062 |
| 2004 02 13.608 | 2453049.1088 | 14.75 0.043 | 14.88 0.061 | ||
| 2004 02 14.632 | 2453050.1328 | 15.17 0.022 | 14.75 0.042 | 14.64 0.051 | 14.85 0.063 |
| 2004 02 15.677 | 2453051.1773 | 14.77 0.052 | 14.85 0.061 | ||
| 2004 02 18.601 | 2453054.1011 | 15.48 0.022 | 14.91 0.041 | 14.91 0.050 | 15.12 0.061 |
| 2004 02 19.605 | 2453055.1055 | 15.71 0.023 | 14.98 0.040 | 15.04 0.051 | 15.11 0.061 |
| 2004 02 20.607 | 2453056.1070 | 15.76 0.022 | 15.01 0.040 | 15.01 0.050 | 15.14 0.061 |
| 2004 02 21.592 | 2453057.0920 | 15.88 0.022 | 15.07 0.040 | 15.00 0.052 | 15.15 0.061 |
| 2004 02 22.632 | 2453058.1327 | 16.00 0.022 | 15.13 0.040 | 15.07 0.050 | 15.10 0.061 |
| 2004 03 01.618 | 2453066.1185 | 15.53 0.042 | 15.15 0.051 | ||
| 2004 03 03.587 | 2453068.0885 | 15.56 0.041 | 15.20 0.050 | 14.96 0.061 | |
| 2004 03 04.612 | 2453069.1134 | 15.78 0.042 | 15.37 0.051 | 15.08 0.061 | |
| 2004 03 08.591 | 2453073.0913 | 15.99 0.049 | 15.56 0.066 | 15.18 0.067 | |
| 2004 03 09.580 | 2453074.0823 | 17.23 0.033 | 16.02 0.041 | 15.62 0.051 | 15.28 0.061 |
| 2004 03 10.579 | 2453075.0814 | 17.31 0.026 | 16.11 0.041 | 15.73 0.051 | 15.34 0.062 |
| 2004 03 11.600 | 2453076.1041 | 17.32 0.028 | 16.13 0.042 | 15.81 0.052 | 15.38 0.064 |
| 2004 03 12.597 | 2453077.1011 | 17.41 0.030 | 16.20 0.041 | 15.87 0.051 | 15.48 0.061 |
| 2004 03 13.611 | 2453078.1154 | 17.47 0.029 | 16.25 0.041 | 15.89 0.051 | 15.47 0.061 |
| 2004 03 14.614 | 2453079.1182 | 17.58 0.028 | 16.30 0.042 | 15.94 0.051 | 15.63 0.062 |
| 2004 03 16.602 | 2453081.1069 | 17.59 0.038 | 16.41 0.044 | 16.05 0.052 | 15.74 0.062 |
| 2004 03 17.615 | 2453082.1200 | 17.62 0.028 | 16.43 0.041 | 16.11 0.051 | 15.80 0.061 |
| 2004 03 18.598 | 2453083.1024 | 17.63 0.027 | 16.43 0.041 | 16.13 0.051 | 15.83 0.061 |
| 2004 03 19.594 | 2453084.0988 | 17.66 0.030 | 16.51 0.041 | 16.17 0.051 | 15.88 0.062 |
| 2004 03 20.597 | 2453085.1018 | 17.73 0.031 | 16.52 0.043 | 16.23 0.052 | 15.96 0.062 |
| 2004 03 21.614 | 2453086.1184 | 17.74 0.028 | 16.56 0.041 | 16.25 0.051 | 15.99 0.061 |
| 2004 03 22.615 | 2453087.1193 | 17.74 0.030 | 16.56 0.042 | 16.30 0.051 | 16.05 0.062 |
3 UBV light curves and Color Curves
Our observations started several days after the discovery so we do not have observations near peak brightness. To estimate the peak magnitude and the peak time in different bands by making template fits it is important to have observations temporally as close to the peak as possible. Late time observations are also important to perform template fitting of the SN light curves. For this purpose, we have used observations of SN 2004S reported elsewhere. This also allows us to cross compare our photometry with other available data in the literature. The U band observations taken from the literature help us determine the total luminosity at selected epochs and hence construct the bolometric light curve. Our observations present a temporally dense coverage. The frequency distribution of our data is N(B, V, , ) = (20, 25, 25, 25). The other observations have been taken from compilations at http://www.astrosurf.com/snweb2/2004/04S_/04S_Meas.htm with contributions from Krisciunas (2004b), Espinoza (2004), Santallo (2004) and Lacruz (2004). The frequency distribution of the data taken from the literature is N(U, B, V, , ) = (18, 20, 20, 23, 20). The BV light curves are shown in Figure 3. U band data taken from the literature are also included for comparison. To determine the value of in template fitting we have assumed an error of 0.05 mag in all the data points available in the literature.
Since we do not have observations around peak brightness we adopted the template fitting method to get the magnitudes at peak. We attempted to fit the different template sets given by Riess et al. (1996) and Hamuy et al. (1996b). Hamuy et al. (1996b) present a family of six BVI templates produced from CCD photometry of seven well-observed events (1992bc, 1991T, 1992al, 1992A, 1992bo, 1993H and 1991bg). These templates were fit to our observed data using a 2 minimizing technique which solved simultaneously for the epoch of maximum brightness in blue band and the magnitudes , and . We refer to these magnitudes as , and in the paper. One set of BVI templates from Hamuy et al. (1996b), that for SN 1992al, provided a much better fit, as judged by the value of the reduced 2, than all others. We also found that the SN 1992al template (Hamuy et al., 1996b) fit our data better than the parametrized multiband templates given by Riess et al. (1996). The time for obtained using templates given by Riess et al. (1996) was two days later than that obtained from Hamuy et al. (1996b) templates. The similarity in behavior between SN 2004S and SN 1992al is remarkable. Even in band, where the difference between SN Ia are more pronounced (Suntzeff, 1996), SN 2004S follows SN 1992al very closely.
Since the complete data set includes data from different telescopes and different filter systems in different instruments there can be systematic differences in the estimated magnitudes (Suntzeff, 2000). For example, Stritzinger et al. (2002) find systematic difference of 0.05 mag in photometry by two different telescopes (CTIO and YALO), even though the photometry is reduced to the same local standards. A method called “S-correction”, to bring photometry to a standard system, in such cases was suggested by Stritzinger et al. (2002). Krisciunas et al. (2003) and Krisciunas et al. (2004c) have applied these corrections to photometry of various SNe obtained using CTIO 0.9m and YALO telescopes. To assess any such systematic differences between our data set and that from literature, we made B, V, I template fits, discussed above, to these data sets independently. We found no systematic difference in B band magnitudes of the two sets. However, our V magnitudes are fainter by 0.03 mag and magnitudes are brighter by 0.05 mag compared to the literature data set. These differences are comparable to our observational errors. Hence, we do not find it necessary to apply S - correction to our data set while fitting templates to the combined data.
In Figure 3 we have included the BV template fits to the data. The main parameters of SN 2004S as estimated from template fits are listed in Table 4. For a typical SN Ia a two day difference is seen between the times of B and V maximum (Leibundgut, 1988). According to the best fit template, SN 2004S would have reached maximum brightness in band slightly earlier than in B band and roughly two days later in V band.
Since our observations started days after the peak in the B band, we do not have observations at or around the epoch of B band maximum. An excellent match of the SN 1992al light curve shape with that of SN 2004S indicates that the peak in B band occurred at JD 2453039.42. Though individual SNe can be different in their light curve shapes, it seems unlikely that the peak magnitudes , and of SN 2004S as inferred from the overall match of light curves with those of SN 1992al would be much in error. As a consistency check, we compare the colours of SN 2004S at this epoch with those obtained using the intrinsic colour curves of SN Ia population given by Nobili et al. (2003).
Nobili et al. (2003) present the intrinsic colour curves for a sample of 48 well observed nearby SN Ia for 40 days from the epoch of . We estimate total selective extinction along the line of sight towards SN 2004S comparing the observed colours with the intrinsic colour curves given by Nobili et al. (2003). Corresponding selective extinctions were taken as fit parameters. Best fit values of total selective extinctions thus obtained are listed in Column 2 of Table 3. The shapes of observed colour curves are similar to the intrinsic colour curves given by Nobili et al. (2003) except for systematic shifts in individual colour curves due to selective extinction. In Figure 4, observed colour curves are plotted over intrinsic colour curves, corrected for the best fit values of selective extinction.
Independently, light curve template fitting gives , and . From these we calculate another set of using intrinsic colours at (Nobili et al., 2003). These values are listed in Column 3 of Table 3. Comparison of the two sets of selective extinction values shows that the observed colours at are consistent with the intrinsic colours given by Nobili et al. (2003). We find that these values are also consistent with the fitted values in Column 2 of Table 3.
We next calculate the amount of selective extinction expected from galactic extinction law, all along the line of sight towards SN 2004S. Using = 3.1 and = 0.18 0.054 mag, as obtained from fits to colour curves, values of selective extinctions in other colours are calculated and listed in Column 4 of Table 3. We find that these values are consistent, within errors, with those obtained from the colour curve fits listed as Column 2 of Table 3. The estimated reddening in this direction due to our own galaxy from Schlegel et al. (1998) is E(B-V) = 0.101 mag. So a small amount of extinction could arise in the host galaxy of SN 2004S.
Thus, we conclude that the magnitudes at as obtained using the templates of SN 1992al are fairly representative of the sample SN Ia of Hamuy et al. (1996b). Further, we use these magnitudes to calculate the peak luminosity of SN 2004S in 4.
Hamuy et al. (1996b) do not present band templates. In order to compare our band light curve we construct an expected light curve using intrinsic colours (Nobili et al., 2003) and the V band template of SN 1992al (Hamuy et al., 1996b). We use for selective extinction, listed in Column 2 of Table 3. This derived light curve is plotted in Figure 3.
As seen in Figure 3, except for a shoulder days after , the derived band light curve represents the observed data well.
Also seen in Figure 3, is a pronounced second maximum in band displayed by SN 2004S. This second maximum is reached nearly 26 days after the B maximum. The magnitude of the second maximum is given in Table 4. Such behavior has also been noted for some other SNe Ia (Ford et al., 1993; Suntzeff, 1996; Lira et al., 1998; Meikle, 2000; Elias et al., 1981, 1985; Li et al., 2001). The second maxima in the band light curves are usually attributed to a temporary increase in absorption which reduces with the fall in the degree of ionization several weeks after maximum light (Elias et al., 1981; Pinto & Eastman, 2000).

| from fits to | at : | galactic | |
|---|---|---|---|
| colour curves | template fits | extinction law | |
| E(BV) | 0.18 0.054 | 0.20 0.095 | 0.18 0.054 |
| E(B) | 0.34 0.068 | 0.47 0.112 | 0.40 0.122 |
| E(V) | 0.08 0.068 | 0.10 0.031 | |
| E(V) | 0.17 0.073 | 0.27 0.122 | 0.22 0.069 |
| E() | 0.09 0.076 | 0.12 0.037 |
| Discovery Date | 2004 February 3.54 UT |
|---|---|
| Host Galaxy | MCG-05-16-021 |
| Galaxy Type | Morphological type S |
| RA (2000) | |
| Dec (2000) | |
| Offset from the nucleus | .2 W & .5 S |
| Spectrum | Type Ia |
| Radial velocity | 2731 36 |
| from galaxy redshift | |
| (km s-1) | 2730 42 (LEDA) |
| Radial velocity | 2516 (LEDA) |
| corrected for LG infall onto | |
| Virgo (km s-1) | |
| Expansion velocity | 9300 km |
| of the SN | |
| Distance modulus | = 32.94 mag |
| (=65 km s-1 Mpc-1) | |
| Time of B maximum (JD) | 2453039.42 0.64 |
| (from template fitting) | |
| Magnitudes at | = |
| = | |
| = | |
| = | |
| Absolute Magnitudes at | = |
| = | |
| = | |
| = | |
| Adopted Total Extinction | = |
| = | |
| = | |
| = | |
| Magnitude of secondary | 15.020 |
| maximum (from template) | |
| in from | 1.11 |
| template | |
| in from | 1.26 0.061 |
| observations | |
| Decline rate per | B band 0.115 0.029 |
| day 8 days after | V band 0.054 0.014 |
| band 0.055 0.035 | |
| band 0.034 0.048 |
We estimated the characteristic parameter , the number of magnitudes in B band by which the SN declines in the first 15 days after maximum. The fitted template has a of 1.11. We also calculated by taking the B band peak magnitude obtained by the template fit and the observed B band magnitude after 15 days of the B band peak. This gives a value of 1.26 0.061. We estimated the average decline rate in all bands from our observations, using a time baseline of 10 days starting 8 days after the B band peak, when our observations began. These decline rates are listed in Table 4.

4 Absolute luminosity and Bolometric light curve
Assuming =65 km and the radial velocity of MCG-05-16-021 corrected for Local Group infall onto Virgo as = 2516 km as listed in LEDA (http://leda.univ-lyon1.fr/), we find a distance modulus of 32.94 mag. The total extinction estimated using the intrinsic colour curves of Nobili et al. (2003) are mentioned in table 3 (column 2). From these, the absolute magnitudes estimated at the time of in different bands are = , = , = and = . Altavilla et al. (2004) suggests another method for estimating absolute magnitude using a relation between and . Adopting the values of linear fit coefficients of and as given by Altavilla et al. (2004), we obtain = . The values obtained by the above two methods are in good agreement with each other.
Since most of the flux from an SN Ia emerges in optical bands during the first few weeks (Suntzeff, 1996), the integrated flux in UBV bands provides a meaningful estimate of the bolometric luminosity, which is directly related to the amount of radioactive nickel synthesized and ejected in the explosion. Supplementing our data in BV bands and with U band observations reported by Krisciunas (2004b), we construct a bolometric light curve using de-reddened magnitudes and the estimated distance modulus till 40 days after . The first U band observation was 3.105 days after . To estimate the contribution of U band at peak we assumed that the (U-B) colour remains constant from the peak to 3.105 days.

The magnitudes obtained were converted to flux using calibrations by
Fukugita et al. (1995).
The contribution from the U band at is 18.24 and
that from the band is 11.12. We have not
accounted for the contribution from JHK bands. In Figure 5 we show the UVOIR
bolometric light curve as a solid line from 0 to 40 days after
. The dash-dotted line in Figure 5 shows the contribution
derived from the BVI bands alone, as obtained from fitted templates from
to days with reference to . We derive a peak bolometric
luminosity of L = 8.715 x 1042 erg . The bolometric peak is
coincident in time with the B band peak within errors. We use the peak
bolometric luminosity to derive mass using the method outlined
by Branch (1992). It is understood that radioactivity powers the light curve
and near the time of maximum light most of the energy released by the
radioactivity is still being trapped and thermalized. The peak radiated
luminosity is expected to be comparable to the instantaneous rate of energy
release by radioactivity (Branch, 1992). The peak luminosity can be expressed
as
L =
where is a model dependent parameter expected to be of order unity, R is the radioactivity luminosity per unit nickel mass, evaluated at the time of maximum light (the rise time) and is the synthesized mass of . The B band rise time () is related to the post peak B band decline rate () in mag per 100 days as =13+0.7. In the case of SN 2004S = 8.45, which gives a rise time of 18.915 days. For this value of , works out to be 2.108 x 1043 erg . The peak bolometric luminosity determined above then yields = 0.41 for an assumed = 1.
Contardo et al. (2000) have calculated the bolometric luminosity and the ejected nickel mass for several SN Ia from UBVRI bolometric peak fluxes. In Table 5 we compare , , the peak bolometric luminosity and derived for SN 2004S with corresponding values for the sample of Contardo et al. (2000) and two other recent SNe Ia: 1998bu (Hernandez et al., 2000; Leibundgut, 2000) and 1999aw (Strolger et al., 2002). We find that SN 2004S represents a mid range value for , similar to SN 1992A, SN 1992bo and SN 1994D. The subluminous event SN 1991bg is a fast decliner having a smaller value of Nickel mass ejected. SN 1991T, a peculiar and intrinsically bright supernova, has the largest value of derived in the table. More recently, observations of cepheids by HST has revised the distance to NGC 4527, the host galaxy of SN 1991T (Gibson & Stetson, 2001). Also, possible JHK maxima of this supernova have been determined by Krisciunas et al. (2004c). These measurements indicate that SN 1991T was only slightly overluminous, comparable to Type Ia SNe with similar values of . Candia et al. (2003) point out another peculiar case of SN 2000cx as an underluminous event. Candia et al. (2003) have compared the bolometric light curves of SN 2000cx with SN 1999ee and SN 2001el. All three SN have similar , 0.93, 0.94 and 1.13 respectively. However, Candia et al. (2003) also note that the underluminous nature of SN 2000cx requires further confirmation with a better distance estimate to the host NGC 524.
| SN | log | |||
|---|---|---|---|---|
| (mag) | (erg ) | |||
| 1989B | -19.37 | 1.20 | 43.06 | 0.57 |
| 1991T | -20.06 | 0.97 | 43.23 | 0.84 |
| 1991bg | -16.78 | 1.85 | 42.32 | 0.11 |
| 1992A | -18.80 | 1.33 | 42.88 | 0.39 |
| 1992bc | -19.72 | 0.87 | 43.22 | 0.84 |
| 1992bo | -18.89 | 1.73 | 42.91 | 0.41 |
| 1994D | -18.91 | 1.46 | 42.91 | 0.41 |
| 1994ae | -19.24 | 0.95 | 43.04 | 0.55 |
| 1995D | -19.66 | 0.98 | 43.19 | 0.77 |
| 1998bu | -19.35 | 1.09 | 43.18 | 0.77 |
| 1999aw | -19.45 | 0.81 | 43.18 | 0.76 |
| 2004S | -19.05 | 1.26 | 42.94 | 0.41 |
5 Comparison with SN 1992al
As mentioned in section 3 the template of SN 1992al fits best with our data set. We therefore compare the observed and derived properties of these two supernovae in Table 6. For SN 1992al de-reddened and K-corrected apparent magnitudes, colour, decline rate and absolute magnitudes are taken from Hamuy et al. (1996a). The corresponding quantities for SN 2004S are from this work. As we see from the table, the intrinsic properties of these two supernovae are very similar, although SN 2004S may be marginally less luminous particularly in the band. The above comparison reinforces the general conclusion that for SNe Ia with similar light curves the intrinsic luminosities tend to be very similar.
| SN | - | |||||||
|---|---|---|---|---|---|---|---|---|
| 1992al | 1.11(0.05) | 14.60(0.07) | 14.65(0.06) | 14.94(0.06) | -0.05(0.03) | -19.47(0.32) | -19.42(0.31) | -19.13(0.31) |
| 2004S | 1.262(0.061) | 14.04(0.05) | 14.05(0.07) | 14.34(0.09) | -0.01(0.08) | -19.05(0.23) | -18.96(0.18) | -18.58(0.14) |
6 Conclusions
We report photometric observations of SN 2004S which were carried out using
the 1-m Sampurnanand Telescope at ARIES, Nainital during 2004 February 12 to
March 22. UBV light curves have been studied by combining
our data with data available in the literature. We estimate the peak
magnitudes in different bands and time of B maximum using the template fitting
method. The light curve parameter is estimated
to be 1.26 0.061 from our data. The light curve template of SN 1992al
fits quite well to SN 2004S. We present the bolometric light curve which
illustrates the decay of total luminosity of the supernova. The estimated peak
luminosity 8.715 x 1042 erg/sec yields a value of mass
ejected to be 0.41 . Comparing the derived mass of ejected
in different SNe Ia including SN 2004S we notice that for a
given nickel mass, there could be a significant dispersion in peak luminosity,
as the envelope structure and hence the decline rate parameter
could be different in different cases. SN 2004S can be
placed as a mid-range decliner and the ejected mass of also
has a mid-range value in this case.
7 Acknowledgment
We wish to thank J. C. Pandey and S. B. Pandey for their help with the photometric data reduction. Illuminating discussions with Abhijit Saha are gratefully acknowledged. One of the authors (KM) also wishes to thank L. Resmi for several useful discussions. APK and KM acknowledge Dept. of Science and Technology, India for financial support. We are thankful to an anonymous referee for helpful comments and suggestions.
References
- Altavilla et al. (2004) Altavilla G. et al., 2004, MNRAS, 349, 1344-1352
- Barbon, Ciatti, & Rosino (1973) Barbon R., Ciatti F., Rosino L., 1973, A&A, 29, 57
- Barbon et al. (1990) Barbon R., Benetti S., Cappellaro E. et al., 1990, A&A, 237, 79
- Biggs (2004) Biggs J., 2004, IAU Circ. 8282
- Branch (1981) Branch D., 1981, ApJ, 248, 1076
- Branch (1992) Branch D., 1992, ApJ, 392, 35-40
- Cardelli et al. (1989) Cardelli J. A., Clayton G. C., Mathis J. S., 1989, ApJ, 345, 245
- Candia et al. (2003) Candia P. et al., 2003, PASP, 115, 277
- Contardo et al. (2000) Contardo G., Leibubdgut B., Vacca W. D., 2000, A&A, 359, 876-886
- Cristiani et al. (1992) Cristiani S. et al., 1992, A&A, 259, 63
- Elias et al. (1981) Elias J. H., Frogel J. A., Hackwell J. A., Persson S. E., 1981, ApJ, 251, L13-L16
- Elias et al. (1985) Elias J. H., Matthews K., Neubebauer G. et al., 1985, ApJ, 296, 379
-
Espinoza (2004)
Espinoza J., 2004,
http://www.astrosurf.com/snweb2/2004/04S_/04S_Meas.htm - Filippenko et al. (1992a) Filippenko A. V. et al., 1992a, ApJ, 384, L15
- Filippenko et al. (1992b) Filippenko A. V. et al., 1992b, AJ, 104, 1543
- Ford et al. (1993) Ford C. H., Herbst W., Richmond M. W. et al., 1993, AJ, 106, 1101
- Frogel et al. (1987) Frogel J. A., Gregory B., Kawara K. et al., 1987, ApJ, 315, L129
- Fukugita et al. (1995) Fukugita M., Shimasaku K., Ichikawa T., 1995, PASP, 107, 945
- Garnavich et al. (2004) Garnavich P. M., Bonanos A. Z., Krisciunas K. et al., 2004, ApJ, 613, 1120
- Gibson & Stetson (2001) Gibson B. K. & Stetson P. B. 2001, ApJ, 547, L106
- Hamuy et al. (1996a) Hamuy M., Phillips M. M., Suntzeff N. B. et al., 1996a, AJ, 112, 2398
- Hamuy et al. (1996b) Hamuy M., Phillips M. M., Suntzeff N. B., & Schommer R. A. et al., 1996b, AJ, 112, 2438
- Hernandez et al. (2000) Hernandez M., Meikle W. P. S., Aparicio A. et al., 2000, MNRAS, 319, 223-234
- Höflich et al. (1996) Höflich P., Khokhlov A., Wheeler J. C. et al., 1996, ApJ, 472, L81-L84
- Howell et al. (2001) Howell D. A., Höflich P., Wang L., & Wheeler J. C., 2001, ApJ, 556, 302
- Hoyle & Fowler (1960) Hoyle F., & Fowler W. A., 1960, ApJ, 132, 565
- Jeffery et al. (1992) Jeffery D. J., Leibundgut B., Kirshner R. P. et al., 1992, ApJ, 397, 304
- Krisciunas et al. (2003) Krisciunas K., Suntzeff N. B., Candia P. et al., 2003, AJ, 125, 166
-
Krisciunas (2004a)
Krisciunas K., 2004a,
http://www.astrosurf.com/snweb2/2004/04S_/04S_Home.htm -
Krisciunas (2004b)
Krisciunas K., 2004b,
http://www.astrosurf.com/snweb2/2004/04S_/04S_Meas.htm - Krisciunas et al. (2004c) Krisciunas K., Suntzeff N. B., Phillips M. M. et al., 2004c, AJ, 128, 3034
- Labbe et al. (2001) Labbe et al., 2001, BAAS, 33, 1370
-
Lacruz (2004)
Lacruz J., 2004,
http://www.astrosurf.com/snweb2/2004/04S_/04S_Meas.htm - Leibundgut (1988) Leibundgut B., 1988, Light curves of Supernovae Type I, PhD Thesis, University of Basel, Basel
- Leibundgut et al. (1993) Leibundgut B. et al., 1993, AJ, 105, 301
- Leibundgut (2000) Leibundgut B., 2000, ARA&A, 10, 179-209
- Li et al. (2001) Li W. D. et al., 2001, PASP, 113, 1178-1204
- Li et al. (2003) Li W. D. et al., 2003, PASP, 115, 453
- Lira et al. (1998) Lira P. et al., 1998, AJ, 115, 234
- Martin (2004) Martin R., 2004, IAU Circ. 8282
- Mazzali et al. (1995) Mazzali P. A., Danziger I. J., Turatto M., 1995, A&A, 297, 509
- Mazzali et al. (1997) Mazzali P. A., Chugai N., Turatto M. et al., 1997, MNRAS, 284, 151
- Meikle (2000) Meikle W. P. S., 2000, MNRAS, 314, 782
- Nobili et al. (2003) Nobili S., Goobar A., Knop R., Nugent P., 2003, A&A, 404, 901
- Perlmutter et al. (1997) Perlmutter S. et al., 1997, ApJ, 483, 565
- Phillips et al. (1987) Phillips M. M., Phillips A. C., Heathcore S. R. et al., 1987, PASP, 99, 592
- Phillips et al. (1992) Phillips M. M., Wells L. A., Suntzeff N. B. et al., 1992, AJ, 103, 1632
- Phillips (1993) Phillips M. M., 1993, ApJ, 413, L105
- Phillips et al. (1999) Phillips M. M., Lira P., Suntzeff N. B. et al., 1999, AJ, 118, 1766
- Phillips et al. (2003) Phillips M. M. et al., 2003, in From Twilight to Hightlight: The Physics of Supernovae, ed. W. Hillebrandth & B. Liebundgut (Berlin: Springer), 193
- Pinto & Eastman (2000) Pinto, P. A., & Eastman, R. G. 2000, ApJ, 530, 757
- Pskovskii (1970) Pskovskii Y. P., 1970, AZh, 47, 994
- Pskovskii (1977) Pskovskii Y. P., 1977, Soviet Astron., 21, 675
- Riess et al. (1996) Riess A. G., Press W. H., & Kirshner R. P., 1996, ApJ, 473, 88-109
- Riess et al. (1998) Riess A. G. et al., 1998, AJ, 116, 1009
- Ruiz-Lapuente et al. (1992) Ruiz-Lapuente P., Cappellaro E., Turatto M. et al., 1992, ApJ, 387, L33
-
Santallo (2004)
Santallo R, 2004,
http://www.astrosurf.com/snweb2/2004/04S_/04S_Meas.htm - Schlegel et al. (1998) Schlegel D. J., Finkbeiner D. P., Davis M., 1998, ApJ, 500, 525
- Stritzinger et al. (2002) Stritzinger M., Hamuy M., Suntzeff N. B. et al., 2002, AJ, 124, 2100
- Strolger et al. (2002) Strolger L. -G., Smith R. C., Suntzeff N. B., Phillips M. M. et al., 2002, AJ, 124, 2905-2919
- Suntzeff (1996) Suntzeff L. J., 1996, in Supernova and Supernova Remnants, eds. R. McCray and Z. Wang, Cambridge Universiry Press, Cambridge, 41
- Suntzeff (2000) Suntzeff N. B. 2000, in AIP Conf. Proc. 522, Cosmic Explosions, ed. S. S. Holt & W. W. Zhang (New York: AIP), 65
- Suntzeff et al. (2004) Suntzeff N., Globus A., Galli L., Whiting, & Schmidtobreick, 2004, IAU Circ. 8383
- Turatto et al. (1997) Turatto M., Benetti S., Cappellaro E. et al., 1997, MNRAS, 283,1