INAF - Osservatorio Astronomico Brera Via E. Bianchi 46, Merate, IT JILA, 440 UCB, University of Colorado, Boulder \PACSes\PACSit98.70.RzGamma Ray Bursts.
The updated – correlation in GRBs
Abstract
The recently discovered correlation between the rest frame GRB peak spectral energy and the collimation corrected energy in long GRBs is potentially very important, yet awaits confirmation from an independent sample. It may help to shed light on the radiation mechanism of the prompt GRB phase and on the way – and in which form – the energy is released from the central engine. We here present some additional evidence for the correlation (two new bursts) and re-derive the best-fit parameters. The tightness of the correlation is confirmed (sigma=0.1 dex). We show that this correlation allows us, for the first time, to use GRBs as cosmological probes to constrain the expansion history of the universe.
1 Introduction
Since their discovery, GRBs turned out to be incredibly powerful sources, with detected fluences up to erg/cm2 in the –ray band, above few tens of keV. The first spectroscopic measurements of their redshifts (e.g.[1]), besides confirming their cosmological nature, indicated that these events release, in the –ray band, a huge amount of energy, up to erg. This extraordinary energetic content became a challenge for the proposed GRB models. One implicit hypothesis in deriving the GRB energy, from the observed fluence and measured redshift, consisted in assuming that GRBs emit isotropically. However, it was suggested [2] that GRBs might be collimated into a cone of semiaperture . The jet opening angle could be directly estimated, under some simplifying assumptions on few other parameters, from the measure of the achromatic break time in the afterglow light curve [3]. The presence of a jet in GRB outflows, supported by observations in most events [4], allowed to correct the isotropic equivalent energy for the collimation factor, therefore obtaining the collimation corrected energy [5, 6]. These results suggested that GRBs might have a unique energy erg. The study of the rest frame spectral properties of a sample of SAX GRBs [7] (see also [8]) led to the discovery of a correlation between the isotropic equivalent energy and the spectral peak energy, (the Amati correlation).
With the largest sample of bursts with spectroscopically measured redshifts, published spectra and well determined jet break time, we estimated the jet opening angles and derived . We discovered a very tight correlation between and the spectral peak energy [9] (the Ghirlanda correlation). This correlation relates the GRB prompt emission energy – properly corrected for the burst geometry – to its peak frequency. It might be the key to understand some still obscure aspects of the physics and origin of GRBs. Besides, its small scatter and good powerlaw fit allowed to use, for the first time, GRBs as standard candles to constrain the cosmological parameters (see [10, 11, 12]).
2 The Correlation
We collected all the GRBs with redshift measurements and published spectral parameters. In most cases the spectrum is represented by the empirical Band function. The spectrum allows to compute the burst bolometric fluence (i.e. the time integrated flux) and, hence, the isotropic equivalent energy , i.e. . The jet break time, typically observed between 0.1 and 10 days since the burst trigger, is due to the deceleration, by the external ISM, of the GRB relativistic fireball. When the Lorentz factor of the fireball is a change in the time decay slope of the afterglow flux is observed. This characteristic time depends also on the ISM density and on the kinetic energy which is still in the fireball after the prompt emission phase (parametrized through the efficiency ). Therefore, the measure of allows to estimate .
After the publication of the original work of GGL04, the redshifts and spectral parameters of four more bursts were published. We present here the updated correlations (either – and –). A continuously updated version of the correlations and the relative tables can be found at http://www.merate.mi.astro.it/ghirla/deep/blink.htm (with the complete reference list). We use , . The GRBs added to the original sample of 23 (see also [14], [13] ) are:
-
•
GRB 021004 [17], with a rest frame peak energy keV and erg. The jet break time is days, the jet opening angle and, therefore, erg.
-
•
GRB 030323 [16], with a rest frame peak energy keV and erg. The afterglow light curve is relatively flat i.e. indicating a jet break time days, implying and, therefore, erg.
-
•
GRB 040924 [18], with a rest frame peak energy of keV and erg. The afterglow light curve is relatively flat [] up to 1 day, indicating a jet break time day, implying and, therefore, erg.
-
•
GRB 041006 [19], with a rest frame peak energy keV and erg. The jet break time is days, implying and, therefore, erg.
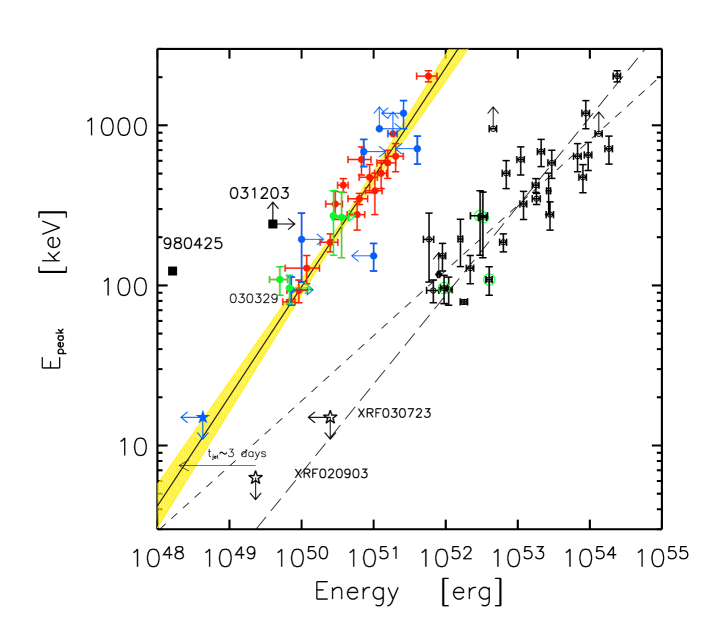
We added the four GRBs to the 23 GRBs of Tab.1 and 2 of GGL04. In Fig. 1 we report the updated correlations. With 27 GRBs (black symbols is Fig. 1) the best fit powerlaw (weighting for the errors on both coordinates) of the – correlation is:
| (1) |
with a reduced (long dashed line in Fig. 1). The least square fit to the same data points (i.e. ignoring the errors on the two coordinates) gives a slope of 0.410.05 (dashed line in Fig. 1).
The Ghirlanda – correlation, updated with two of the four GRBs with known (green filled symbols in Fig. 1), is:
| (2) |
with a reduced (solid line in Fig. 1, shaded region is the uncertainty of this correlation). Least square fit gives a slightly flatter slope of 0.6. The present gaussian fit of the distribution of the perpendicular scatter of the 27 GRB around their best fit (Eq. 1) is . The scatter of the Ghirlanda correlation (Eq. 2), instead, is only (i.e. consistent with what found with the 15 GRBs in GGL04). We stress that the Ghirlanda correlation is well fitted (also with the 2 new GRBs) by a single powerlaw and that its slope, 0.69, is consistent with what found with the 15 GRBs in GGL04. Moreover, the reduced allows its use in cosmology (GGLF04, GGF05 and [12]). This is in net contrast with what claimed by [15] who find for the – fit. Although the authors do not investigate the reason of their statistically unacceptable results, we note that their severe underestimation of the uncertainty on two relevant parameters (i.e. the ISM density and the jet break time) is driving their conclusions. They assume, when unknown, an ISM density with an uncertainty of 50%. This parameter is highly uncertain due to the few measured values (and also in these few cases highly debated). Until precise measurements of this parameter will not be available, it is preferable to let it vary within a relatively large range. This is indeed what GGL04 did in their original work (where ). Moreover, in [15] a few jet break times are reported with unreliably small errors (down to 1%). This means that for some GRBs we could determine a break in their light curves at – say – 1.5 days with an uncertainty of 28 minutes (e.g. GRB 011211), which may be a challenge for the future but which was extremely hard in the past afterglow observational campaigns.
3 Conclusions
We have presented the updated Ghirlanda correlation with 17 GRBs with firm redshift measurements and published spectral parameters. These 2 more events perfectly fit the Ghirlanda correlation as found by GGL04. While waiting for future events, even the present small sample of GRBs have important and intriguing implications for the use of GRBs as standard candles to measure our universe.
Acknowledgements.
We thank Annalisa Celotti & Fabrizio Tavecchio for useful discussions. GG and GG thank the MIUR for the Cofin grant 2003020775_002.References
- [1] \BYGalama T. et al. \INIAUC66551997
- [2] \BYSari R., Piran T. \atqueHalpern J. P. \INApJ5191999L17
- [3] \BYRhoads J. E \INApJ4871997L1
- [4] \BYPanaitescu A. \atqueKumar P. \INApJ5542001667
- [5] \BYFrail D. A et al. \INApJ5622001L55
- [6] \BYBloom J. S. et al. \INApJ5942003674
- [7] \BYAmati L. et al. \INA&A390200281 - A02
- [8] \BYLloyd–Ronning N. M. \atqueRamirez–Ruiz E. \INApJ5762002101
- [9] \BYGhirlanda G., Ghisellini G. \atqueLazzati D. \INApJ6162004331 - GGL04
- [10] \BYGhirlanda G. et al. \INApJ6132004L13 - GGLF04
- [11] \BYFirmani C. et al. \INMNRASin press2005astro–ph/0501395
- [12] \BYGhisellini G. et al. \INThis proceeding2005
- [13] \BYGhirlanda G. et al. \INMNRASin press2005astro–ph/0502488
- [14] \BYGhirlanda G., Ghisellini G. \atqueFirmani C. \INMNRASsubm.2005astro–ph/0502186
- [15] \BYFriedman A. \atqueBloom J. S. \INApJsubm.2004astro–ph/0408413
- [16] \BYAtteia J.L. et al. \INsubm2005astro–ph/0502494
- [17] \BYMirabal N. et al. \INGCN20021618
- [18] \BYWiersema K. et al. \INGCN20042800
- [19] \BYPrice P. et al. \INGCN20042791