Iron-line and continuum flux variations in the RXTE spectra of the black-hole candidate XTE J1650–500
Abstract
We present the results of spectral fits made to 57 pointed observations of the Galactic black hole candidate and X-ray transient XTE J1650500, made with the Rossi X-ray Timing Explorer in 2001 when the source was in a transition from the hard state to the soft state. A strong and variable Fe K emission line is detected in these spectra. The line flux varies in a non-linear way with the hard X-ray flux, in apparent contradiction to the predictions of simple disc reflection models. We observe a change in the overall trend that coincides with changes in the continuum X-ray spectrum and the fast X-ray variability. The Fe-line flux versus hard X-ray flux variations are consistent with the predictions of reflection models which consider high disc-ionization states and with a model which considers gravitational light-bending effects. Indications for an anti-correlation between the Fe-line flux and the hard X-ray flux in the spectrally hardest observations and weak variations in the Fe-line energy (as observed with XMM-Newton and BeppoSAX) slightly favour the light-bending interpretation.
keywords:
accretion, accretion discs – black hole physics – relativity – X-rays: individual (XTE J1650–500) – X-rays: stars1 INTRODUCTION
The energy spectra of several Galactic black-hole candidates and active galactic nuclei (AGN) show evidence of broad, relativistic Fe emission lines (Tanaka et al., 1995; Miller et al., 2002a, b, c; Martocchia et al., 2002; Fabian et al., 2002). In the framework of reflection models, these Fe lines are produced as the result of the reprocessing of hard X-ray emission by cold ( K) material in an accretion disc (George & Fabian, 1991; Reynolds & Nowak, 2003). In the simplest versions of the reflection models, variations in the line strength are expected to correlate linearly with those in the hard X-ray flux. However, the spectral variability of some AGN shows that the Fe line does not always directly trace variations in the irradiating hard X-ray flux. The best known examples of such behaviour have come from ASCA, RXTE, and XMM-Newton observations of the Seyfert 1 galaxy MGC-6-30-15 (Lee et al., 2000; Shih et al., 2002; Fabian et al., 2002).
Two explanations have been proposed for the behaviour observed in MGC-6-30-15 with XMM-Newton. The first one (Ballantyne et al., 2003) assumes reflection of hard X-ray emission by a strongly photoionized accretion disc and relies strongly on the ionized disc models of Ross & Fabian (1993). Simulations have shown that the shape of the reflected spectrum is sensitive to the ionization state of the disc (Ross & Fabian, 1993; Ross et al., 1999), its density profile (Nayakshin et al., 2000; Ballantyne et al., 2001) and the properties of the illuminating radiation (Ballantyne & Ross, 2002). Ballantyne & Ross (2002) showed that the energy, the equivalent width and the flux of the Fe line are expected to depend strongly on the ratio of illuminating flux to disc flux and the photon index of the irradiating emission (which is modelled as a power-law). In particular, they predict that the strength of the Fe line becomes nearly constant and that the Fe-line equivalent width decreases with increasing hard X-ray flux for a broad range of power-law indices.
In the second explanation (Fabian & Vaughan, 2003) it is assumed that the irradiating hard X-ray flux is intrinsically anisotropic. Based on this, Miniutti et al. (2003) proposed a simple model in which gravitational light bending creates such an anisotropy. From their study three regimes of spectral variability are expected: the reflection component can either be correlated, independent or anti-correlated with respect to hard X-ray flux, depending on whether the observed hard X-ray flux is low, medium or high, respectively. Miniutti et al. (2004) showed that this light bending model is able to account for variations in the spectral properties of the black hole candidate XTE J1650–500 as well.
XTE J1650–500 is a Galactic black-hole X-ray transient that was in outburst between September 2001 and June 2002. It was the first transient source to be studied extensively with RXTE for which simultaneous observations with higher resolution spectrometers (XMM-Newton and BeppoSAX) unambiguously revealed a relativistic Fe emission line. For a description of other aspects of the outburst we refer to Kalemci et al. (2003), Homan et al. (2003), Rossi et al. (2003), Tomsick et al. (2003), and Tomsick et al. (2004); for details on the relativistically broadened and redshifted Fe emission line we refer to Miller et al. (2002a) and Miniutti et al. (2004).
In order to test the claim by Miniutti et al. (2004) with more observations we analysed the spectra of 57 RXTE observations of XTE J1650–500 covering the first 30 days of its 2001/2002 outburst. This is the same period in which the source showed strong variability and quasi-periodic oscillations (QPO) in the power density spectra. In the following sections, we detail our analysis procedure and results.
2 OBSERVATIONS AND DATA ANALYSIS
The 57 pointed RXTE observations of XTE J1650–500 used in our study were obtained between 2001 September 6 and 2001 October 5. We used data from the Proportional Counter Array (PCA) (Zhang et al., 1993; Jahoda et al., 1996) and the High Energy X-ray Timing Experiment (HEXTE) (Gruber et al., 1996; Rothschild et al., 1998). For the PCA, we only selected data from proportional counter unit 2 (PCU2). This was the only PCU active in all observations that, unlike PCU0, did not suffer from high background. For HEXTE, we used data from both clusters. We extracted 3–25 keV spectra from PCU2 (Standard 2 mode) and 18–150 keV spectra from HEXTE (default mode) using tools, calibration software, and background models released with LHEASOFT 5.3.1. The spectra were background-subtracted and dead time111Data from all active PCUs were used to estimate the dead time. Even though PCU0 had lost its propane layer, the standard dead time recipe from the RXTE Cook Book was still approximately valid (Keith Jahoda, private communication), leading to correction on the order of 1%. corrections were applied. To account for uncertainties in the response matrix, a systematic error of 0.6% was added to all PCA spectra. The spectra were fitted using XSPEC v11.2 (Arnaud, 1996).
The evolution of the spectral and variability properties over the entire outburst show that XTE J1650–500 underwent two major state transitions (Kalemci et al., 2003; Homan et al., 2003; Rossi et al., 2003). The period that we selected for our analysis includes the transition from the hard state to the soft state, corresponding to groups I/II (2001 Sep. 6 – 2001 Sep. 20) and III (2001 Sep. 21 – 2001 Oct. 2) as defined by Homan et al. (2003) on the basis of variability and X-ray colour properties. During this period, the source was also observed once with XMM-Newton (Sep. 13) and three times with BeppoSAX (Sep. 11, Sep 21, Oct. 3).
2.1 SPECTRAL FITS
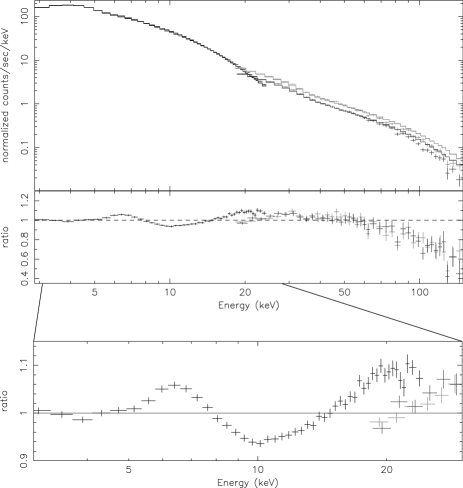
As we were mainly interested in the behaviour of the Fe line with respect to general changes in the continuum spectrum, we chose to fit our spectra with the same simple phenomenological continuum components that were used to fit XMM-Newton and BeppoSAX spectra of XTE J1650–500 (Miller et al., 2002a; Miniutti et al., 2004). These components were a multi-colour discblackbody (diskbb in XSPEC), a power-law (powerlaw) or cut-off power-law (cutoff), and a correction for interstellar absorption (phabs). In our case a multiplicative constant was introduced to account for possible mismatches between the PCA and HEXTE spectra. This constant was fixed to 1 for the PCA spectra and had typical values of around 0.88 for the HEXTE spectra. An example fit with this simple model can be seen in Figure 1. In the top panel, we show the 3-160 keV energy spectrum of XTE J1650-500 from 2001 Sep. 13. The ratio between the data and the model is shown in the middle and bottom panels. The residuals above 50 keV and around 6 keV and 10 keV suggest the presence of a high-energy cut-off, an Fe K emission line, and an Fe K absorption edge, respectively. For a few observations we also tried reflection models (pexriv (Magdziarz & Zdziarski, 1995; Balucinska-Church & McCammon, 1992) and cdid (Ross & Fabian, 1993)), which clearly indicated the presence of a reflection component, including the reflection hump. However, fitting with those models proved to be very time consuming and in the case of the cdid model no separate line flux could be measured (this is also the case for the xion reflection model). In our simplified model, the smeared absorption edge (see below) and the cut-off in the power-law accounted for the reflected continuum.
In keeping with prior work, we modelled the Fe K emission line using a relativistic Fe line (laor) (Laor, 1991) and we also used a smeared edge (smedge) due to Fe absorption. For the laor component we fixed the outer radius () and the inclination (). The inner disc radius, the index and the normalisation of the emission line were allowed to vary, while the centroid energy was constrained to vary in the 6.4-6.97 keV range. For the smedge component all the parameters were left free, except for the index for photo-electric absorption, which was fixed to its default value of -2.67. The threshold energy was constrained to lie in 7.1–9.3 keV range, the maximum absorption factor was set to be lower than 2.0, and the width to be less than 10.0 keV.
Only in spectra obtained prior to Sep. 19 a high-energy cut-off in the power-law was required by the data and for those spectra we used the cut-off power law. The cut-off energy climbed steadily until Sep. 19, and moved out of our bandpass after Sep. 19. After that day, a simple power law was used. In all our fits the neutral column density was fixed to atoms (Miller et al., 2002a; Miniutti et al., 2004).
Using the above model we were able to get fits with values of around 1. However, the results that we obtained for the disc blackbody were not in line with those found from the BeppoSAX and XMM-Newton spectra that were taken around the same time. Especially in the beginning of group I/II, when the disc blackbody had a relatively small contribution in the RXTE bandpass (see Rossi et al., 2003) and could not be constrained very well, we found high values for the inner disc temperature (kT0.8–0.9 keV) and very small values for the inner disc radius (less than 10 km, for an assumed distance of 4 kpc and inclination of 45∘). On Sep.11 and on Sep.13, XTE J1650-500 was observed with BeppoSAX and XMM-Newton, respectively. Both instruments revealed the presence of a disc component in the energy spectrum, and while the values for the BeppoSAX (0.630.03 keV) and XMM-Newton (0.3220.004 keV) spectra are quite different from each other, they are both considerably lower than the values obtained from our RXTE spectra. Increasing the lower energy boundary for the XMM-Newton spectrum to around the lower PCA boundary (3 keV) resulted in a fit with a temperature of 1.2 keV, which suggests that it is the limited sensitivity of the PCA at low energies that gave rise to the anomalous diskbb values. For this reason we decided to constrain the inner disc temperature in group I/II to values between 0.3–0.65 keV. In group III our fits gave reasonable disc parameters without these constraints. Using this model, we obtained values of in the range .
3 RESULTS
In Figure 2 we present the evolution of the spectral parameters relevant to our work. The top panel shows the evolution of the unabsorbed total 2–100 keV flux (filled circles), the 2–100 keV power-law flux (open circles) and the 2–10 keV Fe-line flux (crosses). In the bottom panel the evolution of the power-law index can be seen. This parameter showed two distinct trends: between Sep. 6 and Sep. 18, it rose smoothly from 1.3 to 2.2–2.3, but from Sep. 19 onwards it remained almost constant around this level. This change in behavior coincided with a change in the variability properties (Homan et al., 2003; Rossi et al., 2003).
At the start of our dataset the total flux was dominated by the power-law component: at its peak ( erg cm-2 s-1) the contribution of the power-law flux was around 94% of the total flux. In subsequent observations the total flux decayed and the fractional contribution of the power-law component gradually decreased. On Sep. 18, the power-law flux started to decay more rapidly. At that point it had already had dropped to 36% of its peak value. The rapid decay continued for a few more days, until the power-law flux started to vary erratically between 2 and 5 erg cm-2 s-1with a fractional contribution of 20–40%. The Fe-line flux always contributed around 1–2% of the total flux; the remaining flux was due to the disc component, which dominated after Sep. 19. From Figure 2 one can see that before Sep. 19 the flux evolution of the Fe line did not follow that of the power-law, with a negative correlation coefficient of –0.54, whereas after that day there was evidence of a positive correlation (coefficient of 0.80).
Since XTE J1650–500 behaved rather differently in the time intervals before Sep. 18 and after Sep. 19 we will, in the following, discuss the observations in terms of the two corresponding groups that were introduced by Homan et al. (2003), i.e. groups I/II and III, respectively.

3.1 Relationship between the power-law and Fe-line fluxes


Within the framework of reflection models, the power-law and Fe-line flux variations trace the spectral evolution of the irradiating flux and the reflection component, respectively. To explore the relationship between these two components in XTE J1650–500 in more detail, we obtained the power-law flux in the 7-20 keV energy band (hereafter ) from our fits. This flux represents the hard X-ray photons which can cause inner-shell fluorescence. The fraction of this flux with respect to the total 2–100 keV power-law flux was 0.24–0.28. In Figure 3 we show the Fe-line flux (3a) and the Fe-line equivalent width (3b) as a function of , using filled circles for group I/II and open circles for group III. The fractional error on the Fe-line flux was set equal to the fractional error on the Fe-line normalisation, . We only show data points for which , with the negative 1 error on the normalisation.
As already suggested by Figure 2, we found that the irradiating flux and the Fe-line flux did not correlate in a simple linear way. A linear fit to the data in Figure 3a, although presenting a clear improvement over a fit with a constant (=185/42), only yielded a of 100/41. A power-law fit gave a slightly better of 82/41, but both this fit and the linear one had problems to fit the apparent change in the Fe-line/power-law flux behaviour between the two groups. Qualitatively, in group I/II, the line flux showed little variations (or maybe an anti-correlation - correlation coefficient is –0.54) over a large range of , while there are indications for a positive correlation in group III (correlation coefficient is 0.8). To allow for different behaviour in the two groups we used a broken power-law, which resulted in a of 33/39, with a break at a flux of 2.30.1 erg cm-2 s-1and indices of 0.80.1 and 0.1 below and above the break, respectively. An F-test shows that this fit is better than a single power-law fit with a probability of 99.996%. A broken line gives an equally good fit, while a second order polynomial results in =52/40. Both the broken line fit and broken power-law fit suggest that in group I/II the line flux may be anti-correlated with the irradiating flux. The best fits with a power law and broken power-law are shown in Figure 3a.
In Figure 3b we show the line equivalent width as a function of . The equivalent width had values between 200 eV and 500 eV, with indications for only a moderate increase with . Fits with a constant to group I/II, group III, and all data combined resulted in values of 35711 eV, 28311 eV, and 3208, respectively.
In some of the works that are relevant to the discussion in the next section the equivalent width is calculated from simulated spectra in which the continuum is dominated by a power-law component, either because a disc is not part of the model or the disc does not contribute much in X-rays. In our spectra, however, a prominent (and evolving) disc component is present, especially at the end of group I/II and in group III. We found that changes in the continuum flux around 6–7 keV due to a decrease in the power-law component were (partly) compensated by a simultaneous increase in the disc flux. Hence, the behaviour of our measured equivalent width cannot be directly compared to that from simulations in which there is no other component to compensate changes in the power-law flux. We therefore calculated the flux ratio of the Fe-line and the power-law components, as a measure of the Fe-line equivalent width with respect to the power-law component. The results are shown in Figure 3c and revealed strong decrease in the relative importance of the line at higher values of the power-law flux.
The errors on the Fe-line energy were too large to study its evolution during our observations. The emissivity index of the Laor component varied between 4 and 6 but was in most cases consistent with the value of 5.4 that was found by Miller et al. (2002a).
4 DISCUSSION
We have studied the variability of the Fe K emission line and power-law flux components in RXTE spectra of the Galactic black-hole candidate XTE J1650500. This is only the second time that a large number of RXTE observations of a transient outburst has been analyzed using a relativistic model for the Fe K emission line and a continuum that approximates a full reflection model (Park et al. (2004) analyzed RXTE observations of the 2002 outburst of 4U 1543475 with a relativistic line model).
These studies of 4U 1543475 and XTE J1650500 represent particularly important tests of disc reflection models. Simple disc reflection models (e.g. George & Fabian, 1991) predict a positive linear correlation between the flux of the power-law component (assumed to irradiate the disc) and the flux of the line component. Similar to the case of 4U 1543475, we do not observe a simple, positive linear correlation between line flux and power-law flux. Unlike the case of 4U 1543475, however, we observe a clear and continuous trend: at low power-law flux levels, the line and power-law fluxes are positively correlated; at high power-law flux levels the line flux is possibly inversely related.
New disc reflection models which incorporate the effects of disc ionization (e.g. Ballantyne & Ross, 2002) and realistic disc atmospheres (e.g. Nayakshin & Kallman, 2001) do not necessarily predict simple positive correlations between line flux and power-law flux. The expected line flux depends not only on the ionisation state of the disc, but on the hardness of the flux which irradiates the disc as well. Ballantyne & Ross (2002) predict that line flux becomes nearly constant with increasing power-law flux, and that line equivalent width decreases with increasing power-law flux for a broad range of power-law indices. These predictions are in broad agreement with our results (assuming that the flux ratio plotted in Fig. 3c provides a better means of comparison than the equivalent width plotted in Fig. 3b, which is diluted by the disc component).
Miniutti & Fabian (2004) have developed a reflection model which incorporates the effects of light bending close to a black hole (but does not take into account the effects of disc ionisation). This model predicts that the flux of Fe K emission line is positively correlated with the power-law flux at low values of the power-law fluxes, constant or insensitive to power-law flux at moderate power-law fluxes, and anti-correlated with power-law flux at high power-law fluxes. The anti-correlation is an important distinction between this model and reflection models which focus on disc ionisation effects. This model also predicts that line equivalent width and power-law flux should be anti-correlated, which seems to be confirmed by Figure 3c. Miniutti et al. (2004) have noted that the Fe K emission line flux versus power-law flux trend seen in XTE J1650500 is in broad agreement with the light bending model; however, that work was based on only three observations obtained with BeppoSAX. Our analysis of 57 pointed RXTE observations better reveals that the line versus power-law flux and line equivalent width versus power-law flux trends seen in XTE J1650500 are in broad agreement also with the predictions of the light bending model.
Thus, our results are broadly consisent with predictions made by both the ionised disc reflection models (e.g. Ballantyne & Ross, 2002), and a model which focuses on light bending effects (Miniutti & Fabian, 2004). We find evidence for an anti-correlation between line flux and power-law flux at high power-law flux values. This may lend support to the light bending model. Moreover, fits to spectra of XTE J1650500 obtained with XMM-Newton and BeppoSAX – which have the energy resolution required to reliably measure the Fe charge state – show that the line is broadly consistent with He-like Fe XXV over a period of more than twenty days covering groups I/II and III. This may indicate that the changing disc ionisation was not responsible for the line variability observed in XTE J1650500. Taken together, these facts lend some additional support to the light bending model, but are not decisive. We briefly discuss the light bending model for XTE J1650500 below, because the model is particularly interesting and offers some novel physical constraints. This discussion should not be taken as a judgement that the data clearly rule in favor of the light bending model.
It is reasonable to expect relativistic effects to be of importance in XTE J1650–500, with Miller et al. (2002a) and Miniutti et al. (2004) having shown that the Fe line in this source could originate from as close as 2 from the black hole. In the framework of the light-bending model the variability of the hard and reflected components observed in spectra from the early phase of the 2001/2002 outburst of XTE J1650–500 can be explained by a variable height of the hard X-ray source above the accretion disc: in the beginning, the hard X-ray source is located at a medium distance (group I/II), then it gradually approaches to the disc reaching very short distances after Sep.19 (group III). Using the predictions of Miniutti & Fabian (2004) and assuming that XTE J1650–500 has an inclination of , the height of the hard X-ray source in group I/II is in the range of and reaches values lower than in group III.
The explanation of such height variations obviously depends on the model that one assumes for the spectrally hard component in black-hole X-ray binaries. A detailed discussion of all proposed models is beyond the scope of this paper, but we wish to briefly mention the jet model by Markoff et al. (2001) (see also Markoff et al., 2003), because radio observations of XTE J1650–500 show evidence for the presence of a strong compact jet (Corbel et al., 2004). If the hard flux in accreting black holes is produced in part by the base of a jet, then the height of the jet base may act to set a size scale for the corona and reasonably be approximated by a central ”lamp-post” source like the idealised hard source assumed in the light-bending model. The radio observations of XTE J1650–500 suggest a moderate evolution in the jet properties from I/II to group III, which may then be related to changes in the scale height of the base of the jet.
The light bending model also predicts that differing degrees of light bending can cause a hard component with a constant flux to give the appearance of a component which varies in flux by a factor of 20 (depending on inclination), and indeed the hard X-ray flux variations we observe in XTE J1650500 only span a factor of 10. It is undoubtedly the case that variations in the mass accretion rate must play a central role in transient outbursts, and our results in no way serve to contradict that premise. Merely, they suggest that moderate variations in the strength of the hard X-ray emission during state transitions may be partially due to light bending effects.
It is worth noting the change in the Fe-line behaviour occurs during the transition from the hard to the soft state. In particular, the point at which the Fe line variations change regime (Sep. 19) coincides with the point at which the power-law photon index becomes relatively constant, and the point at which 250 Hz QPOs (presumably from very close to the black hole) are first observed (Homan et al. 2003). Detailed timing analysis of the RXTE dataset (Homan et al., 2003; Rossi et al., 2003) reveals that the frequency of QPOs below 10 Hz climbs steadily until Sep. 19, and then reaches a more-or-less steady value after Sep. 19. Thus, it might be possible that light-bending and/or disc-ionization effects are not only partially contributing to the Fe-line flux variations, but also timing properties.
Clearly, despite its limited spectral resolution, RXTE can make important contributions to understanding Galactic black-hole spectra, and can reveal possible relativistic effects which are manifested spectrally. The scheduling flexibility of RXTE means that it is the only X-ray observatory, present or planned, that can execute the numerous observations required to reveal evidence of effects like gravitational light bending. Analysis of archival data and future dedicated observing efforts with RXTE can be used to search for improved evidence of light bending and other relativistic effects in Galactic black holes.
Acknowledgements
The authors would like to thank the referee for constructive comments on an earlier version of the manuscript. S. Rossi thanks G. Ghisellini, F. Tavecchio and S. Campana for useful discussions. J. Miller and J. Homan thank R. Remillard, M. Nowak, and G. Miniutti for useful discussions. S. Rossi gratefully acknowledges financial support from ASI and MIT. J. Miller gratefully acknowledges support from the U. S. National Science Foundation through its Astronomy and Astrophysics Postdoctoral Fellowship program. J. Homan gratefully acknowledges support from NASA.
References
- Arnaud (1996) Arnaud K. A., 1996, in ASP Conf. Ser. 101: Astronomical Data Analysis Software and Systems V Vol. 5, Xspec: The first ten years. p. 17
- Ballantyne & Ross (2002) Ballantyne D. R., Ross R. R., 2002, MNRAS, 332, 777
- Ballantyne et al. (2001) Ballantyne D. R., Ross R. R., Fabian A. C., 2001, MNRAS, 327, 10
- Ballantyne et al. (2003) Ballantyne D. R., Vaughan S., Fabian A. C., 2003, MNRAS, 342, 239
- Balucinska-Church & McCammon (1992) Balucinska-Church M., McCammon D., 1992, ApJ, 400, 699
- Corbel et al. (2004) Corbel S., Fender R. P., Tomsick J. A., Tzioumis A. K., Tingay S., 2004, ApJ, 617, 1272
- Fabian & Vaughan (2003) Fabian A. C., Vaughan S., 2003, MNRAS, 340, L28
- Fabian et al. (2002) Fabian A. C., Vaughan S., Nandra K., Iwasawa K., Ballantyne D. R., Lee J. C., De Rosa A., Turner A., Young A. J., 2002, MNRAS, 335, L1
- George & Fabian (1991) George I. M., Fabian A. C., 1991, MNRAS, 249, 352
- Gruber et al. (1996) Gruber D. E., Blanco P. R., Heindl W. A., Pelling M. R., Rothschild R. E., Hink P. L., 1996, A&A Supp., 120, C641
- Homan et al. (2003) Homan J., Klein-Wolt M., Rossi S., Miller J. M., Wijnands R., Belloni T., van der Klis M., Lewin W. H. G., 2003, ApJ, 586, 1262
- Jahoda et al. (1996) Jahoda K., Swank J. H., Giles A. B., Stark M. J., Strohmayer T., Zhang W., Morgan E. H., 1996, Proc. SPIE, 2808, 59
- Kalemci et al. (2003) Kalemci E., Tomsick J. A., Rothschild R. E., Pottschmidt K., Corbel S., Wijnands R., Miller J. M., Kaaret P., 2003, ApJ, 586, 419
- Laor (1991) Laor A., 1991, ApJ, 376, 90
- Lee et al. (2000) Lee J. C., Fabian A. C., Reynolds C. S., Brandt W. N., Iwasawa K., 2000, MNRAS, 318, 857
- Magdziarz & Zdziarski (1995) Magdziarz P., Zdziarski A. A., 1995, MNRAS, 273, 837
- Markoff et al. (2001) Markoff S., Falcke H., Fender R., 2001, A&A, 372, L25
- Markoff et al. (2003) Markoff S., Nowak M., Corbel S., Fender R., Falcke H., 2003, New Astronomy Review, 47, 491
- Martocchia et al. (2002) Martocchia A., Matt G., Karas V., 2002, A&A, 383, L23
- Miller et al. (2002b) Miller J. M., Fabian A. C., in’t Zand J. J. M., Reynolds C. S., Wijnands R., Nowak M. A., Lewin W. H. G., 2002, ApJ, 577, L15
- Miller et al. (2002c) Miller J. M., Fabian A. C., Wijnands R., Remillard R. A., Wojdowski P., Schulz N. S., Di Matteo T., Marshall H. L., Canizares C. R., Pooley D., Lewin W. H. G., 2002, ApJ, 578, 348
- Miller et al. (2002a) Miller J. M., Fabian A. C., Wijnands R., Reynolds C. S., Ehle M., Freyberg M. J., van der Klis M., Lewin W. H. G., Sánchez-Fernández C., Castro-Tirado A. J., 2002, ApJ, 570, L69
- Miniutti & Fabian (2004) Miniutti G., Fabian A. C., 2004, MNRAS, 349, 1435
- Miniutti et al. (2003) Miniutti G., Fabian A. C., Goyder R., Lasenby A. N., 2003, MNRAS, 344, L22
- Miniutti et al. (2004) Miniutti G., Fabian A. C., Miller J. M., 2004, MNRAS, 351, 466
- Nayakshin & Kallman (2001) Nayakshin S., Kallman T. R., 2001, ApJ, 546, 406
- Nayakshin et al. (2000) Nayakshin S., Kazanas D., Kallman T. R., 2000, ApJ, 537, 833
- Park et al. (2004) Park S. Q., Miller J. M., McClintock J. E., Remillard R. A., Orosz J. A., Shrader C. R., Hunstead R. W., Campbell-Wilson D., Ishwara-Chandra C. H., Rao A. P., Rupen M. P., 2004, ApJ, 610, 378
- Reynolds & Nowak (2003) Reynolds C. S., Nowak M. A., 2003, Phys. Rep., 377, 389
- Ross & Fabian (1993) Ross R. R., Fabian A. C., 1993, MNRAS, 261, 74
- Ross et al. (1999) Ross R. R., Fabian A. C., Young A. J., 1999, MNRAS, 306, 461
- Rossi et al. (2003) Rossi S., Homan J., Miller J., Belloni T., 2003, astro-ph/0309129
- Rothschild et al. (1998) Rothschild R. E., Blanco P. R., Gruber D. E., Heindl W. A., MacDonald D. R., Marsden D. C., Pelling M. R., Wayne L. R., Hink P. L., 1998, ApJ, 496, 538
- Shih et al. (2002) Shih D. C., Iwasawa K., Fabian A. C., 2002, MNRAS, 333, 687
- Tanaka et al. (1995) Tanaka Y., Nandra K., Fabian A. C., Inoue H., Otani C., Dotani T., Hayashida K., Iwasawa K., Kii T., Kunieda H., Makino F., Matsuoka M., 1995, Nature, 375, 659
- Tomsick et al. (2003) Tomsick J. A., Kalemci E., Corbel S., Kaaret P., 2003, ApJ, 592, 1100
- Tomsick et al. (2004) Tomsick J. A., Kalemci E., Kaaret P., 2004, ApJ, 601, 439
- Zhang et al. (1993) Zhang W., Giles A. B., Jahoda K., Soong Y., Swank J. H., Morgan E. H., 1993, Proc. SPIE, 2006, 324