The application of à Trous wave filtering and Monte Carlo analysis on SECIS 2001 solar eclipse observations
Abstract
8000 images of the Solar corona were captured during the June 2001 total Solar eclipse. New software for the alignment of the images and an automated technique for detecting intensity oscillations using multi scale wavelet analysis were developed. Large areas of the images covered by the Moon and the upper corona were scanned for oscillations and the statistical properties of the atmospheric effects were determined. The à Trous wavelet transform was used for noise reduction and Monte Carlo analysis as a significance test of the detections. The effectiveness of those techniques is discussed in detail.
keywords:
Sun, Solar corona, Image processing, Instrumentation1 Introduction
A number of theoretical predictions exist for the propagation of magnetohydrodynamic (MHD) waves associated with coronal loops. \inlineciteRoberts84 studied the various types of propagation through a low- plasma using reasonable approximations for the conditions inside coronal loops. Their work was followed by a large number of authors since then (for example see one of the many review papers by \openciteNakariakov03) and was recently confirmed and refined by applying numerical modelling \inlineciteNakariakov04.
Many attempts to observe propagations in the coronal loops have been made since the first theoretical predictions. One of the most challenging types of oscillations to observe are the fast sausage mode MHD that have expected periodicities below 1 (see \openciteAschwanden04 for a detailed review). Radio, optical and X-rays observations have been used to detect such waves with limited success. In this paper we will present the application of image processing techniques as a way to enhance optical observations made by the Solar Eclipse Coronal Imaging System (SECIS) project during the June 2001 total solar eclipse in Zambia. A detailed description of the instrument can be found in \inlinecitePhillips00.
Starting with \inlineciteKoutchmy83 a number of authors have published possible detections of oscillations with periodicities below 10. \inlinecitePasachoff84,Pasachoff87 have reported possible detections of optical intensity oscillations with periods in the range of 0.5–4, while more recently \inlineciteWilliams01,Williams02,Katsiyannis03 (hereafter W01, W02 and K03 respectively) provided strong indications of oscillations with periodicities 6 while reporting on optical SECIS August 1999 total solar eclipse observations.
Continuing the work published for the SECIS 1999 observations, we have analysed observations made during the June 2001 total solar eclipse in Lusaka, Zambia. Based on experience from the analysis of the 1999 data set, a number of numerical techniques were used in order to improve the signal-to-noise (S/N) ratio and establish an objective, numerical criterion for the identification of the corona intensity oscillations over any statistical effects. A brief description of the observations and data analysis is presented here with more emphasis given to the advanced mathematic techniques used in an effort to improve the S/N ratio and determine the “real” detections of corona loop waves over the influences of noise in the data set.
2 Observations & Data Reduction
A detailed description of the SECIS instrument, as used for the 1999 observations is provided by \inlinecitePhillips00, while a discussion of the improvements made for the 2001 observations can be found in \inlineciteKatsiyannis04 (hereafter K04). The observations taken by SECIS in 2001 and their data reduction will not be presented in detail in this paper as they are the subject of K04. However, a brief description of the data set is to follow as needed for the presentation of the image processing techniques reported here.
8000 Fe xiv images of 512512 pixel2 with a resolution of 4 arcsec pixel-1 were taken during the 3.5 of totality. Although the observing field was large enough to include the whole Moon disk and the lower part of the corona, we chose only to observe the North-East limb. This decision is in line with the 1999 observations and was taken to avoid edge effects of the CCD and optics as well as to include important parts of the outer corona.
A brief description of the data reduction of the eclipse 2001 observations is included here for the purpose of describing the data that were used for the application of the à Trous wavelet transform and Monte Carlo analysis. The images taken during the 2001 observations were reduced by using dark and flat-field frames , for current subtraction and flat field correction. The 8000 images were then automatically co-aligned using the edge of the Moon as a reference point for a first order alignment. For this first alignment the moon was effectively considered stationary during the duration of the eclipse. A more accurate alignment was subsequently achieved by using a clear feature from an area of the lower corona as reference. This second alignment corrected for the motion of the moon in respect to the solar corona during totality. K04 provides a detailed discussion on the alignment technique used and its various steps.
After co-alignment the 8000 images of the observations form a three dimensional data array. The basic technique used for the detection of intensity oscillations throughout the SECIS project is the continuous wavelet transformation of the time series that corresponds to each of pixels of the aligned images. Details on the transformation function and its implementation in time series can be found in \inlineciteTorrence98, while examples of the application of this analysis to SECIS data can be found in a number of publications (e.g. W01, W02, K03 and K04). Additionally K03 explicitly mentions a number of criteria used for a wavelet detection to be considered as a solar intensity oscillation (as oppose to detections created by noise). To test the performance of K03’s criteria, K04 used automated software to scanned large areas of the image covered by the Moon and upper corona and confirmed their effectiveness.
3 Noise Reduction using the it À Trous wavelet algorithm
3.1 S/N ratio limitations on SECIS eclipse data
On of the most significant limitations of the SECIS eclipse observations is the low S/N ratio. Although the observations were taken using a broad Fe xiv filter and the solar corona is known to be bright in Fe xiv emission, there are three major factors that severely limit the S/N ratio achieved by SECIS. For the purposes of this paper we will only emphasise the S/N ratio limiting factors:
-
1.
The prime mirror of the SECIS telescope has a 200 diameter and a focal length of f/10. This is because the instrument was designed mainly with observing solar eclipses in mind and has to be lightweight and easy to travel.
-
2.
The CCD cameras took observations at a ratio of 40 frames per second. This has the obvious disadvantages of a very short exposure time and a very fast readout speed. With current technology such fast CCD readout speeds increase the readout noise drastically.
-
3.
As the purpose of the SECIS project is to detect high frequency intensity oscillations, the atmospheric effects became significant. This is because the earth’s atmosphere itself is known to oscillate in these frequencies and that is causing non-Gaussian noise on the data set.
3.2 Advantages of using the à Trous wavelet transform in our data set.
Having the above limitations in mind, the à Trous filtering was investigated as a means of noise reduction because the algorithm has a number of advantages \inlineciteStarck02.
-
•
The computational requirements are within acceptable levels. This is particularly important as both of the SECIS eclipse observations will have a size of more than 8 .
-
•
The reconstruction algorithm is trivial. This is important as it makes the reconstruction of the time series more accurate.
-
•
The transform is known for every sample of the time series of every pixel. This is important to this project as the exact moment an oscillation starts and ends on a given pixel can be very significant. W02 made some interesting measurement of the propagation speed of a travelling wave on SECIS 1999 total solar eclipse observations by determining the exact time the oscillation arrived at any given pixel.
-
•
The transform is clearly evolving through the different scale in a predictable mater. This makes easier to choose the right scale for the filtering of a certain data set.
-
•
The transform is isotropic. As the SECIS data are also isotropic (specially in the time domain), any filtering used should also be isotropic to avoid an artifacts being introduced.
The à Trous filtering is a relatively recent (some of the first application were described by \openciteHolschneider), s sophisticated, highly tunable and complicated multiresolution algorithm. Due to its complication the exact description of the algorithm is outside the purposes of this paper. More information on the algorithm, its various parameters, advantages and disadvantages of the various procedures that can be used in conjunction with the à Trous wavelet transform and examples of its application on astrophysical data can be found in \inlineciteStarck02.
3.3 The application of à Trous noise reduction algorithm to SECIS data.
Each pixel of the three-dimensional data array of the reduced SECIS 2001 observations was treated as a independent time series and was transformed to a number of coefficients on a multi-scale domain using the à Trous wavelet transform. splines were used for correlation and the noise was assumed to be Gaussian. The sigma of the noise in the coefficients was determined automatically and multiresolution hard K-Sigma thresholding was used to remove the coefficients that were found to be noise. The time series was then reconstructed using the coefficients corrected for noise.
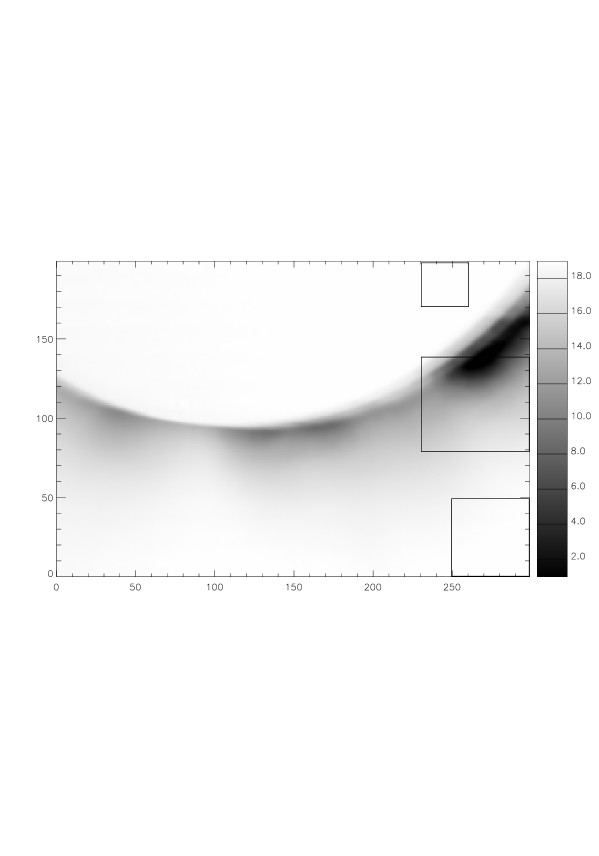
To test the effectiveness of the à Trous wavelet transformation in noise reduction the same three parts of the data set that were chosen by K04 were used again. Figure 1 contains the time-average image of the aligned SECIS 2001 total eclipse observations. After alignment the three-dimensional data array was averaged over the time axis resulting to a two-dimensional image. The edges of the image (one hundred pixels of the left, right and bottom of the image and two hundred pixels from the top) were discarded as they suffer from edge effects of the CCD. Highlighted are three areas of the data set that were used to test the effectiveness of the à Trous filtering algorithm and the Monte Carlo randomisation test. These are areas of the image covered by the Moon’s disk, the outer corona and lower corona. Those areas were chosen to be in the proximity of AR 9513 as this is potentially the most interesting (from the coronal loop oscillations point of view) area of the 2001 observations. The proximity of the test areas to the area were more detections of coronal waves are expected is important as it produces more reliable statistics as there are no effects from large-scale variation in CCD sensitivity or deferent atmospheric conditions.
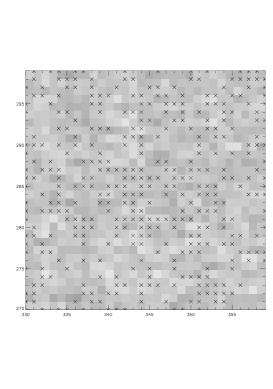
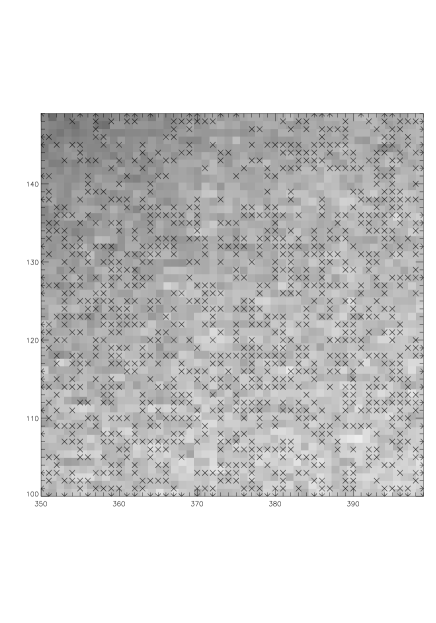
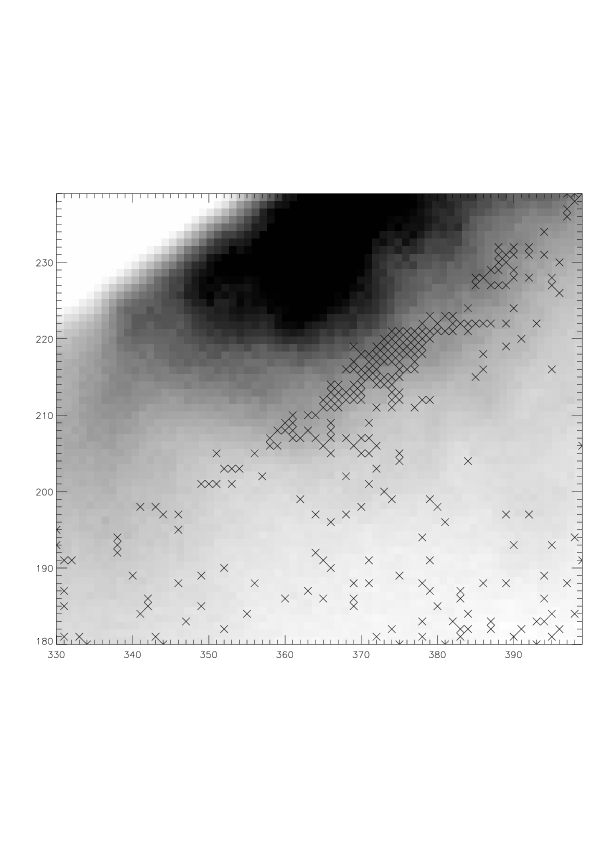
The same automated detection algorithm was used as in K04 and the results for the periodicity range of 7–8 are displayed in Figures 2, 3 and 4. Figure 2 contains 374 pixels that have false (i.e. not caused by the solar corona) detections of oscillations out of the 900 pixels of the sample. Before the à Trous noise filtering the same area contained 5 oscillating pixels. Figure 3 contains 1054 oscillating pixels out of 2500 while before the application of the à Trous wavelet transformation algorithm there were 11. On figure 4 we have detections on 276 pixels out of the 4200 pixels of the sample while K04 found 84 (out of which 66 were concentrated in a very compact area in the middle of the image).
The difference in number of detections before and after the is significant. The number of detections before and after the à Trous wavelet transformation increased by a factor of 75, 96 and 3.3 for the Moon, outer corona and lower corona areas respectively. What is also important is that the increase is not the same for the three areas. While the increase in number of detections is similar for the Moon and outer corona areas, it is by far smaller for the lower corona.
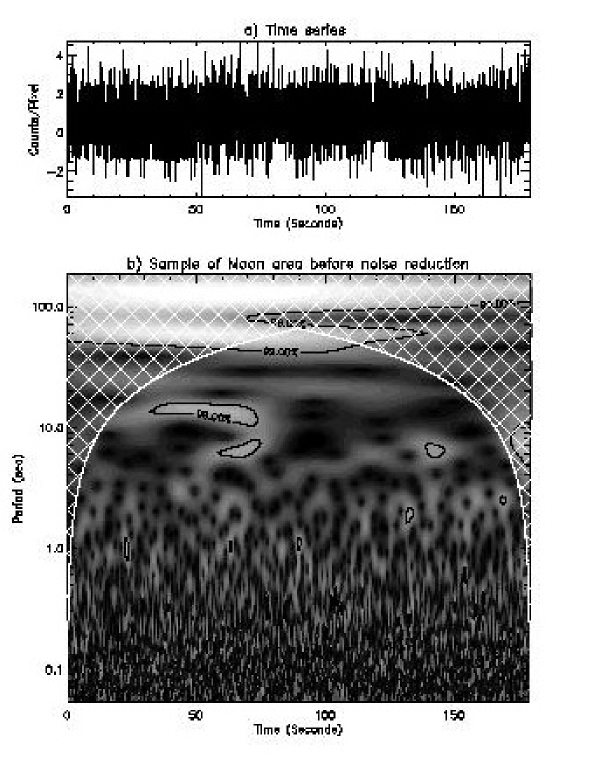
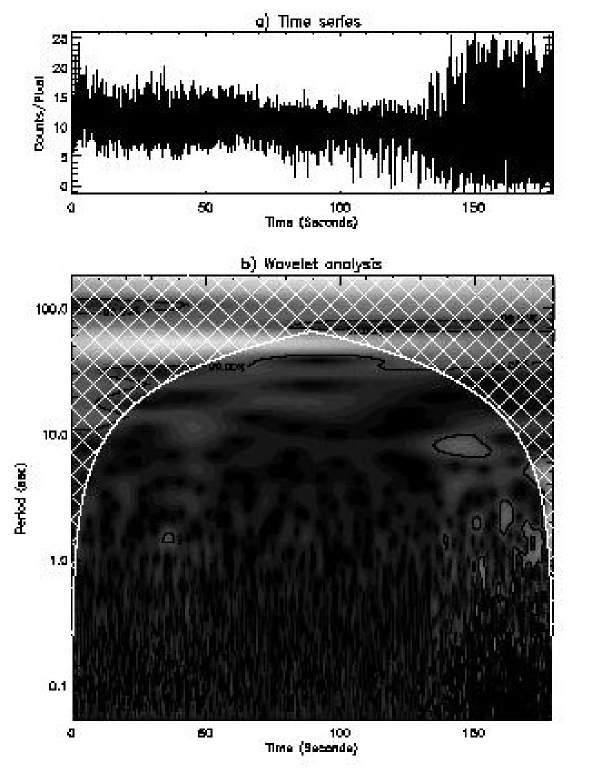
Although it is not surprising that the à Trous filtering effects the areas with high S/N ratio less than those with very low (or zero) S/N, it might appear strange that the filtering causes the areas with very low S/N ratio to be detected as oscillating. To examine this difference in some detail the wavelet transformation of two pixels, one from the Moon area and another from the lower corona are included as figures 5 and 6. Both points were not found to oscillate before the filtering but only after. By examining the time series on Panel (a) of Figures 5 and 6, it is obvious that they are both very noisy, although in the case of Figure 6 there is an underling longer timescale variation, while in Figure 5 the signal oscillates around an average value. These differences are also apparent in the panel (b) of the two figures were the wavelet transformation in Figure 5 has a lot of high values in very low periodicities (since those are far more effected by non-systematic noise), while Figure 6 having higher S/N ratio is less effected by noise therefor there are less high values in the wavelet transformation even in low periodicities. On high periodicities, although there is an area of interest in both figures, there is nothing that satisfies the criteria established by K03.
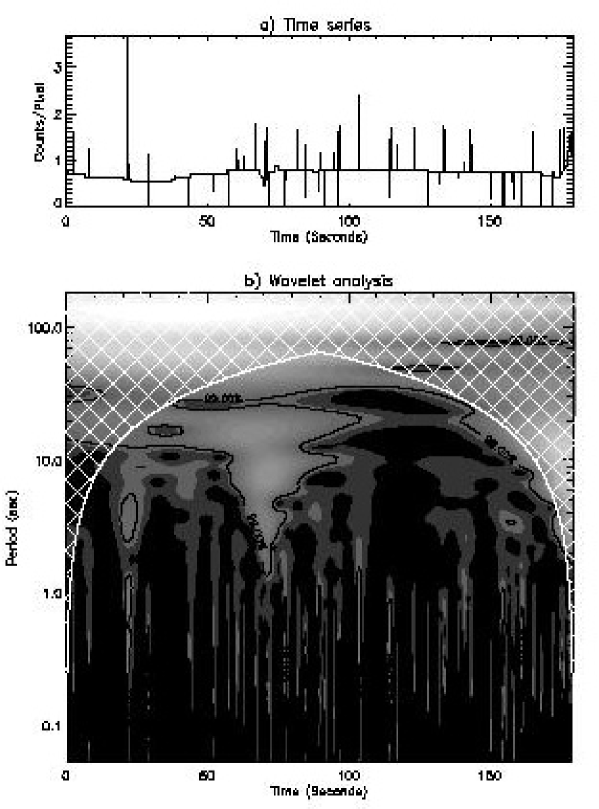
After filtering with the à Trous wavelet transformation algorithm the same two points were analysed using wavelets. Figure 7 contains the time series produced and and wavelet transformation that corresponds to point of the Moon area that we analysed in Figure 5. All the jittering in the time series has disappeared and only some small picks and a small long-term variation have remained. The wavelet transformation corresponds well to what appears on the time series, producing very low values on the very high frequencies (as the Gaussian noise effects the high frequencies more), some short-lived high values on the high frequencies (that correspond to the high picks of the time series) and a number of detections in lower frequencies (that correspond to the long-term variation). As expected, the à Trous wavelet transformation filtering was very effective on removing the Gaussian noise (which is why there are no oscillation in very low periodicities) and the detections on the higher periodicities should be attributed to another factor. Since by definition the area of the images covered by the Moon has not direct light from the lower corona, another source of light should be considered. As it is known that in total solar eclipses the sky is not completely dark (the sky is much brighter that during night even to the naked eye), the long-term variations in the time series and the resulting detections should be attributed to the scattered light and atmospheric affects that produces variations in brightness. Although those existed previously in the un-filtered data, there were small and effect by Gaussian noise, therefor they did not produce enough power to become valid detections.
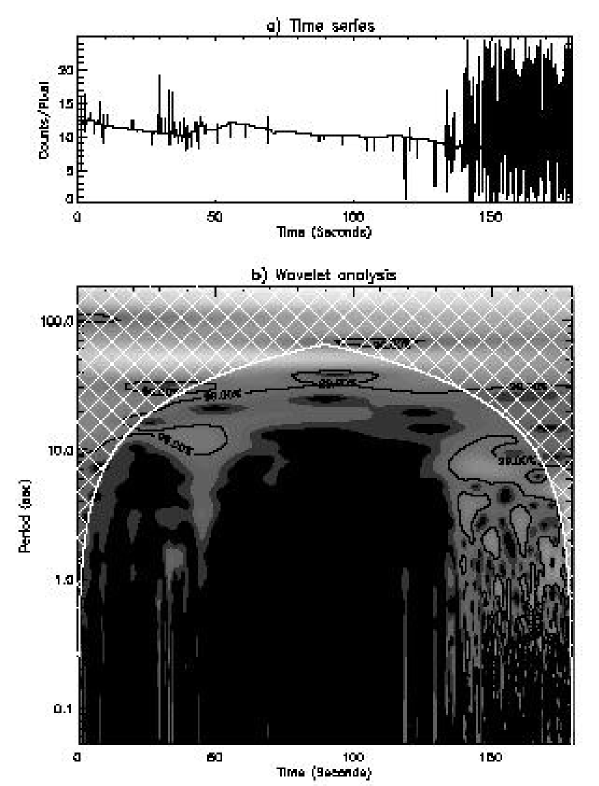
Figure 8 contains the time series and wavelet transform of the point of lower corona analysed in Figure 6. The effects of the à Trous wavelet filtering here are different to those on the previous time series. Although most of the jittering has disappeared up to the 130th , the variation that existed on the un-filtered data after the 130th still largely remains. The same applies to the transformation of panel 9b) of Figure 8: All high values in very low periodicities have disappeared up to 130th , but a significant number remains after then. On higher periodicities there is clearly an amplification of existing high values mainly on the region after the 130th . The increase in power on the low periodicities coincides with a similar increase in the power of high periodicities.
4 Significance test using Monte Carlo analysis
The statistical analysis on SECIS 2001 as performed by K03 & K04 indicates that there are “false” (i.e. caused by noise or atmospheric effects) oscillations that satisfy the criteria establish by K03. In particular atmospheric seeing is known to produce differential distortion effects that produce “false” detections in the range of 5 to 19 periods. So far the only satisfactory way found to treat those false detections is statistical. The possibility for a detection to be due to noise or atmospheric effects was calculated by scanning for oscillations large parts of the data were no “real” (i.e. solar coronal) oscillations can be expected. The number of oscillations found in those areas was then used to establish the possibility of detection to be false in the areas of the lower solar corona that are in the proximity of the “test” areas. The cases were the concentration of detections is much higher than expected, a detection of a corona wave is reported (as in K04).
In a bid to establish a quantitative criterion to determine which detections of oscillations are due to noise or atmospheric effects and overcome the limitations of the statistical methods used, the Monte Carlo analysis (or randomisation) was investigated. This method has successfully used before in the analysis of solar physics data by \inlineciteOshea,Banerjee who applied it to time series analysed by wavelet transforms. It was chosen because it provides a test of noise that is distribution free (or else non-parametric), i.e. it does not depend on any given noise model (e.g. Gaussian noise, Poisson, etc). Here we follow the Fisher method as described by \inlineciteNemec and performed 1000 permutations per pixel of the aligned three-dimensional array. In order to evaluate the performance of this randomisation method, we used the same test areas of the Moon and the outer corona as in previous section. For each individual pixel of these areas the maximum power of the wavelet transformation was recorded and then compared to the maximum value of the 1000 shuffled time series produced from the original. The percentage of those shuffled time series that had maximum power of their wavelet transformation larger than that of the original time series was then recorded. When the original time series is random noise of any given type (as this test is distribution free) we expect that 50% of the shuffled time series will have wavelet transformations with higher maximum power than the original data. For the purposes of this analysis we will consider any value smaller than 1% (ie less than 1% of the shuffled time series has wavelet transformation with power more than that of the original time series) is indicating that the original time series has a strong signal comparing to the noise level.
| Percentage of (%) | Before noise filtering | After noise filtering |
|---|---|---|
| Moon | 60 | 15 |
| Outer Corona | 65 | 10 |
| Lower Corona | 5 | 1 |
Table 1 contains the percentage of pixels in each of the test areas that were found to have . A number of important results become apparent: First of all the areas of the Moon and outer corona before noise-filtering have more that the half of their pixels having a relatively low S/N ratio, while the percentage of the lower corona pixels (again before filtering for noise) that have a similarly low S/N ratio is much lower (5 %). This is significant as it confirms the choice of as a criterion to distinguish between the pixels that have signal dominated by the solar corona and those that do not. Second the application of the à Trous noise filtering makes reduces the “randomness” of the data set significantly (by a factor of 5) making it difficult to use the randomisation test reliably. A third useful result shown on Table 1 is that the percentage of pixels that have is approximately the same in the Moon area (where we know that the signal of all pixels is due to not direct observation of the Sun) and the outer corona (where we know the signal is partially directly from the solar corona and partially scattered light). This is important as it indicates that the scattered light on this image area is a significant portion of the signal and it will be very difficult to distinguish which detections are “real” in this area by applying the existing criteria.
À Trous wavelet transformation’s inability to reduce the number of “false” detections can be explained if we consider the different contributions to the signal. Any pixel value of this data set is a combination of the detection of scattered light from Earth’s atmosphere, Gaussian noise and (for those areas that are not covered by Moon) the detection of light directly from the solar corona. By removing the Gaussian noise any weak oscillations due to Earth’s atmosphere could be detected more clearly. Those oscillations are known to be introduced by various optical effects produced by Earth’s atmosphere: variation in transmission through the atmosphere, differential distortions caused by winds at high altitude, etc. In contrast the area lead by the lower solar corona had already enough signal and a high S/N ratio, therefor the reduction of the Gaussian noise levels did not contribute to a major increase in the number of detected oscillations. Also because the signal coming from the solar corona in this particular area was strong before the à Trous noise filtering, the relatively weaker atmospheric effects did not increase dramatically after the subtraction of the Gaussian noise. As a result the number of detected oscillations did not increase as dramatically in that area as in the other two.
The most significant breakthrough of the efforts to establish a quantitative criterion to determine which detections of oscillations are “real” and which are not, came when was calculated for the pixels that were found to oscillate by K04 (i.e. the 5 pixels of the Moon area, 11 pixels of the outer corona area and 66 pixels of the lower corona). All pixels from lower corona were found to have (i.e. none of the 1000 shuffled time series was found to have a wavelet transformation with higher power than that of the original time series), while 4 out of 5 of the detections from the Moon area and 10 out of 11 detections from the outer corona, were found with . Therefor, a criterion can be establish that will use the randomisation test described here to reject those pixels with .
5 Discussion
Two well known signal processing techniques, The à Trous wavelet transformation and Monte Carlo analysis, were applied to SECIS 2001 data. Those two methods were evaluated by using two “test” areas (areas were the signal from the solar corona was expected to be small or zero) and a “useful” area were detections of corona oscillations were expected. By comparing the results from the three areas, an accurate evaluation of the numerical techniques described above was made.
The à Trous algorithm produced mixed results. Although the reduction to Gaussian noise level was very significant, the ability to detect corona waves was actually reduced. This is because of the effect of Earth’s atmosphere in the data set. Intensity oscillations caused by the atmosphere were weaker in signal than those caused by the solar corona, therefor, when the S/N ration was lower those oscillations did not obtain the significance levels needed to become detections. After the noise was reduced the significance levels of the intensity oscillations caused by the atmosphere was increased enough to produce a large number of false detections. It is also worth noticing that the areas where the signal from the corona was stronger had much less false detections than those areas with weak or no signal, indicating that the signal from the lower corona is significantly stronger than the atmospheric effects.
By the use of the two “test” areas of the data set it has become apparent that a reliable, objective, numerical method is needed in order to distinguish those detections caused by plasma from the solar corona to those introduced by atmospheric effects. The Monte Carlo analysis (otherwise refereed here as randomisation test) was investigated as a means to make this distinction. All detections reported as “real” by K04 were found to have while almost all (14 out of 16) of those reported as “false” were found to be in the range of . Therefor the value of is proposed as a criterion for rejecting future detections from the lower corona region.
Acknowledgements.
This work was completed under the ESA/PRODEX contract C90117 ”SWAP Preparation for Exploitation”.References
- Aschwanden (2004) Aschwanden M.J., 2004, Physics of the Solar Corona, An Introduction, Springer-Verlag Telos
- Banerjee (2001) Banerjee D., O’Shea E., Doyle J.G., Goossens M., 2001, A&A, 380, L39
- Holschneider et al. (1989) Holschneider M., Kronland-Martinet R., Morlet J., Tchamitchian P., 1989, A real-time algorithm for signal analysis with the help of the wavelet transform, in Wavelets: Time-Frequency Methods and Phase-Space, 286, Springer-Verlag
- Katsiyannis et al. (2003) Katsiyannis A.C., Williams D.R., McAteer R.T.J., Gallagher P.T., Keenan F.P., Murtagh F., 2003, A&A, 406, 709
- Katsiyannis et al. (2004) Katsiyannis A.C., Williams D.R., Murtagh F.D., McAteer R.T.J., Keenan F.P., 2005, ESA SP-575, 410
- Koutchmy et al. (1983) Koutchmy S., Žugžda Y.D., Locǎns V., 1983, A&A, 120, 185
- Nakariakov (2003) Nakariakov V.M., 2003, in Dynamic Sun, Ed. B. Dwivedi, CUP
- Nakariakov et al. (2004) Nakariakov V.M., Arber T.D., Ault C.E., Katsiyannis A.C., Williams D.R., 2004, MNRAS, 349, 705
- Nemec & Nemec (1985) Nemec A.F. & Nemec J.M., 1985, AJ, 90, 2317
- O’Shea et al. (2001) O’Shea E., Banerjee D., Doyle J.G., Fleck B., Murtagh F., 2001, A&A, 368, 1095
- Pasachoff & Landman (1984) Pasachoff J.M., Landman D.A., 1984, Sol. Phys., 90, 325
- Pasachoff & Ladd (1987) Pasachoff J.M., Ladd E.F, 1987, SP 109, 365
- Phillips et al. (2000) Phillips K.J.H., Read P., Gallagher P.T., Keenan F.P., Rudawy P., Rompolt B., Berlicki A., Buczylko A., Diego F., Barnsley R., Smartt R.N., Pasachoff J.M., Badcock B.A., 2000, Sol. Phys., 193, 259
- Roberts et al. (1984) Roberts B., Edwin P.M., Benz A.O., 1984, ApJ, 279, 857
- Starck & Murtagh (2002) Starck J.-L., Murtagh F., 2002, ‘Astronomical Image and Data Analysis’, Springer-Verlag Berlin Heidelberg
- Torrence & Compo (1998) Torrence C., Compo, G.P., 1998, Bull. Amer. Meteor. Soc., 79, 61
- Williams et al. (2001) Williams D.R., Phillips K.J.H., Rudawy P., Mathioudakis M., Gallagher P.T., O’Shea E., Keenan F.P., Read P., Rompolt B., 2001, MNRAS, 326, 428
- Williams et al. (2002) Williams D.R., Mathioudakis M., Gallagher P.T., Phillips K.J.H., McAteer R.T.J., Rudawy P., Keenan F.P., Katsiyannis A.C., 2002, MNRAS, 336, 747