11email: zulema@astro.iag.usp.br 22institutetext: European Southern Observatory, Casilla 19001, Santiago 19, Chile 33institutetext: Onsala Space Observatory, 439 92 Onsala, Sweden 44institutetext: Service d’Astrophysique (CNRS URA 2052), CEA Saclay, 9119Gif-sur-Yvette, France
Millimeter-wave emission during the 2003 low excitation phase of Carinae
In this paper we present observations of Carinae in the 1.3 mm and 7 mm radio continuum, during the 2003.5 low excitation phase. The expected minimum in the light curves was confirmed at both wavelengths and was probably due to a decrease in the number of UV photons available to ionize the gas surrounding the binary system. At 7 mm a very well defined peak was superimposed on the declining flux density. It presented maximum amplitude in 29 June 2003 and lasted for about 10 days. We show that its origin can be free-free emission from the gas at the shock formed by wind-wind collision, which is also responsible for the observed X-ray emission. Even though the shock strength is strongly enhanced as the two stars in the binary system approach each other, during periastron passage the X-ray emission is strongly absorbed and the 7 mm observations represent the only direct evidence of this event.
Key Words.:
stars: individual: Carinae – stars: binaries: general – stars: winds – radio continuum: general1 Introduction
Even after more than a century of intensive studies, little is known about Eta Carinae as a star, hidden as it is by a dense cloud of gas and dust. Analysis of the historical optical data revealed a 5.52 year periodicity, characterized by very sharp dips in the light curve, lasting for only a few months (Damineli, 1996). Similar periodicity was found in the radial velocity of the Pa and Pa lines, suggesting the existence of a binary system in a highly eccentric orbit (Damineli, Conti & Lopes 1997; Davidson 1997; Damineli et al. 2000), although the orbital parameters were not well defined by the observations. Damineli et al. (2000) derived an eccentricity from the radial velocity data and Corcoran et al. (2001a) found an even higher value, , in a model where the X-ray emission is produced by wind-wind collisions. The ephemerides for periastron passage was also constrained by the X-ray observations, since the strong periodic increase in luminosity was attributed to an increase in the shock strength as the two stars approached each other. Unfortunately, the maximum in the X-ray emission is not observable, because at periastron the shocked region seems to be absorbed by a large H column density, which produces the pronounced dip in the X-ray light curve and puts constrains on the ephemerides for conjunction and opposition (Corcoran et al. 2001a, ; Pittard & Corcoran, 2002). The existence of a binary system was contested by Davidson et al. (2000), based on high spatial resolution spectroscopic observations. Recently Falceta-Gonçalves, Jatenco-Pereira & Abraham (2005) gave an alternative explanation to the X-ray absorption, which puts the periastron close to conjunction, in agreement with the data.
Radio observations of Carinae, from 6 cm to 1.3 mm, show also the periodic, sharp dips in their light curves (Cox et al. 1995a; Duncan, White & Lim 1997; Abraham & Damineli 1999). The continuum emission is attributed to thermal bremsstrahlung from an optically thick plasma, produced either in the Carinae wind (Cox et al. 1995a, ) or in an equatorial disk (Duncan & White, 2003). Interferometric monitoring with the Australian Telescope Compact Array at 3 and 6 cm with 1” resolution, showed an elongated structure, reaching a maximum size of about 4” ( cm at a distance of 2.3 kpc), which shrinks to less than 1” during the minimum in the light curve (Duncan et al., 1997). This effect was interpreted by Duncan & White (2003) as due to a decrease in the number of ionizing photons during the low excitation phase.
In this paper we report contemporaneous observations of the last minimum in the light curves, which started around May 2003, at two radio wavelengths: 1.3 mm and 7 mm, obtained respectively with SEST, at La Silla, Chile and with the Itapetinga radiotelescope, in Brazil. The closely spaced observations provided not only the light curves with great precision, but also what we believe was the detection of radio emission from the colliding winds, highly enhanced during periastron passage. Since at that time the X-ray emission from the winds was totally absorbed, our observations represent the first detection of this phenomenon.
2 Observations and Results
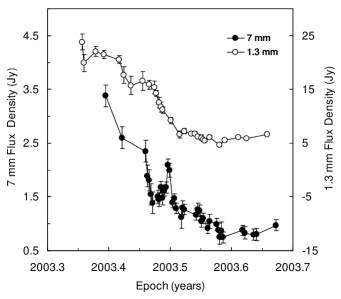
To better understand the radio light curve, we made daily observations at 7 mm with the Brazilian Itapetinga radiotelescope and weekly observations at 1.3 mm with the ESO (European Southern Observatory) SEST radiotelescope at La Silla, Chile, during the periodic event predicted for June 2003.
The Itapetinga radiotelescope has a beam size of about 2 arc-min at 7 mm, enough to separate Carinae from the other HII regions in the CarII cloud; the observations consisted of scans across the source with 20 arc-min amplitude, to allow the subtraction of the underlying sky contribution. The atmospheric opacity was calculated using the technique developed by Abraham & Kokubun (1992); the flux density was calibrated by observation of the standard point source Virgo A; the stability of the system was continuously checked by intercalating observations of the HII regions G287.57-0.59 and G287.55-0.63, part of the extended Carina Nebulae (Retalack, 1983), with those of Carinae.
Observations at 1.3 mm were made with SIMBA (SEST Imaging Bolometer Array), a 37-pixel bolometer array with a beamsize of and separation between pixels in the sky of . The observations were made in fast scanning mode ( s-1 in elevation). The peak flux of Carinae was determined by fitting a two-dimensional gaussian to the source; series of 4-8 maps were obtained on each occasion, the uncertainty in peak flux was obtained from the rms value of the fluxes in each map. The atmospheric opacity was determined from sky dips and daily observations of Uranus provided absolute calibrations. The last observation coincided with the end of the operations of the SEST radiotelescope.
The data, presented in Figure 1, confirms the appearance of the predicted dip, with a decrease in flux density by a factor of four at both wavelengths. The closely spaced observations revealed also a short duration peak at 7 mm, reaching the maximum flux density in June 29 and lasting for about 10 days, superimposed to the fast decline in emission. The peak is not conspicuous at 1.3 mm, although the time sampling at this wavelength is not as dense as at 7 mm. Although the general behavior of the light curves at radio frequencies is similar to what was observed in the previous cycle, made with coarse temporal resolution (Abraham & Damineli, 1999; Cox, 1999), the short-lived peak observed at 7 mm was unexpected and difficult to explain in terms of, for example, a sudden increase in the number of ionizing photons. We thus investigated if the excess radio emission could be produced in the thin shock region that is responsible for the observed X-ray emission.
3 Model for the mm-wave emission
To interpret quantitatively the mm-wave light curves we will assume that the free-free emission is produced both in an extended disk surrounding Carinae (Duncan et al., 1997) and in the cooling shock region formed by wind-wind collision. We will further assume that the flux of UV radiation that maintains the disk ionized, suddenly decreases, or maybe even stops, as proposed by Duncan & White (2003).
3.1 Emission from the optically thick disk
If the ionizing flux decreases, part of the ionized material will recombine at a rate given by:
| (1) |
where is the electron number density and the recombination coefficient, given by:
| (2) |
with the function tabulated in Spitzer (1978). In the inner region of the disk, electron densities cm-3 and temperatures K are required to explain the large flux densities and optically thick continuum radio spectrum, as well as the H30, H35 and H40 recombination lines, which present strong maser amplification (Cox et al. 1995b, ; Abraham et al., 2002). Using these values in equations (1) and (2) we find a recombination timescale of 2.5 days. Since the disk density decreases with distance to Carinae (Cox et al. 1995a, ; Abraham et al., 2002), the cooling time will be larger in the outer parts of the disk, explaining qualitatively the duration and shape of the declining part of the light curve. The net result of this process is the formation of a hole of neutral material in the center of the ionized disk. Since the actual electron density distribution in the disk is not known and we are mainly interested in the residual emission, we adjusted the 7 mm flux density emitted by the disk by a smooth function of the ephemerides :
| (3) |
The parameters , , , and , were determined from the data at both sides of the peak, the time was measured from 29 June 2003 .

In Figure 2 we show an expanded version of the 7 mm light curve, with the assumed disk flux density indicated by a continuous line (upper panel). The residual emission, which origin we will try to establish, is seen in the lower panel.
3.2 Free-free emission from the ionized winds
Let us assume that the winds are completely ionized and their temperatures are close to K; their densities at a distance from the corresponding star are related to their mass loss rates and terminal wind velocities by:
| (4) |
The flux density at mm wavelengths must be calculated taking into account radiation transfer since, at the densities and temperatures found close to the stars, the optical depth can be large. Using the Rayleigh-Jeans approximation we have:
| (5) |
where is the solid angle subtended by the emitting region and the optical depth.
To explain the observed flux density at the peak of the emission light curve (about 1 Jy), in the most favorable condition of , it is necessary a source subtending a solid angle of srd, which at the distance of Carinae corresponds to a radius cm.
The optical depth of the emitting region is found from the integral:
| (6) |
where is the free-free absorption coefficient, which at radio wavelengths can be calculated from:
| (7) |
where is the Gaunt factor for free-free emission. For the physical conditions in the winds, K and , can be approximated by:
| (8) |
For K:
| (9) |
Taking as the depth of the shell that gives , we find from equations (4), (6), (7) and (8) cm.
If we assume that the peak of the 7 mm emission is due to an increase in the mass loss rate of the star, the perturbation will reach the radius cm in approximately 2 years. Since the observed time scales are much smaller, we can eliminate the winds as the emission source. We investigate now the possibility of the emission being produced by the wind-wind collision.
3.3 Free-free emission from shocked material
The physical conditions in the shock produced by wind collision were calculated analytically (e.g. Girard & Wilson 1987; Usov 1992) and applied to the Carinae binary system by Ishibashi et al. (1999) and Corcoran et al. (2001a). Detailed numerical simulations were obtained by Pittard et al. (1998) and Pittard & Corcoran (2002), including the effects of radiative cooling. In all cases the spectrum of the X-ray emission and the resulting light curve were satisfactorily explained, using appropriate parameters for the orbit, mass loss rates and wind velocities.
The radio emission from wind-wind collisions was calculate by Dougherty et al. (2003), using numerical models and including radiation transfer effects and different inclination angles for the orbital plane, to explain the thermal and non-thermal emission detected in several binary systems (Dougherty et al. 1996; Dougherty & Williams 2000; Moran et al. 1989; Churchwell et al. 1992; Williams et al. 1997; Niemela et al. 1998).
However, close to periastron passage and because of the very high mass loss rate from Carinae (Hillier et al. 2001) and the high eccentricity of the binary system (Damineli et al. 2000; Pittad & Corcoran 2002), radiative cooling is very fast and the shock region becomes very narrow. For that reason, the temperature, density and ionization profiles obtained from numerical models (e.g. Pittard & Corcoran 2002), in which the cell size is about cm, cannot be used for our purpose. Therefore, we will calculate the expected radio flux density at 7 mm with plausible combinations of temperature, density and size of the emitting region.
We first determine the physical conditions at the shock using the expressions presented by Usov (1992). The momentum balance surface intercepts the line joining the two stars at a distance from Carinae, given by:
| (10) |
where is the distance between the stars and . and are the mass loss rates of Carinae and the companion star, and their respective wind velocities. Pittard & Corcoran (2002) favored in their fitting of the X-ray spectra obtained with .

Shocks are formed at both sides of the contact surface. The density and temperature behind each shock can be derived from the values and at the shock front:
| (11) |
| (12) |
where is the adiabatic exponent, is the Mach number, the molecular weight and the mass of the H atom.
Assuming for Carinae a mass loss rate of M⊙ yr-1, a wind velocity of 700 km s-1 and a separation AU at periastron, corresponding to an orbit with eccentricity (Pittard & Corcoran, 2002; Hillier et al., 2001), we find a number density cm-3. For a temperature K, the post-shock physical parameters will be cm-3 and K. For a secondary star with mass loss rate M⊙ yr-1 and wind velocity km s-1, the corresponding values behind the shock are cm-3 and K, temperature compatible with X-ray observations (Seward et al., 2001; Corcoran et al. 2001b, ).
With these initial values, we can calculate the temperature and density time evolution from the first law of thermodynamics assuming, as in Mathews & Doane (1990), isobaric equilibrium and cooling by free-free and line emission:
| (13) |
with is giveny by:
| (14) |
where and are the number density of ions and electrons, respectively, and , , and . We did not consider heating by the stellar UV radiation because most of the radio emission is produced at temperatures larger than K, when this heating process is not effective.
In Figure 3 we show the time evolution of and , for the secondary shock and the physical conditions in the post-shock gas derived previously. We can see that the temperature decreases slowly during approximately 4 days and then drops very fast, as the density increases and line emission becomes effective. For the primary shock, the cooling time is less than a day, since the initial temperature is lower and the density much higher.
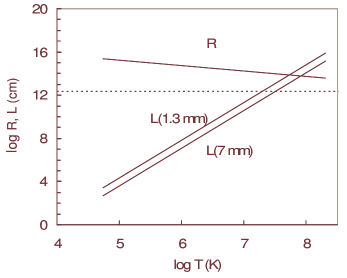
As in the case of the individual wind emission, we can estimate the size of the optically thick region necessary to produce the observed peak at 7 mm. Figure 4 shows its radius as a function of the electron temperature, for the conditions found in the secondary shock. This size will be 4 times larger for the primary shock. We should notice that cannot be much larger than one at 7 mm, otherwise the optical depth at 1.3 mm could also be large, in which case the expected flux density would be 28 Jy, much larger than what was observed. In the same Figure we show for this reason, the depth of the emitting region that gives both for 7 mm and 1.3 mm. The allowed values of lie between the two lines. The dotted line represents the separation between the secondary star and the shock at periastron, which gives an upper limit to the depth and temperature of the material responsible for the peak emission. The same calculation can be made for the primary shock, although in this case, for the same emitting area the emission is 16 times smaller.
4 Conclusions
In this paper we presented the 1.3 and 7 mm light curves of Carinae during the 2003.5 low excitation phase. The expected minimum in the light curves was confirmed but an unexpected peak, superimposed to the decreasing flux density, was observed at 7 mm. It reached its maximum in 29 June 2003 and lasted for about 10 days. To interpret the light curves we assumed that the decreasing part of the emission is produced in the extended disk surrounding the Carinae binary system. We tested the possibility of the peak emission being produced either by the single stars winds or by the wind-wind shock region, also responsible for the X-ray emission. We calculated the size of the emitting region assuming single wind emission and obtained a radius of cm and a depth about cm for . Considering the wind velocity of 700 km s-1, a change in mass loss rate would take about 20 years to reach this distance. An alternative was to investigate the emission from the wind-wind collision. We calculated the physical conditions in the material behind the primary and secondary shocks and estimated the cooling time due to free-free and line emission. The size of the emitting region was determined as a function of temperature, as well as the possible depth range compatible with both 7 and 1.3 mm observations.
Acknowledgments
This work was supported by the Brazilian Agencies FAPESP, CNPq and FINEP.
References
- Abraham & Kokubun (1992) Abraham Z., Kokubun F., 1992, A&A, 257, 831
- Abraham & Damineli (1997) Abraham Z., Damineli A., 1997, in Luminous Blue Variables: Massive Stars in Transition, ASP Conference Series 120, p 294
- Abraham & Damineli (1999) Abraham Z., Damineli A., 1999, in Carinae at the Millenium, ASP Conference Series 179, San Francisco, p263
- Abraham et al. (2002) Abraham Z., Damineli A., Durouchoux, P., Nyman L-Å., McAuliffe F., 2002, in Cosmic Masers: from Proto-stars to Black Holes, ASP Conference Series 206, San Francisco, p234
- Churchwell et al. (1992) Churchwell, E., Bieging, J. H., van der Hucht, K. A. et al., 1992, ApJ, 393, 329
- (6) Corcoran M. F., Ishibashi K., Swank J. H., Petre, R., 2001a, ApJ, 547, 1034
- (7) Corcoran M. F., Swank J. H., Petre R., et al., 2001b, ApJ, 562, 1031
- (8) Cox P., Mezger P. G., Sievers A. et al., 1995a, A&A, 297, 168
- (9) Cox, P., Martin-Pintado, J., Bachiller, R. et. al., 1995b, A&A, 295, L39
- Cox (1999) Cox, P., 1999 in Eta Carinae at the Millenium, ASP Conference Series 179, San Francisco, p277
- Damineli (1996) Damineli, A., 1996, ApJ, 460, L49
- Damineli et al. (1997) Damineli, A. & Conti, P., Lopes, D., 1997, NewA, 2, 107
- Damineli et al. (2000) Damineli, A., Kaufer, A., Wolf, B., Stahl, O., Lopes, D. & Araújo, F., 2000, ApJ, 528, L101
- Davidson (1997) Davidson K., 1997, NewA, 2, 397
- Davidson et al. (2000) Davidson, K., Ishibashi, K., Gull, T. R., Humphreys, R., Smith, N., 2000, ApJ, 530, L107
- Dougherty et al. (1996) Dougherty, S. M., Williams, P. M., van der Hucht, K. A., Bode, M. F., Davis, R. J. 1996, MNRAS, 280, 963
- Dougherty & Williams (2000) Dougherty, S. M., Williams, P. M., 2000, MNRAS, 319, 1005
- Dougherty et al. (2003) Dougherty, S. M., Pittard, J. M., Kasian, L. et al. 2003, A&A, 409, 217
- Duncan et al. (1997) Duncan, R. A., White, S. M., Lim, J., 1997, MNRAS, 290, 680
- Duncan & White (2003) Duncan, R. A., White, S. M. 2003, MNRAS, 338, 425
- Falceta-Gonçalves et al. (2004) Falceta-Gonçalves D., Jatenco-Pereira V., Abraham Z, 2005, MNRAS, 357, 895
- Girard & Willson (1987) Girard, T., Willson, L. A., 1987, A&A 183, 247
- Hillier et al. (2001) Hillier D., Davidson K., Ishibashi K., Gull T., 2001, ApJ, 553, 837
- Ishibashi et al. (1999) Ishibashi K. Corcoran M., Davidson K., Swank J., Petre R., Drake S., Damineli A., White S., 1999, ApJ, 524, 983
- Mathews & Doane (1990) Mathews W., Doane J., 1990, ApJ, 352, 423
- Moran et al. (1989) Moran, J. P., Davis, R. J., Spencer, R. E., Bode, M. F., Taylor, A. R. 1989, Nature, 340, 449
- Niemela et al. (1998) Niemela, V. S., Shara, M. M., Wallace, D. J., Zurek, D. R., Moffat, A. F. J., 1998, AJ, 115, 2047
- Pittard et al. (1998) Pittard J. M., Stevens I. R., Corcoran M. F., Ishibashi K., 1998, MNRAS, 299, L5
- Pittard & Corcoran (2002) Pittard J. M., Corcoran M. F., 2002, A&A, 383, 636
- Retalack (1983) Retalack, D. S. 1983, MNRAS 204, 669
- Seward et al. (2001) Seward F. D., Butt Y. M., Karovska M., Prestwich A., Schlegel E. M., 2001, ApJ, 553, 832
- Spitzer (1978) Spitzer L., 1978, Physical processes in the interstellar medium, New York, Wiley.
- Usov (1992) Usov V. V.,1992, ApJ, 389, 635
- Williams et al. (1997) Williams, P. M., Dougherty, S. M., Davis, R. J. et al., 1997, MNRAS, 289, 10