X-ray synchrotron emission from the oblique shock in the jet of the powerful radio galaxy 3C 346
Abstract
We report the first detection, with Chandra, of X-ray emission from the jet of the powerful narrow-line radio galaxy 3C 346. X-rays are detected from the bright radio and optical knot at which the jet apparently bends by about 70 degrees. The Chandra observation also reveals a bright galaxy-scale atmosphere within the previously-known cluster, and provides a good X-ray spectrum for the bright core of 3C 346. The X-ray emission from the knot is synchrotron radiation, as seen in lower-power sources. In common with these sources, there is evidence of morphological differences between the radio/optical and X-ray structures, and the spectrum is inconsistent with a one-component continuous-injection model. We suggest that the X-ray-bright knot is associated with a strong oblique shock in a moderately relativistic, light jet, at degrees to the line of sight, and that this shock is caused by the jet interacting with the wake in the cluster medium behind 3C 346’s companion galaxy. The general jet curvature can result from pressure gradients in the cluster atmosphere.
keywords:
galaxies:active – galaxies:individual: 3C 346– galaxies: jets – radiation mechanisms: non-thermal – X-rays:galaxies1 Introduction
The powerful radio galaxy 3C 346 is hosted by a 17th magnitude galaxy at (e.g., Laing, Riley & Longair 1983). The western radio structure shows a terminal hotspot embedded in lobe emission which displays a Laing-Garrington effect (Akujor & Garrington 1995), showing it to lie on the far side of the nucleus. By contrast, the eastern jet (on the observer’s side of the nucleus) is highly distorted (Spencer et al. 1991; Cotton et al. 1995). Optical synchrotron emission associated with the eastern jet was first reported from ground-based observations (Dey & van Breugel 1994), and later HST observations show a remarkable correspondence between optical and radio jet features (de Koff et al. 1996; de Vries et al. 1997). In the X-ray, 3C 346 was first detected with Einstein (Fabbiano et al. 1984), and subsequent observations with ROSAT and ASCA allowed Worrall & Birkinshaw (2001) to separate spatially and spectrally the core from X-ray emission from gas in the potential well of the surrounding cluster, the existence of which is supported by optical galaxy counts (Zirbel 1997; Harvanek & Stocke 2002). Worrall & Birkinshaw (2001) predicted that the brightest knot in the radio and optical jet of 3C 346 would be detectable with Chandra. Here we report the results of an observation made with the principal aim of detecting this emission and investigating the dynamical state of the radio jet.
In this paper we adopt values for the cosmological parameters of km s-1 Mpc-1, , and . Thus 1 arcsec corresponds to 2.77 kpc at 3C 346.
2 Observations
2.1 Chandra
We observed 3C 346 in FAINT data mode with the back-illuminated CCD chip, S3, of the Advanced CCD Imaging Spectrometer (ACIS) on board Chandra on 2002 August 3. Details of the instrument and its modes of operation can be found in the Chandra Proposers’ Observatory Guide, available from http://cxc.harvard.edu/proposer. Results presented here use ciao v3.0.2 and the caldb v2.26 calibration database. The data have been re-calibrated and analysed, with random pixelization removed and afterglow events included, following the software “threads” (http://cxc.harvard.edu/ciao) from the Chandra X-ray Center (CXC). The time-dependent ACIS gain correction was applied following the recipe from http://cxc.harvard.edu/contrib/alexey/tgain/tgain.html. Only events with grades 0,2,3,4,6 are used.
There were some intervals during the observation when the background rate as much as doubled, and these periods (about 10% of the exposure) were removed, leaving a calibrated data set with an observation duration of 41.082 ks.
The observation was made with a 256-row subarray, giving a 2 by 8 arcmin field of view. The subarray was used to reduce the readout time to 0.84 s and so decrease the incidence of multiple events within the frame-transfer time. The 0.5–3 keV event rate of roughly 0.06 counts per frame from the core results in a maximum pile-up over the image (at the core) of roughly 1 per cent.
2.2 Radio
We made a high-resolution (beam-size 0.11 arcsec 0.13 arcsec) image of 3C 346 from the VLA-archive A-array U-band (15 GHz) data of observation AO127, performed in December 1996. The data were flagged and self-calibrated using standard procedures within aips. Component sizes and fluxes were measured using the imfit task.
2.3 Optical
We have used four imaging data sets from the HST archive to characterize the morphology of the jet in the optical, and measure the broad-band optical to ultraviolet spectrum of the X-ray-bright knot. The data were taken with the STIS camera with (a) the CCD detector and clear 50CCD filter covering a broad band in the visual with effective wavelength nm (data set o61p01010, 828 s exposure, March 2000), (b) the CCD detector and F28X50LP filter with an effective wavelength nm (data set o4al11020, 937 s exposure, October 1997), (c) the NUV-MAMA detector and F25QTZ filter, with an effective wavelength nm (data set o5gv06k1q, 1800 s exposure, August 2000), and (d) the FUV-MAMA detector and F25SRF2 filter with an effective wavelength of nm (data set o5gv06k6q, 1734 s exposure, August 2000). The calibrated, flat-fielded, and distortion-corrected images were processed with the iraf task cosmicrays to remove residual cosmic-ray events. Net counts in the X-ray-bright knot were obtained using a box of area square arcsec with background measured from a nearby region where the galaxy surface brightness appeared to be comparable. The error table provided with the calibrated data was used to measure the uncertainties. The conversion from counts to flux density (in units of Jy) was obtained using the synphot package in iraf for an adopted spectral shape of . To measure the flux from optically-unresolved knots, such as that corresponding to the radio knot discussed in section 4.2, small (from 10 per cent in the optical to 25 per cent in the far ultraviolet) encircled energy corrections were applied using the information from www.stsci.edu/hst/stis/documents/handbooks/. The data were corrected for reddening due to dust in the line of sight in our Galaxy using the Galactic extinction curve of Seaton (1979), together with the expression given in Wilkes et al. (1994) (based on Burstein & Heiles 1978) to convert from (see section 3.3) to .
3 Results
3.1 X-ray, optical and radio morphology
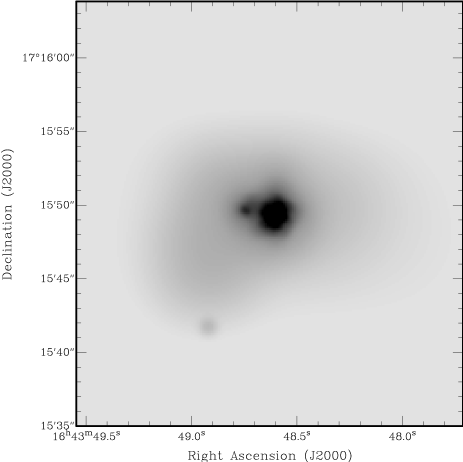
The image shown in Fig. 1 is the result of adaptively smoothing the Chandra data in the energy band 0.3-5 keV. It shows the main X-ray emission components which are
-
•
a diffuse atmosphere,
-
•
bright emission corresponding to the nucleus of 3C 346, and
-
•
fainter emission 1.95 arcsec east of the core, roughly corresponding to the brightest knot of 3C 346’s radio and optical jet.
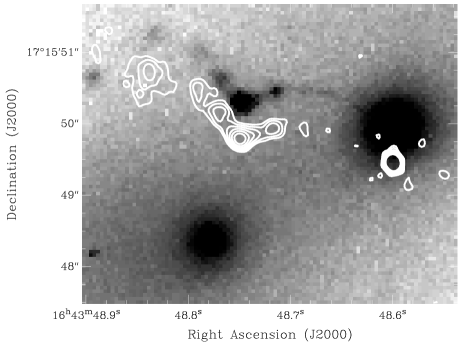
The diffuse X-ray emission is not oriented preferentially along the lobes of the radio galaxy, which span about 17 arcsec to the southwest and northeast (Spencer et al. 1991; van Breugel et al. 1992; Harvanek & Stocke 2002). Instead, the asymmetry is apparently due to X-ray-emitting gas encompassing both the host galaxy of 3C 346 and its companion galaxy. Optical emission from the two galaxies and the jet are shown in Fig. 2, where contours from our high-resolution radio map (section 2.2) are also shown, shifted so that the jet structure can be seen more clearly. The jet appears to be almost straight from the VLBI scale (Cotton et al. 1995) up to the point at which is can be seen above the galaxy emission in the optical in Fig. 2, after which it bends to the bright radio, optical and X-ray knot (knot C, following the notation of Dey & van Breugel 1994), then kinks by about 70 degrees, and continues to the eastern radio lobe with some further curvature.
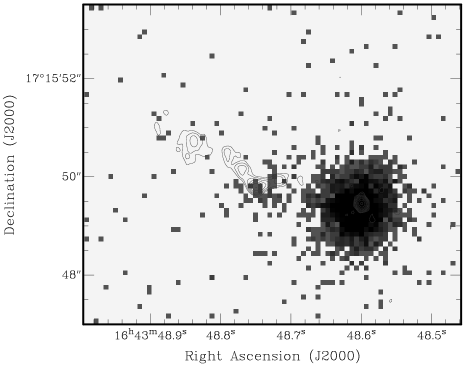
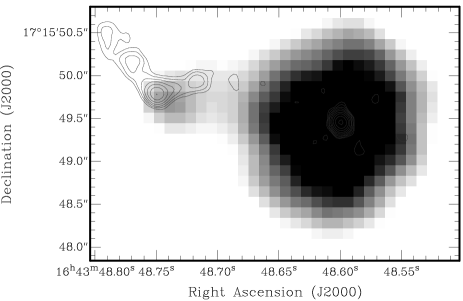
Figures 3 and 4 show the radio contours overlaid on unsmoothed and smoothed Chandra data, respectively. The jet-related X-rays peak slightly closer to the core than the radio (and optical) emission. The excellent spatial agreement between radio and optical jet features (Fig. 2) is already reported by de Koff et al. (1996) and de Vries et al. (1997).
The radio core in the 15-GHz map is at , . The centroid of the X-ray core, measured using the zhtools software (A. Viklinin, private communication), is at , , where the quoted uncertainties are relative to the astrometric solution derived from the positions of standard stars as measured by the Chandra Aspect Camera. The images in Figs. 3 and 4 are not shifted for the 0.12 arcsec offset in these core positions, which is mostly in declination, since this is within the Chandra absolute aspect uncertainties. The core and knot in the radio map are separated by 0.35 arcsec more than in the X-ray map, mostly in right ascension. The largest uncertainty in these measurements is in the X-ray centroid of the knot, but with 70 counts (see section 3.3.3) the centroid is located to better than 0.1 arcsec, and therefore we conclude that the offset between the X-ray and radio knots (a projected linear distance of 0.97 kpc) is real. One-dimensional profiles in X-ray, optical and radio along a line joining the core and knot C (Fig. 5) also illustrate this result. When the X-ray profile of the core is scaled to the counts in the knot and shifted by the 2 arcsec needed for the two to coincide, we find a good match. Since the X-ray core is dominated by unresolved emission (section 3.3.1) we can conclude that there is no indication of X-ray extension in the knot.


3.2 X-ray radial-profile analysis
Fig. 1 shows an envelope of emission extending more than 10 arcsec (28 kpc). The wings of the Point Spread Function (PSF) of the bright core are mixed with this emission, and so we use a radial-profile analysis to separate the core and galaxy-scale gas components that were confused in the larger beam of ROSAT (Worrall & Birkinshaw 2001).
Our method for modeling the PSF and fitting models to background-subtracted data follows Worrall, Birkinshaw & Hardcastle (2003). For extended emission we use a model, which describes the surface-density distribution with angular radius, , for isothermal gas in hydrostatic equilibrium as proportional to (Cavaliere & Fusco-Femiano 1978). The background was measured to be cts arcsec-2 (0.3–5 keV) from a rectangular region more than 3 arcmin from 3C 346, and thus beyond the cluster-scale gas component measured with ROSAT (Worrall & Birkinshaw 2001). This cluster gas should show up as a roughly flat component in our Chandra radial profile. We have modeled it as a model, fixing the parameters to the ROSAT-derived best-fit values of = 0.9, = 78 arcsec, and allowing the normalization to be a free parameter. Both a point source and a model of galaxy scale must be added to the cluster-scale component to obtain a good fit to the data (Fig. 6). Uncertainties in model parameters are determined as described in Worrall & Birkinshaw (2001).

| Parameter | Value |
|---|---|
| point-source counts | |
| (galaxy) | |
| (galaxy) | arcsec |
| galaxy-model counts, arcsec | |
| (cluster) | 0.9 (fixed) |
| (cluster) | 78 arcsec (fixed) |
| cluster-model counts, arcmin | |
| cluster-model counts, arcmin | (extrapolated) |
For the point source and galaxy-scale model, the uncertainties are for two interesting parameters due to the correlation between and , and between counts in the two components. The uncertainty in the cluster-model counts is for one interesting parameter.
3.3 X-ray spectra
Using our image analysis as a guide, we fitted spectral models to the 0.3-10 keV counts from various regions. In all cases the X-ray spectra are binned to a minimum of 30 counts per bin, and all spectral fits include absorption along the line of sight in our Galaxy assuming a column density of cm-2 (from the colden programme provided by the CXC, using data of Dickey & Lockman 1990).
3.3.1 X-ray core
An unresolved component heavily dominates the emission at small radii (Fig. 6). Within 1.23 arcsec of the centre the contribution from the resolved thermal components should be less than 1%. Taking background from an annulus of radii 5 and 25 arcsec, we find a good fit ( for 73 degrees of freedom: Fig. 7) to a power law of spectral index () and intrinsic absorption cm-2, where uncertainties are for 2 interesting parameters. The 1 keV normalization, corrected for the small fraction of missing counts in the wings of the PSF, is photons cm-2 s-1 keV-1, which is nJy. The 0.3-5 keV luminosity of the emission (before absorption) is ergs s-1.
If there is an mag towards the nucleus, as Dey & van Breugel (1994) have inferred is necessary to obscure the broad emission-line region, if one is present, a gas-to-dust ratio similar to our Galaxy would imply a line-of-sight hydrogen column density to the nucleus of cm-2. If there is an accretion-related X-ray component with the same power-law index as we have measured lying behind an absorption of cm-2 we can set a 90% confidence upper limit on its 0.3–5-keV luminosity (before absorption) of ergs s-1. For a larger , the luminosity of such a central emission component could be higher.

3.3.2 Gas components
The radial profile shows that the gas component that resembles a galaxy-scale -model is mixed with core emission at small radii and with cluster-scale gas at large radii. The annulus in which the galaxy-scale emission should dominate is rather narrow and will contain significant contributions from these other components.
Firstly, we extracted the counts in a source-centred circle of radius 9 arcsec, excluding a circle of radius 1 arcsec around the knot to the east of the core. Background is measured in an annulus of radii 20 and 25 arcsec, so that the contribution of the cluster-scale component should effectively be removed. As expected, the fit is dominated by the slightly-absorbed power-law component that fitted the core spectrum, but an improved (by 12) is obtained when a thermal component is included. The fit (which gives =73 for 85 degrees of freedom) is insensitive to the abundances, which we fixed at 0.5 solar. The fitted temperature of the thermal component is keV ( error for 2 interesting parameters). The parameters for the power-law component are consistent with those found in the fit to the core spectrum.
Secondly, we extracted the counts in a source-centered annulus of inner radius 5 arcsec and outer radius 1 arcmin. The counts from an unrelated X-ray source about 46 arcsec to the south were excluded. The background was the region more than 3 arcmin from the source that was used for the radial profile. We found excellent fits with Galactic absorption (as might be expected away from the nucleus, increasing our confidence in the detection of a small intrinsic absorption for the core), and so no intrinsic absorption is included in the following results. The fit to a single-component thermal of keV and abundances of about 0.5 solar was formally marginally acceptable ( for 98 degrees of freedom), but two thermal components gave a much improved description of the data ( for 95 degrees of freedom), with the lower temperature matching that found in the fit to the data from the 9-arcsec-radius circle. The abundances were not well constrained and were both set to be 0.5 times solar. The fitted temperatures are keV and keV ( errors for 2 interesting parameters).
We made further annular extractions, varying the extraction radii to examine the division of counts between the hot and cold gas components in the spectral fits, and comparing with expectations from the radial fit. When we associated the cooler temperature with the galaxy-scale component and the hotter temperature with the cluster, we found agreement with the radial-profile results as long as the galaxy emission (with flat best-fit ) truncates at a radius of less than 1 arcmin (about 50 kpc, or 18 arcsec fits best). We then used the fit of the counts from an annulus of inner radius 20 arcsec and outer radius 1 arcmin to a single-component thermal to get an improved description of the temperature of the cluster gas, finding keV ( error).
Using a combination of the radial and spectral analysis to describe the distribution of counts with radius and energy, we estimate the bolometric luminosity of the hot gas in the galaxy to be ergs s-1 out to a radius of 50 kpc, and the total luminosity of the cluster (integrating out to infinity, since ) to be ergs s-1. The galaxy atmosphere agrees well with the luminosity-temperature relation for the atmospheres around other nearby radio galaxies (Worrall & Birkinshaw 2000). The cluster luminosity is marginally lower than that expected for agreement with the temperature-luminosity relationship for clusters (e.g., Arnaud & Evrard 1999), perhaps suggesting that the cluster is in an interesting dynamical state, but the uncertainties are large due to the subarray used for the Chandra observations and the source’s relative proximity, which distributes cluster counts over much of the image.
3.3.3 X-ray knot
The X-ray counts from the knot were measured using a circle of radius 0.984 arcsec. Background was measured from five non-overlapping circles of the same radius at an equal distance from the nucleus. The knot yielded 70 net counts. Its spectrum was measured using the Cash statistic in xspec with no intrinsic absorption, and found to be consistent with ( uncertainty). The 1 keV flux density is nJy.
4 Discussion
4.1 Gas properties
There are two X-ray emitting gaseous atmospheres around 3C 346. The first, of cluster dimension was known previously, and its temperature ( keV) agrees with the ASCA results of Worrall & Birkinshaw (2001), to within the rather larger ASCA uncertainties. The second, of galaxy scale and keV is found only because of the high spatial resolution of Chandra. At 2 arcsec from the core, using the equations of Birkinshaw & Worrall (1993) to deproject the surface brightness [see also Worrall & Birkinshaw (2004) for a more extensive treatment], we find the pressures of the galaxy gas and cluster gas to be and Pa, respectively. (Uncertainties are 1 sigma for 2 interesting parameters, and these values should be multiplied by 10 to give units of dynes cm-2 used by many authors.) It is interesting to note that the radius, arcsec, at which the galaxy-gas and cluster-gas pressures become equal, and total Pa, is similar to the maximum radial extent of the radio source. Perhaps more interestingly, if the jet were at an angle of degrees to the line of sight, the pressures in the two gas components would be equal at the X-ray-bright knot, the position at which the radio jet changes direction by almost 70 degrees as seen in projection (a smaller bend angle being accommodated if the jet is indeed at less than 90 degrees to the line of sight.) Such an angle to the line of sight is consistent with Giovannini et al. (2001; see also Cotton et al. 1995) who argue, based on jet-sidedness and core dominance, that the angle to the line of sight is less than 30 degrees and the bulk Lorentz factor is greater than 1.7. We suggest below that the jet bending is the result of a oblique shock due to interactions between the jet and the wake in the cluster medium behind 3C 346’s companion galaxy. In this case the knot must lie beyond the influence of the galaxy gas. The wake will slightly disturb the galaxy gas from the spherical distribution we have adopted. Since there are reasons that the angle to the line of sight should not be too small (see below), we adopt 20 degrees as the angle between the line of sight and the jet. This is consistent with all the evidence.
Whereas the cooling time of the cluster gas is larger than the Hubble time, the galaxy-scale gas has a cooling time less than years even out to its maximum radius of 18 arcsec. Although the gas extends beyond the radio lobes, the radio source should be providing heat to the gas through the conversion of mechanical energy. Whether or not this is sufficient to regulate a cooling flow in the gas is a matter of speculation for this source, whose relatively high redshift results in the galaxy gas having too little contrast against the core for temperature structure to be studied.
4.2 Internal and external pressures at the jet knot
We measure the bright radio knot (knot C in the notation of Dey & van Breugel 1994) to have a 15-GHz flux density of mJy and have a (slightly elliptical) deconvolved size corresponding to a sphere of radius 0.043 arcsec. If we assume that the knot is unbeamed and has equal energy density in radiating particles and magnetic field, and thus is radiating at close to minimum total energy (assuming no non-radiating particles and a uniform filling factor), then the magnetic field is nT (720 Gauss) and the pressure in the knot is Pa, which is much larger than the pressure in the external medium which is no more than Pa.
A way to reduce the internal pressure is to assume that the knot has bulk relativistic motion towards the observer, in which case under equipartition the magnetic-field strength is reduced by a factor of and the internal pressure is reduced by a factor of (e.g., Worrall & Birkinshaw 2004), where is the bulk relativistic Doppler factor. We would require 111Actually a little larger since with large and small angle to the line of sight the knot will be further out in the atmosphere where the external pressure is lower. to bring the two pressures into agreement under these simple assumptions, with the required values for the components immediately to the east and west of knot C being 6.8 and 5, respectively. A value of as large as 19 is only obtained if the jet is less than 3 degrees to the line of sight, which we consider unlikely based on the radio/optical/X-ray energy distribution of the core being similar to radio galaxies rather than quasars (see Worrall and Birkinshaw 2001), the absence of broad H (Dey & van Breugel 1994), and resulting disagreement with the core-prominence analysis of Cotton et al. (1995).
It seems more reasonable to suggest that the angle to the line of sight is about 20 degrees, and the maximum relativistic Doppler factor, , is of order 3. In this case, the X-ray-bright knot is overpressured by a factor of about 40 with respect to the external medium. Similar overpressures are seen between terminal hotspots and external gas (e.g., in Cygnus A; Carilli et al. 1996), and thus the presence of an overpressure of the magnitude we infer in knot C of 3C 346 is not a proof that the knot structure is due to something other than a jet fluid/external medium interaction. Overpressure is also consistent with the observation, based on the radio and optical, that the knots exterior to knot C are considerably larger than those up to the 70-degree bend, and the inference that the jet expands under the influence of overpressure at knot C.
4.3 Jet emission mechanism
The VLA, HST, and Chandra flux densities of the X-ray-bright knot are given in Table 2, and they are plotted in Fig. 8. The radio spectral index in the X-ray-bright knot is , suggestive of particle re-acceleration (Spencer et al. 1991).
| (Hz) | |
|---|---|
| mJy | |
| Jy | |
| Jy | |
| Jy | |
| Jy | |
| nJy |

Using methods described in Hardcastle, Birkinshaw & Worrall (2001), we find that synchrotron-self-Compton emission with an equipartition magnetic field under-predicts the X-ray emission, and any beaming will reduce it further. Inverse Compton scattering of the cosmic microwave background (CMB) is increased if the jet is highly relativistic and at small angle to the line of sight. If the magnetic field is held at 72 nT, the observed luminosity at a given frequency from inverse-Compton scattering of an isotropic radiation field (such as the CMB) will be increased relative to the synchrotron luminosity by or, if the field is reduced by a factor of to bring it back into equipartition, the relative increase is by (Dermer 1995). For the factor of increase needed to explain the X-rays by this mechanism, we would require the unlikely situation (see above) that is about 450 or 22, for the two assumptions concerning the magnetic field. We thus conclude that the jet X-ray emission is synchrotron radiation.
There are two features that are in common with results reported previously for closer synchrotron jets. The most obvious, seen in Figs. 4 and 5, is the offset between the radio and X-ray emission, with the X-ray emission arising from closer to the nucleus. (The optical and radio knots show strong correspondence.) This phenomenon, first reported in 3C 66B (Hardcastle et al. 2001), is now seen in a number of sources, most notably Cen A, whose proximity gives the best spatial resolution and permits interpretation of the data in terms of a shock model where the acceleration of low-energy electrons that produce strong radio emission occurs in a turbulent shock region downstream of a main shock (Hardcastle et al. 2003). Our interpretation of 3C 346 in section 5.2.1 could produce a similar situation.
The second feature is the size of the spectral break in a synchrotron component connecting the radio and optical emission. The value for 3C 346 () is within the range to seen in other sources, with M 87 (Böhringer et al. 2001) and 3C 66B (Hardcastle et al. 2001) having some of the best available multiwavelength coverage. Synchrotron energy losses within the context of a simple continuous-injection model predict . However, the offset between the X-ray and radio emission already tells us that there is spatial substructure, and it is likely that the radio and optical regions contain a sum over different electron spectra.
The radiative half-life of electrons producing synchrotron radiation of frequency Hz in a magnetic field of Tesla is years, which in the case of 3C 346’s X-ray emission is years in an equipartition magnetic field. For , this implies an X-ray-emitting region which is only about 5 per cent of the measured radio size of knot C unless there is distributed particle acceleration, and there is a chance that a further deep Chandra observation might detect flux variability.
4.4 The core
Chandra has improved upon previous knowledge of the core spectrum from ROSAT and ASCA (Worrall & Birkinshaw 2001) by turning upper limits to the intrinsic column density into a detection of cm-2 (Section 3.3.1, Fig. 7). The relatively small intrinsic absorption measured for the X-ray core supports our earlier conclusions that the emission is jet-related in origin. The Chandra spectral index is consistent with that found from ROSAT and ASCA, and the fact that the X-ray emission from the galaxy is only about 10% of the strength of the core makes it unlikely that a varying degree of confusion of galaxy emission in the different beam sizes of ROSAT and ASCA is responsible for the reported X-ray variability of 32% between ROSAT and ASCA observations. The Chandra normalization is in broad agreement with that found with ASCA.
5 Interpretation of the jet
The basic question to ask of the X-ray bright knot (as of the other knots in the jet) is whether it has come from the nucleus with roughly its current properties, or whether there is some physical process at its present location which has made it so bright. That is, is the jet largely a ballistic or hydrodynamic phenomenon?
5.1 Ballistic jet?
One can argue for the ballistic case on the basis of the presence of a number of knots within the continuous optical structure that extends from the centre of 3C 346’s host galaxy to knot C and beyond. The increase in brightness of the optical knots as knot C is approached, and then the decrease after that point, might be taken as evidence that knot C is bright because of a combination of geometry and relativistic effects.
It is possible to construct a kinematic model for the shape of the jet of 3C 346 based on a precessing beam of ballistic knots, although it is necessary to allow for some decrease in the speed of the knots as they propagate. Knot C and its associated sharp bend can then be interpreted as a cusp in the projected figure of motion of components propagating away from the core. Under this interpretation, knot C is bright because of a combination of a long line-of-sight path through the jet and relativistic beaming. If this is the case, we would expect the structure of knot C to be complicated when viewed at high angular resolution, and we would also expect the knot to show low radio and optical polarization, because several independent regions are being seen in superposition. Thus the high (17 per cent) radio polarization of knot C measured at 8.4 GHz by Akujor & Garrington (1995) argues against a ballistic model for the jet. Furthermore, there is no simple explanation for the offsets between the radio and X-ray peaks of knot C in this model.
Another reason why we disfavour a ballistic model is based on the changing angular sizes of the knots to either side of knot C. In a ballistic model, the apparent expansion of knots between and arcsec from the core implies a real increase in the proper sizes of the knots. Adiabatic losses should therefore cause the synchrotron emissivity of the knots to drop by a factor of 10 or more between the knots west of knot C and those to the east, while the relativistic boosting factors of knots west and east should be similar. It is apparent from Fig. 2 that the total fluxes in the knots immediately west and east of knot C are, in fact, comparable. The ballistic model is then viable only if the intrinsic emissivity of the knots increases with distance from the core, presumably as a result of interaction with the external medium.
Finally, we note that the knots on either side of knot C have different morphologies. To the west the knots are unresolved across the jet, while to the east they are resolved both across and along the jet. Assuming steady expansion of ballistic knots, a major change of knot morphologies across knot C requires a fine-tuned alignment of the line of sight with the edge of the cone defined by the velocity vectors of knots.
5.2 Hydrodynamic jet?
5.2.1 An oblique shock as an explanation for the kink at knot C
The abrupt change of direction of the jet at knot C can alternatively be attributed to an oblique jet shock. While the degree change in direction of the jet at knot C is larger than the maximum change of direction of a flow in an oblique shock ( for a relativistic fluid), relatively modest orientation effects (such as the jet lying about 20 degrees to the line of sight; section 4.1) are sufficient to make the projected bend at knot C as large as 70 degrees.
The strong X-ray and radio emission from knot C can then be interpreted as the result of enhanced particle acceleration near the jet shock. The X-rays would be expected to come from an unresolved component, since the lifetime of X-ray emitting electrons is at most a few tens of years (section 4.3). The radio-emitting electrons are of significantly lower energy and longer radiative lifetimes, and so might both be accelerated and be detectable over a larger volume, perhaps out to a weaker shock, beyond the jet, caused by the supersonic advance of knot C into the intergalactic medium. This might explain the offset between the radio and X-ray centroids of the knot (Fig. 4).
The oblique-shock model would suggest that the jet flow remains supersonic after it passes through the jet shock, although it is slowed and broadened there. The obliqueness of the jet shock can also allow knot C to advance relatively slowly into the intergalactic medium, so that the downstream segment of jet, to the E of knot C in Fig. 2, can form.
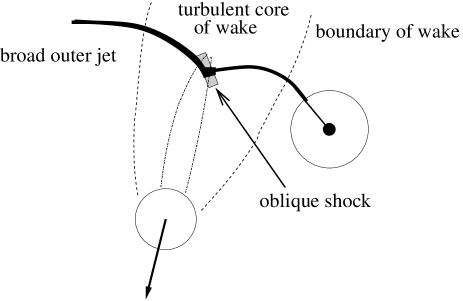
It is known (Dey & van Breughel 1994) that the relative line-of-sight velocity between the companion galaxy and the host of 3C 346 is , or about half the speed of sound in the intergalactic gas. This suggests that the wake of the companion is likely to be strong, and so knot C might occur where the jet of 3C 346 crosses the turbulent centre of the wake. Fig. 9 sketches the proposed geometry.
While the idea of an oblique shock is speculative, it could be investigated by high-sensitivity mapping of the temperature and velocity widths of X-ray lines from the gas near the jet, and a detailed study of the radio and optical morphologies of knot C.
Under this interpretation, we predict that the oblique shock will generate a relatively simple polarization pattern in the brightest part of knot C, with the magnetic-field direction at position angle degrees. This is consistent with the high radio polarization measured by Akujor & Garrington (1995), but improved high-resolution radio and optical polarization studies of 3C 346 are needed to test this prediction, and so to distinguish between the oblique-shock and ballistic models.
5.2.2 General jet curvature
If we adopt the concept of an oblique jet shock, then the jet is interacting strongly with the medium through which it moves supersonically, and we should explain the curvature in the jet as a hydrodynamic phenomenon. We note that the curvature is concave upwards on either side of knot C. We interpret this as due to a large-scale pressure gradient.
If a pressure gradient is to cause bending on a projected scale kpc in the cluster-scale atmosphere where the pressure gradient is low (since the core radius kpc ), the jet must be light and highly supersonic. Under these conditions the jet opening angle will be small, as is observed (Fig. 2), and the bending of the jet would be accompanied by a number of internal and external shocks as the jet responds to the external pressure gradient. A calculation assuming that these shocks are weak, that the jet responds as a homogeneous cyclinder to the external pressure gradient, and that the flow is steady and non-relativistic then leads to an estimate of the jet density
| (1) |
where is the Mach number and kg m-3 is the density of the cluster gas near the jet. If we also assume that the kinetic energy flux down the jet is sufficient to power the eastern lobe of the radio source, we find that the jet speed must be relativistic, and beaming effects sufficient to make the source appear one-sided are likely for the jet orientation suggested in section 4.1. Under these circumstances, detailed calculations of the characteristics of the flow are necessary (and equation 1 overestimates the density of the jet).
This bending model can be tested by looking at the polarization pattern of the inner jet knots, where we would expect to see ordering of the magnetic field by fans of weak shocks, or by detailed X-ray spectroscopy of gas near the jet, where we might expect to see local heating. While the former test should be possible by detailed HST or VLA polarimetry, the necessary X-ray spectroscopy is currently impractical.
6 Summary
The Chandra observations have detected two new X-ray components associated with 3C 346. The first is emission from the bright knot in the jet, and the second is a relatively luminous X-ray-emitting atmosphere of galaxy scale. The knot X-ray emission is too bright for inverse Compton models, and we infer that the emission mechanism is synchrotron, and the region is one of particle re-acceleration. There are similarities to emission regions in the inner regions of low-power FRI jets both in the multiwavelength spectrum and the fact that the X-ray emission peaks closer to the core than the lower-frequency emission. The radio jet bends by an apparently large angle of about 70 degrees (less if, as we favour, the jet is at about 20 degrees to the line of sight) and continues. Thus the knot in 3C 346 does not appear to have the nature of a terminal hotspot, for which there are some cases where synchrotron radiation is the favoured X-ray emission mechanism (e.g., Harris, Leighly & Leahy 1998; Wilson, Young & Shopbell 2001), but rather a re-acceleration region after which the jet re-collimates and continues. It is therefore interesting that we appear to be seeing in 3C 346 a more powerful version of phenomena observed in nearby, low-power jets.
We have suggested that an oblique shock associated with interactions between the jet and the wake in the cluster medium behind 3C 346’s companion galaxy is responsible for the X-ray-bright knot and the sharp bend in the jet. Pressure gradients in the cluster atmosphere can cause the steady curvature in the jet each side of the knot. Since the knot must then lie beyond the influence of the galaxy atmosphere, the angle to the line of sight must be about 20 degrees or less, although angles smaller than about 20 degrees are disfavoured based on the fact that 3C 346 differs observationally from a quasar in several ways.
High-resolution studies of the polarization properties of the jet (Perlman et al., in preparation) in comparison with the multiwavelength data should help to describe the details of the acceleration structures and mechanisms, and should test the hydrodynamic model we favour against a ballistic model. Velocities for more members of the cluster would test the hypothesis that it is 3C 346’s host galaxy that is at rest and the companion galaxy that is moving with respect to the cluster gas.
Acknowledgements
We than the CXC for its support of Chandra observations, calibrations, and data processing. This work also used observations made with the NASA/ESA Hubble Space Telescope, obtained from the data archive at the Space Telescope Science Institute, and the VLA archive supported by the National Radio Astronomy Observatory. The CXC is operated for NASA by the Smithsonian Astrophysical Observatory, STScI is operated by the Association of Universities for Research in Astronomy, Inc. under contract from NASA, and the NRAO is a facility of the National Science Foundation operated under cooperative agreement by Associated Universities, Inc. We also thank the anonymous referee for helpful suggestions as to where the clarity of the original text could be improved.
References
- [1] Akujor, C.E., Garrington, S.T., 1995, A&AS, 112, 235
- [2] Arnaud, M., Evrard, A.E., 1999, MNRAS, 305, 631
- [3] Birkinshaw, M., Worrall, D.M. 1993, ApJ, 412, 568
- [4] Böhringer, H. et al., 2001, A&A, 365, L181
- [5] Burstein, D., Heiles, C., 1978, ApJ, 225, 40
- [6] Carilli, C.L., Perley, R.A., Bartel, N., Sorathia, B., in Hardee, P., Bridle, A., Zensus, A., eds, Energy Transport in Radio Galaxies and Quasars, PASP Conference Series, vol. 100, p. 287
- [7] Cavaliere, A., Fusco-Femiano, R., 1978, A&A, 70, 677
- [8] Cotton, W.D., Feretti, L., Giovannini, G., Venturi, T., Lara, L., Marcaide, J., Wehrle, A.E., 1995, ApJ, 452, 605
- [9] de Koff, S., Baum, S.A., Sparks, W.B., Biretta, J., Golombek, D., Macchetto, F., McCarthy, P., Miley, G.K., 1996, ApJS, 107, 621
- [10] Dermer, C.D., 1995, ApJ, 446, L63
- [11] de Vries, W.H. et al., 1997, ApJS, 110, 191
- [12] Dey, A., van Breugel, W.J.M., 1994, AJ, 107, 1977
- [13] Dickey, J.M., Lockman, F.J., 1990, ARA&A, 28, 215
- [14] Fabbiano, G., Miller, L., Trinchieri, G., longair, M., Elvis, M., 1984, ApJ, 277, 115
- [15] Giovannini, G., Cotton, W.D., Feretti, L., Lara, L., Venturi, T., 2001, ApJ, 552, 508
- [16] Hardcastle, M.J., Birkinshaw, M., Worrall, D.M., 2001, MNRAS, 326, 1499
- [17] Hardcastle, M.J., Worrall, D.M., Kraft, R.P., Forman, W.R., Jones, C., Murray, S.S., 2003, ApJ, 593, 169
- [18] Harvanek, M., Stocke, J.T., 2002, ApJ, 124, 1239
- [19] Harris, D.E., Leighly, K.M., Leahy, J.P., 1998, ApJ, 499, L149
- [20] Laing, R.A., Riley, J.M., Longair, M.S. 1983, MNRAS, 204, 151
- [21] Seaton, M.J. 1979, MNRAS, 187, 73P
- [22] Spencer, R.E. et al. 1991, MNRAS, 250, 225
- [23] van Breugel, W.J.M., Fanti, C., Fanti, R., Stanghellini, C., Schilizzi, R.T., Spencer, R.E., 1992, A&A, 256, 56
- [24] Wilkes, B.J., Tananbaum, H., Worrall, D.M., Avni, Y., Oey, M.S., Flanagan, J. 1994, ApJS, 92, 53
- [25] Wilson, A.S., Young, A.J., Shopbell, P.L., 2001, ApJ, 547, 740
- [26] Worrall, D.M., Birkinshaw, M., 2000, ApJ, 530, 719
- [27] Worrall, D.M., Birkinshaw, M., 2001, ApJ, 551, 178
- [28] Worrall, D.M., Birkinshaw, M., 2004, book chapter in Alloin, D., Johnson, R., Lira, P., eds, Physics of Active Galactic Nuclei at all Scales, Springer Verlag, Lecture Notes in Physics series, in press (astro-ph/0410297)
- [29] Worrall, D.M., Birkinshaw, M., Hardcastle, M.J., 2003, MNRAS, 343, L73
- [30] Zirbel, E.L., 1997, ApJ, 476, 489