The broad-band X-ray spectrum of the blazar PKS B1830211 by Chandra and INTEGRAL
In this paper we present a broad-band study of the X-ray emission of the blazar PKS 1830211 based on Chandra and INTEGRAL observations. Notwithstanding the high redshift (=2.507), it is a bright X-ray source (F(2-10 keV) erg cm-2s-1), due to gravitational lensing by an intervening galaxy at =0.89. Previous X-ray observations attribute the observed absorption at E2 keV to the lensing galaxy. Our analysis, although not in contrast with this hypothesis, suggests also the possibility of an intrinsic (ionized) absorption, taking place at the front side of the jet. This scenario is also supported by some evidence, in the same data, of a feature observed at 2.15 keV which can be interpreted as a blueshifted iron line (). The SED of PKS 1830211 can be well modelled by combining a Synchrotron Self-Compton component and an external source of photons to be scattered up to -ray energies by relativistic electrons moving outward in the jet. The main source of low energy photons is a dust torus at the temperature of 103 K as expected in MeV blazars.
Key Words.:
radiation mechanisms: non-thermal - galaxies: active - X-rays: galaxies: individual: PKS B18302111 Introduction
PKS B1830211 is a high redshift blazar (, Lidman et al. 1999) gravitationally lensed by an intervening galaxy at . Its radio image shows two compact components separated by about 1′′ and believed to arise from the core of the source (hereafter North-East NE and South-West SW components), plus a ringlike extended structure arising from the jet (Wiklind & Combes 1996), connecting the compact components (Nair et al. 1993, Pramesh Rao & Subrahmanyan 1988). In the radio band the source shows strong variability (Lovell et al. 1998) and has a flat spectrum. It was also observed in the infrared (Lidman et al. 1999), in the X-rays (Mathur & Nair 1997, Oshima et al. 2001) and in the -rays (Mattox et al. 1997, Bassani et al. 2004).
data showed that the X-ray spectrum is best represented by a power law absorbed at the redshift of the lens galaxy by a column density cm-2; no additional absorption component was required, suggesting that both lensed images are covered by the same absorber (Mathur & Nair 1997). On the contrary, data showed that the spectrum is consistent with two absorption components having different column densities: cm-2 and = () cm-2 (Oshima et al. 2001), explained by the authors with the view that the low- and high-absorbing component correspond to the NE and SW lensed images, respectively. The ratio of the two magnification factors was 0.21, smaller than the value found at radio wavelengths which was 1.55 (Lovell et al. 1998). In this paper we investigate the broad-band X-ray spectrum of PKS 1830211 observed by Chandra and INTEGRAL . In section 2 we describe the observations while data analysis is presented in Section 3. In section 4 the nature of the complex absorber is discussed, while in Section 5 the SED of PKS 1830211 is derived and a possible emission model is presented. We summarize our results and conclusions in Section 6.
2 Observations and data reduction

2.1 INTEGRAL
PKS1830-211 is one of the AGNs detected by in the Galactic Center region (Bassani et al. 2004). It has been reported as an source by Bird et al. (2004) and Revinivtsev et al. (2004) and at a redshift of 2.507 it is the farthest object so far detected by . The observational data reported here refer to the first survey which consists of several pointings carried out between 2003 February 28 to October 10. The total on source exposure is 714 ksec, providing a detection at 14 confidence level. The mean counting rate is 0.290.03 counts s-1 both in the 20–40 and 40–100 keV band, a clear indication of a hard spectrum. These count rates correspond to a flux of roughly 3 (2.4) and 4 (3.9) mCrab (10-11 erg cm-2 s-1) in the two bands, respectively. ISGRI images for each available pointing were generated in narrow energy bands using the ISDC offline scientific analysis software OSA version 3.0 (Goldwurm et al. 2003), including background uniformity corrections (Terrier et al. 2003). Source ghosts have been removed from each image using a catalogue built iteratively and containing at end all sources detected. The individual images were then combined to produce a mosaic of the region of interest in broader bands to enhance the detection significance using the system described in details by Bird et al. (2004).
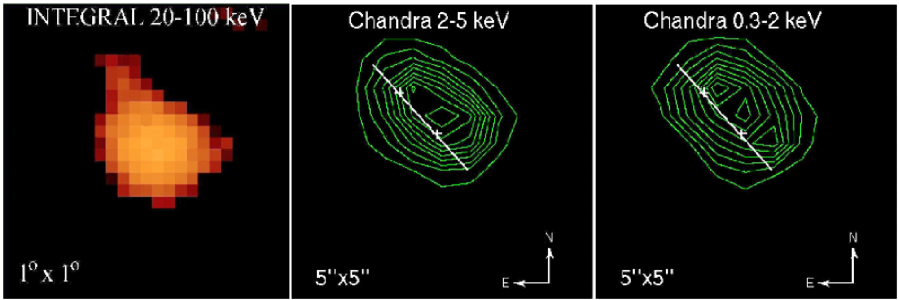
The combined 20-100 keV image of the source is shown in the left panel in Figure 1. The ISGRI image is point-like, the extension is compatible with the PSF of the instrument.
2.2 Chandra
observations of PKS B1830211 were performed on two occasions, one year apart in 2000 June 26-27 and 2001 June 25, for a total exposure of about 50 ks. The source did not show evidence of variability between the two pointings. The good spatial resolution allow us to observe the two lensed images, with an angular distance of the order of the Chandra resolution limit (). In Figure 1 we show the ACIS contour levels extracted in two separate energy ranges 0.3-2 keV (right panel) and 2-5 keV (middle panel). It the figure we indicate also the position of the NE and SW component taken from radio observation (Pramesh Rao & Subrahmanyan 1988). The offset between radio and X-rays image is less than 1′′. There is evidence for an ellipsed shape in both images, as showed by the plotted contours, and the two main components of the lensing effect are visible. In Figure 2 we plot the X-ray intensity profiles along the major axis of the ellipse which shows that it is significantly larger than the ACIS PSF. The ACIS PSF is very sharply peaked on-axis, with a FWHM less than half an arcsec111See The Chandra Proposers Observatory Guide (http://asc.harvard.edu/proposer/POG/html/MPOG.html). The ratio between the counts from the NE and SW components is about 1.5 in both 0.3–2 keV and 2–5 keV energy range similar to the value observed at radio frequencies. This result indicates that the absorbing gas column densities of the two components cannot be very different, contrary the findings of Courbin et al. (2002) in the optical and near-IR, where the SW component seems to be much weaker than the NE one.
3 Spectral analysis and results
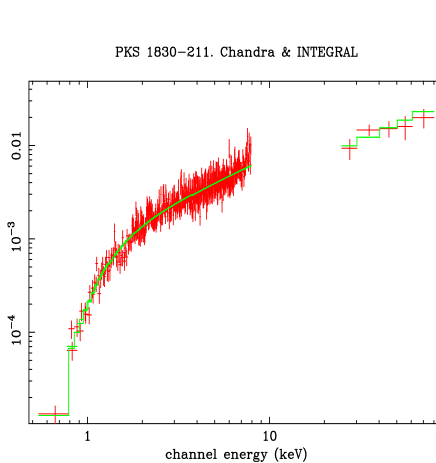
Spectral analysis has been performed fitting the data of both Chandra observations combined together, in fact fitting them separately does not provide evidence for a significant difference. We first apply a simple power–law absorbed by Galactic gas ( cm-2 , Stark et al. (1992)) in the whole range 0.5–8 keV and obtain a poor fit with /dof=725/459. A better result is found fitting the data at energies higher than 2 keV , where the absorption is not relevant. In this case the above model gives a /dof=389/377 with a photon index =1.020.05 and an estimated flux . However, the data to model ratio in the energy range 2–8 keV shows clear systematic residuals below 5 keV in the source frame (Figure 3). INTEGRAL spectrum in the hard X-ray energy range 20-80 keV is also well reproduced by this flat power–law model, confirming that the broad–band spectrum remains remarkably flat up to 80 keV. This will be discussed in more detail in the next Section.

4 The nature of the absorption
Spectral flattening at energies less then 2 keV has been found in radio-loud quasars having a redshift up to 4.4, using ASCA and XMM-Newton data (Fiore et al. 1998, Reeves & Turner 2000, Worsley et al. 2004, Yuan et al. 2003 and references therein). Absorption has been suggested as the likely explanation for this flattening but the data collected up to now do not allow one to distinguish between an intrinsic absorber at the source redshift or an absorbing system along the line of sight. However, the UV-optical extinction observed in most of these objects, is inconsistent with the high column density required to produce the flattening observed in X-rays. It was suggested that this gas could be ionized (Fabian et al. 2001), i.e. a warm absorber similar to that present in Seyfert 1 galaxies. Another possibility is that of an intrinsic low energy cut-off in the electron spectrum as proposed for other similar objects (Celotti & Fabian 1993, Sikora et al. 1997).
| / | /dof | ||||||
| 0.5-8keV | - | 0.78 | 8.6 | 1 | 482/458 | ||
| 0.5-8keV | 0.78 | 9.1 | 1 | 517/457 | |||
| 0.5-80keV | - | 0.78 | 8.5 | 1 | 485/462 | ||
| Note: (1) is the column density at redshift of the lens galaxy =0.89, in the column density of the warm gas at redshift of the source =2.51, both are in cm-2; (2) in erg cm s-1; (3) in | |||||||
First, we attempted to reproduce the low-energy spectral break
with a cold absorber (in addition to the Galactic one) at the redshift of
the lens galaxy (=0.89)
as proposed by previous ROSAT (Mathur & Nair (1997)) and
ASCA (Oshima et al. (2001)) observations.
The best fit values are reported in the first line of Table 1.
Chandra data of both observations are well fitted with a single
flat power-law,
with photon index =1.090.05,
absorbed by a cold gas with NH 21022 cm-2 at =0.89 (/dof=482/458).
Data and the folded model are shown in Figure 4 (left panel).
INTEGRAL data, taken one year after Chandra observation, are also
well reproduced by this continuum.
The constant of cross–calibration Chandra /INTEGRAL was free to vary
during the fit and was found to be C=0.570.13.
The broad–band spectrum of
PKS 1830211 is shown in Figure 5, and the best fit values are reported
in the last line of Table 1.
We also test the possibility that the absorbing gas is intrinsic to
the source, by fitting Chandra data with a warm absorber model.
Best fit values are reported in the second line of Table 1.
The fit is good (/dof=517/457) even if
not better with respect to that of a cold gas at =0.89.
This result suggests the presence of a mildly ionized gas with
the column density cm-2 ,
and an upper limit to the ionization parameter
erg cm s-1, where is the inferred isotropic
luminosity in the 2-10 keV rest frame of the blazar while and
are the absorber density and the distance from the source,
respectively.


Chandra data show some evidence () in each observations of an emission feature around 2.15 keV with an intensity of ph cm-2 s-1 and an equivalent width of about 50 eV (see right panel in Figure 4). The line is not resolved in the ACIS-S, setting the intrinsic width to be eV. Chandra -HETG spectra are consistent with ACIS data, and set a lower limit on the intrinsic width to be 10 eV. It is important to note that the residuals around the line are of the order of few tens of per cent, while the instrumental systematic effects at this energy are of the order of few per cent. The energy of the line at the redshift of PKS 1830211 is 7.54 keV thus suggesting an association with a blueshifted iron line. This feature could be produced in the ambient matter around the source. If the line is due to neutral iron, the implied velocity for the gas has to be . It is interesting to note that if the warm gas with a column density of 1023 cm-2 covers a solid angle of 2 to the source, it should produce a line with EW 50 eV, consistent with that detected in Chandra spectrum.
5 The Spectral Energy Distribution
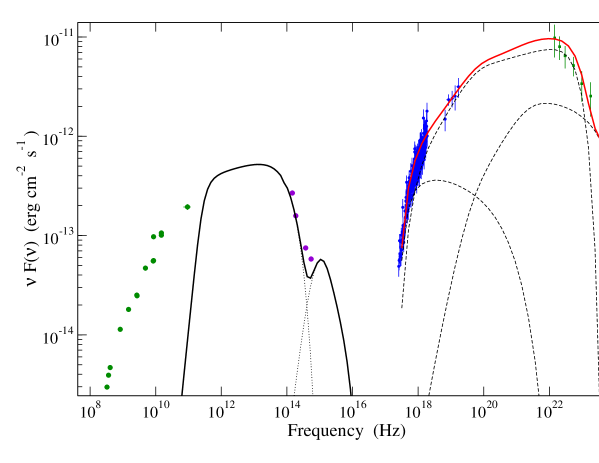
We then used our spectral results and other data available in the literature to derive the SED of PKS 1830211 shown in Figure 6. Of course, it is not based on simultaneous observations and therefore must be considered an indicative picture of the emission properties of this source. -ray data are from the EGRET public archive (ftp://cossc.gsfc.nasa.gov/compton/data/egret/) and indicate a quite steep spectrum with a photon index of 2.580.13. IR and optical points have been derived from the photometric data of the NE component given by Courbin et al. (2002), multiplied by 2 to take into account the obscured contribution from the SW component. These data have been corrected for an equivalent galactic absorption =6.0, slightly smaller than the value expected from the Chandra data best fit. The galactic contribution to , estimated from =0.46 (Schlegel et al. 1998), is 1.44 (), whereas the additional absorption from the lens galaxy is of the order of 4 mag (Winn et al. 2002). We recall that optical images show that the SW component is much higher absorbed with a differential reddening of (Courbin et al. 2002).
A further problem is the magnification factor of the flux due to the gravitational lens. Following the numerical calculations for the lens modelling by Nair et al. (1993) we assumed the magnification factor for the summed flux of both components to be equal to 10 (see also Mathur & Nair 1997). A lower factor, of course, would increase the intrinsic luminosity of PKS 1830211.
We then tried to apply some emission models to reproduce the SED according to the largely accepted scenarios used for high luminosity Blazars. First, we used a single zone homogeneous Synchrotron-Self Compton (SSC) model, but it failed to reproduce at the same time the radio-optical bump and the X and -ray bump. The SSC model contains a number of free parameters whose values were chosen on the basis of the current blazar physics: we assumed then the beaming factor =16 and a mean magnetic field =0.8 G, comparable to those considered for 3C 279 (Hartman et al. 2001). The very high beamed luminosity, 41048 erg s-1 after the correction for the lens magnification, requires a population of emitting electrons confined inside a volume of about cm3 and an electron density of 850 cm-3. The steady electron energy distribution is a broken power law with the break at the Lorentz factor 70, obtained equating the electron cooling time to the crossing time through the emitting volume. The two spectral indices are for and above the break. These values were chosen to match together X and -ray data are their difference is that expected from radiative cooling. The maximum Lorentz factor is 2500, suited to reproduce the decline of synchrotron spectrum at optical-UV.
The resulting SED is plotted in Figure 6. Note that the synchrotron self absorption frequency (defined by unitary optical depth) is around 31011 Hz in the observer’s frame and therefore there is no way to account for the emission in the GHz band. The same problem, found for other blazars like 3C 279 (Hartman et al. 2001) and PKS 1127145 (Blazejowski et al. 2004), can be solved assuming a multicomponent model in which the radio emission comes from an outer region where the magnetic field is lower. Notice, however, that this SSC model gives hard X and -ray luminosities lower than the observed values by more than an order of magnitude.
External Radiation Compton (ERC) models consider that the main sources of seed photons are the accretion disk around the massive black hole, the broad line region and, at larger distances, the dust torus. UV photons from the disk are seen deboosted by the relativistic electrons moving outward in the jet from behind and their contribution is small. When computing ERC considering only photons originating in an accretion disk with a luminosity of 4 erg s-1 and a multitemperature spectrum ( K, Shakura and Sunyaev 1973) we obtain a Compton bump much lower than the data. Moreover, photons scattered by the BLR give another relevant but not a sufficient contribution to IC bump. An increase of would move the peak frequency above 1023 Hz which is in conflict with the steep spectrum observed in the EGRET range.
More suitable are photons produced by matter at a distance of a few pc and illuminated by the disk, like the IR emission from a dusty torus at a temperature of 103 K as expected in similar sources (Sikora et al. 2002, see next section). Given the geometry of the jet-disk ambient, and the positioning of the emitting volume at a distance of 1019cm from the accretion disk, we find that the comoving energy density of the IR external photon field from the dust torus overwhelms the other soft field at least by an order of magnitude. The resulting IC bump is able to reproduce both the X and -ray continuum. We recall, however, that the latter data are not a strong constraint because of source variability, which in this range is at least a factor of 4, as indicated from the 3EG catalogue (Hartman et al. 1999).
6 Discussion
It is interesting to compare the properties of this distant and lensed blazar with those of other sources of the same class. The SED of Figure 6 shows that the largest energy output is in the prominent IC bump. A relevant finding of our analysis is that the X-ray spectrum of PKS 1830211 is remarkably flat up to energies of 80 keV, while the spectrum above 100 MeV is much steeper. The difference between these two spectral indices is around 1.5. The peak frequency, however, is not well constrained by the data: in the model described in the previous section it lies around 1022 Hz, however it could be lower, in the MeV range, for a different electron spectrum. PKS 1830211 can be considered a member of the small subclass of “MeV blazars” discovered by COMPTEL (Bloemen et al. 1995), which are characterised by flat hard X-ray and rather steep -ray spectra (Blom et al. 1996, Tavecchio et al. 2000). Sikora et al. (2002) proposed that the prominent IC bump seen in this type of blazars can be explained by ERC dominated by the interactions of relativistic electrons with the near-IR photons from a hot dusty torus. Our SED modelling of the previous section confirms this scenario also in the case of PKS 1830211 SSC emission is indeed found not enough efficient to reproduce the IC bump and the ERC emission on optical-UV photons from the BLR gives too much energetic rays.
A complete understanding of the emission properties of PKS 1830211, however, presents some difficulties arising from the presence of the gravitational lens. Radio, optical and X-ray data do not give a consistent picture on the absorption of the two lensed components. The large brightness difference observed by Courbin et al. (2002) in images was explained by a differential extinction 8.5. One can expect that X-ray images at energies lower than 2 keV would show a SW component much weaker than the NE, however this effect is not observed in our data (see Section 2). Spatially resolved high resolution radio spectroscopy of HCO and HCN transitions at the lens redshift (Swift et al. 2001) showed that there is no absorption in the NE image, while the SW one presents optically thick absorption with a complex structure. Molecular clouds on the radiation path of the SW component can be then responsible of the differential absorption, however the dust to gas density ratio should be lower than the mean galactic value to account for the much higher optical extinction.
The spectral behaviour of PKS 1830211 at low X-ray energies is characterized by strong absorption. In Figure 3 we show the spectrum, in the rest frame, of the combined Chandra observations as the ratio data to model assuming a power–law absorbed by Galactic gas. The ratio is not effected by instrumental response and Galactic absorption. We found that the spectrum below 5-6 keV (source frame) flattens indicating absorption in excess of the Galactic one, probably due to the lens galaxy at =0.89 and with a column density N1022 cm-2 . However a remarkably similar shape is shown in Figure 5 of Yuan et al. (2003) in the case of the XMM-Newton observations of RX J1028.60844 (=4.276), GB1428+4217 (=4.72) and PMN J05253343 (=4.4). The energy of the break is similar in all sources, with a power-law photon index . This evidence strongly encourage a common scenario in all these high redshift sources where absorption plays a role. The most plausible hypothesis (Fabian et al. 2001) includes the presence of a warm gas in the nuclear region (similar to that observed in Sy 1 galaxies). This warm gas is intrinsic to the source and is characterized by a column density N1023 cm-2 . In the case of PKS 1830211 this model seems to be supported by a marginal evidence of an emission line at the observed energy 2.15 keV , that can be interpreted as a blueshifted iron line ().
Further Chandra and XMM-Newton observations will help to understand the nature of the absorption in PKS 1830211 and in the other radio–loud quasars at high redshift.
Acknowledgements.
ADR would like to thank A. Bazzano and P. Ubertini for useful discussions. We acknowledge financial support by ASI (Italian Space Agency) via contract I/R/041/02. Part of this work was performed with the financial support Universitá La Sapienza di Roma.References
- Bassani (2004) Bassani L., Malizia A., Stephen J.B. et al. 2004, Proc. “V INTEGRAL Workshop”, Munich February 2004, ESA SP-552, astro-ph/040442
- Bird et al. (2004) Bird A.J., Barlow E.J., Bassani L. et al. 2004, ApJ, 607, L33
- Blazejowski (2004) Blazejowski M., Siemiginowska A., Sikora M., Moderski R., Bechtold J. 2004, ApJ 600, L27
- Bloemen (1995) Bloemen H., Bennet K., Blom J.J. et al. 1995, A&A 293, L1
- Blom (1996) Blom J.J., Bennet K., Bloemen H. et al. 1996, A&AS 120, 507
- Celfabi (1993) Celotti A.& Fabian A.C., 1993, MNRAS 264, 128
- Courbin (2002) Courbin F., Meylan G., Kneib J.P., Lidman C. 2002, ApJ 575, 95
- Fabian (2001) Fabian A.C., Celotti A., Iwasawa K. et al. 2001, MNRAS 323, 373
- Fiore (1998) Fiore F., Elvis M. , Giommi P., Padovani P. 1998, ApJ 492, 79
- Goldwurm (2003) Goldwurm A., David P., Foschini L. et al. 2003, A&A 411, L.223
- Hartman (1999) Hartman R. C., Bertsch D.L., Bloom S. D. et al. 1999, ApJS 123, 79
- Hartman (2001) Hartman R. C., Böttcher M., Aldering G. et al. 2001, ApJ 553, 683
- Lidman (1999) Lidman C., Courbin F., Meylan G. et al. 1999, ApJ 514, L57
- Lovell (1998) Lovell J.E., Jauncey D., Reynolds J.E. et al. 1998, ApJ 508, L51
- Mathur & Nair (1997) Mathur S. & Nair S., 1997, ApJ 484, 140
- Mattox (1997) Mattox J.R., Schachter J., Molnar L., Hartman R.C., Patnaik A.R. 1997, ApJ 481, 95
- Nair (1993) Nair S., Narashima D., Pramesh Rao A., 1993, ApJ 407, 46
- Oshima et al. (2001) Oshima T., Mitsuda K., Ota, N. et al. 2001, ApJ 551, 929
- PRaosub (1988) Pramesh Rao A. & Subrahmanyan R. 1988, MNRAS 231, 229
- Revnivtsev et al. (2004) Revnivtsev M.G., Sunyaev R.A., Varshalovich D.A. et al. 2004, Astro. Lett., 30, 382
- Reeves (2000) Reeves J.N., Turner M.J.L., 2000, MNRAS 316, 234
- Shakura (1973) Shakura N.I., Sunyaev R.A., 1973, A&A 24, 337
- Schlegel (1998) Schlegel D.J., Finkbeiner D.P., Davis M., 1998, ApJ 500, 525
- Sikora (1997) Sikora M., Madjeski G., Moderski R., Poutanen J. 1997, ApJ 484, 108
- Sikora (2002) Sikora M., Blazejowski M., 2002, ApJ 577, 78
- Stark et al. (1992) Stark A.A., Gammie C.F., Wilson R.W. et al. 1992, ApJS, 79, 77
- Swift (2001) Swift J.J., Welch W.J., Frye B.L., 2001, ApJ 548, L29
- Terrier (2003) Terrier R., Lebrun F., Bazzano, A. 2003, A&A, 411, L167
- Tavecchio (2000) Tavecchio F., Maraschi L., Ghisellini G. et al. 2000, ApJ 543, 535
- Wikcom (1996) Wiklind T., Combes F., 1996, Nature 379, 139
- Winn (2002) Winn J.M., Kochanek C.S., McLeod B.A. et al. 2002, ApJ 575, 103
- Worsley (2004) Worsley M.A., Fabian A.C., Turner A.K., Celotti A., Iwasawa K. 2004, MNRAS 350, 207
- Yuan (2003) Yuan W., Fabian A.C., Celotti, A., Jonker, P.G. 2003, MNRAS 346, L7