22institutetext: Istituto Nazionale di Astrofisica – Osservatorio Astronomico di Trieste, Via G.B.Tiepolo 11, I-34131 Trieste, Italy
C,N,O in Boo stars and in composite spectra
The selective abundance of C, N, O (almost solar) with respect to that of other elements (underabundant) in Boo stars has been interpreted as a characteristic peculiarity of these objects, when considered as single stars. We show here that a similar selective abundance is predicted from the composite spectra resulting from two unresolved stars in the same temperature range as the Boo stars.
Key Words.:
08.01.3 Stars: atmospheres - 08.03.2 Stars: Chemically Peculiar - 08.02.4: Stars: binaries: spectroscopic1 Introduction
Weak metal lines were discovered by Morgan et al. (1943) in the Boo spectrum; this star became the prototype of a new class of Ap stars when similar characteristics were detected in other A-type stars with small space velocity.
The almost solar abundance of oxygen in the Boo stars has been known for more than 40 years (Baschek & Searle, 1969); however the solar C,N,O, and S abundances did not enter in the definition of this class until quite recently. The approximately solar abundances of C, N, O, and S are discussed by Venn & Lambert (1990) for 3 Boo stars. The interpretation, proposed by these authors of the dichotomy between the solar abundances of C, N, O, and S and those of the other elements (selective accretion of gas, but not dust from circumstellar or interstellar medium) is still the most widely accepted for these stars when considered as single peculiar objects.
On the basis of this paper by Venn & Lambert, Paunzen et al. (1997) introduced the definition of Boo class as ” Pop I hydrogen burning A-type stars, which are, except of (sic) C, N, O and S, metal poor”. However several stars classified Boo in this paper do not belong to the A spectral type; for example, the following stars have lower than 7000 K: HD 81290, HD 83041, HD 84948, HD 106223, HD 142994. One cause of concern in this definition is that the optical lines used to derive the abundances of C, N, O are of high excitation and show a non-monotonic behaviour with .
In 1999 Faraggiana & Bonifacio suggested that the Boo phenomenon could be produced by the combination of an unresolved binary composed of two stars with not very different L and . In the subsequent series of papers we demonstrated that this is indeed the case for a significant percentage of stars classified as Boo . In this paper we investigate theoretically the properties of composite spectra for the optical lines of C,N, O.
2 CNO line intensity variation with
We restrict the analysis to C, N, O since the abundance of S is very uncertain in Boo stars; Venn & Lambert (1990) did not measure any SI line in Boo , and the scatter of the S abundance is 0.5 dex between the 4 measured lines in 29 Cyg and 0.7 dex between the 2 lines measured in Ori.
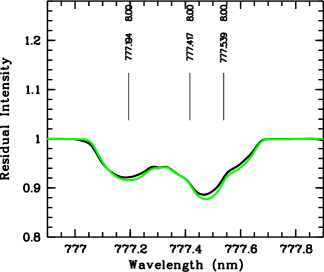
Synthetic spectra were computed for solar abundances of all elements by using Kurucz (1993) model atmospheres and SYNTHE code; the atomic line data are taken from the modified Kurucz line lists available at the CDS and http://wwwuser.oat.ts.astro.it/castelli/stars.html (see also Castelli & Kurucz 2004). All the spectra have been computed by adopting =50 , which is a lower limit for the Boo stars (see Table 4 in Gerbaldi et al. 2003). The selected spectral regions are those that include the C, N, O lines selected by Venn & Lambert (1990), and the computations were performed over a wavelength range broad enough to also include nearby lines of other ”underabundant” elements. We added the OI 777.4 nm triplet region because this feature is often used for oxygen abundance determination.
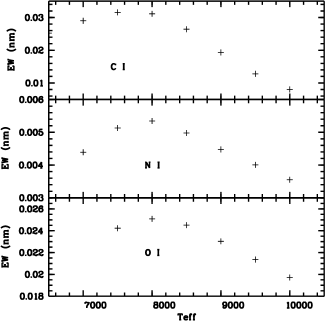
The variations of EWs with spectral type or were studied by Faraggiana et al. (1988) for oxygen and by Takeda & Takada-Hidai (1995) for nitrogen. In the first study the behaviour of the OI 777.4 nm triplet was studied and the result of the measured EWs vs. spectral type plotted in Figs. 2 and 3 of that paper. The maximum intensity of this pattern is reached for late A-type stars of the main sequence. The high sensitivity to the log g parameter does not alter the bell-shaped behaviour, which is enhanced at lower gravities when the NLTE effect is included (Baschek et al. 1977). In the second paper the NI 870.3 and 862.9 nm are analyzed in A-F supergiants. The theoretical EWs vs. are plotted in their Fig. 3; the bell-shaped variation, similar to that of OI triplet is evident. For both elements the line intensity reaches the maximum at of about 8000 K and decreases for higher and lower temperatures. A similar study was not made for CI broad blends, as the carbon abundance was always derived by synthetic spectra analysis.
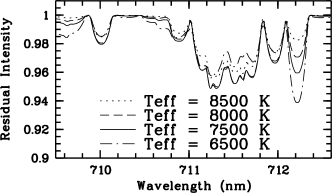
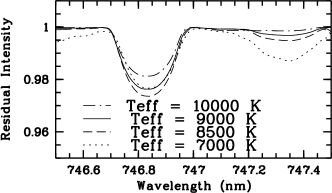
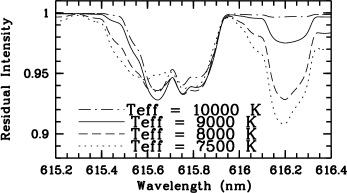
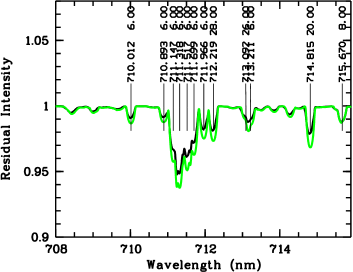
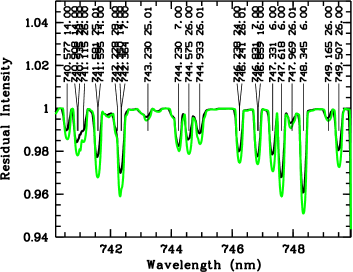
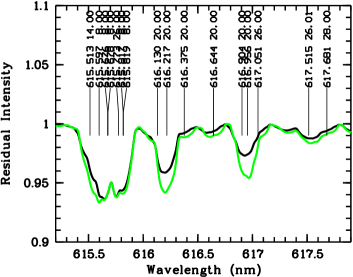
In order to show the behaviour of C, N, O, we computed synthetic spectra in the range of between 7000 and 9000 K with 500 K steps and the results are plotted in Figs. 1 to 4. The small variations of C, N, O lines compared to those of other elements are evident in Figs. 1 to 3.
This result is the consequence of the fact that the excitation potentials of the lower level of the neutral C, N, O lines are rather high (about three times higher than those of other lines). Therefore, in going from = 8000 K to 7500 K, the number densities of the neutral species increases because of the shift in the ionization balance, at the same time the population of the highly excited levels decreases; the two effects partially cancel out so that the line strength is roughly the same.
3 CNO in composite spectra
CNO line intensities are almost constant in the range 7000-9000 K, where most of the Boo stars lie, and are equal for two that are symmetric with respect to the maximum. If the composite spectrum is interpreted as due to a single object, the derived parameters are a weighted average of those of the components, and most of the metal lines appear too weak exception for C, N, O lines, as observed in Boo stars. In order to better illustrate this fact the following simulation was made.
4 Colours of a binary star
Given two stars of known and log g, let us suppose we know the Strömgren colours of the two stars denoted as and : and . Furthermore suppose we know the flux ratios of the two stars in the four Strömgren bands: ; ; ; . Let us then compute the Strömgren colours of a binary system made up of stars and . The quantities referring to the binary system will have no subscripts, while the ones referring to the single stars will have subscripts and , respectively.
By definition , where subscript refers to the zero colour standard star (typically Vega). Now ; hence,
The definition of m1 is a bit more complex:
It can be shown that
Finally, since , it can be shown that
We shall now work out an example which applies the above formulae. From the isochrone of Girardi et al. (2002) with Z = 0.01900, age = 10 Myr, we may read that a star of mass 1.5 M☉ has = 7185 K, log g = 4.29, and a star of mass 1.95 M☉ has = 8997 K, log g = 4.31. To compute the colours of a binary system made by the above two stars, we refer to the 1.5M☉ star as and to the 1.95M☉ star as . At our request L. Girardi computed the Strömgren magnitudes for this isochrone, which allowed us to compute the ratios ()
The Strömgren colours of star may be taken from the grid by Castelli & Kurucz (2004) with solar metallicity and microturbulent velocity of 2 . Just reading off this table for the model with = 9000 K, log g = 4.5, one finds , , and . For the binary system made of stars A and B we obtain . The well-known code TEFFLOGG of Moon & Dworetsky (1985) also requires knowledge of the magnitude to determine the atmospheric parameters of the star; however since for many stars the measure of is not available, the common practice is to estimate using the code UVBYBETA of Moon (1985), which also estimates the reddening. Using the above values we obtain a very small reddening (E) and ; and by feeding this estimate and dereddened colours to the code TEFFLOGG, we obtain = 8330 K, log g = 4.21.
In the V band the luminosity ratio is LA/LB=0.307, which implies LA/Ltot=0.235 and LB/Ltot=0.765.
. .
5 Simulated composite spectrum
In order to clarify the behaviour of the lines of these elements in single and composite spectra in the domain covered by Boo candidates we made some computed spectra simulations. We compare the line intensity of C, N, O lines to those of other elements in a single spectrum and also in a composite spectrum, that, according to our binary hypothesis, may roughly represent that of a Boo star. The chosen and log g of the single spectrum are those derived in the previous section, namely 8330 K and 4.21, while those used to produce the composite one are =8997 K, log g =4.31 and =7185 K, log g =4.29.
The combined spectrum that simulates a predicted composite spectrum of a binary system was computed by combining the two theoretical spectra, imposing the luminosity ratios LA/Ltot=0.235 and LB/Ltot=0.765 and a relative shift of 20 between the two components.
The results shown in Figs. 5 to 8, clearly show that lines of elements different from C, N, O are stronger in the spectrum computed with the parameters derived from the average colour indices than in the spectrum obtained by combining the fluxes of the two single sources.
In contrast, the CNO lines have practically the same intensity in both spectra.
6 Conclusion
We can conclude that an unresolved binary, if erroneously interpreted as a single object, produces average colours intermediate between those of the binary components, while the corresponding computed spectrum shows the same kind of abundance peculiarities as a Boo spectrum. In particular, the apparently solar abundances of C, N, O in Boo stars cannot be considered a selective criterion to distinguish single peculiar stars belonging to the Boo class. We have thus shown that the effect of a combined spectrum is not necessarily to uniformly weaken the lines of all elements by the same amount. This implies that the deduced abundance pattern of a star with a composite spectrum, when interpreted as a single object, will be altered when compared to the real one.
The interpretation of the C, N, O abundances higher than that of Fe-peak elements remains ambiguous: it can be explained either as the effect of the ” Boo phenomenon” in a single star or as due to a binary system that shows a composite spectrum but has been analysed as single object.
Therefore the argument that a C,N, O pattern different from that of other elements is sufficient to classify a star as Boo and to exclude that it is a binary with a composite spectrum appears unjustified. This argument cannot be used to reject our interpretation (see Acke & Waelkens, 2004) that many Boo stars are unresolved binaries with composite spectra.
Acknowledgements.
We are grateful to L. Girardi for providing Strömgren magnitudes for one of his isochrones. We are also grateful to the language editor J. Adams, who greatly improved our presentation.References
- Acke & Waelkens (2004) Acke, B. & Waelkens, C. 2004, , A&A, 427, 1009
- Baschek & Searle (1969) Baschek, B., & Searle, L. 1969, ApJ, 155, 537
- Baschek et al. (1977) Baschek, B., Scholz, M., & Sedlmayr, E. 1977, A&A, 55, 375
- Castelli & Kurucz (2004) Castelli, F. & Kurucz, R. L. 2004, ArXiv Astrophysics e-prints, astro-ph/0405087
- (5) Faraggiana, R., Gerbaldi M., van’ t Veer C & Floquet, M. 1988, A&A, 201, 259
- (6) Faraggiana, R. & Bonifacio, P. 1999, A&A, 349, 521
- (7) Gerbaldi, M., Faraggiana, R. & Lai, O. 2003, A&A, 412, 447
- Girardi et al. (2002) Girardi, L. et al. 2002, A&A, 391, 195
- Kurucz (1993) Kurucz, R. L. 1993, CD-ROM 13, 18 http://kurucz.harvard.edu
- (10) Moon, T.T. 1985, Comm. from the Univ. of London Obs. 78
- (11) Moon, T.T. & Dworetsky, M.M. 1985, MNRAS 217, 305
- (12) Morgan, W.W., Keenan, P.H. & Kellman, E. 1943, An atlas of stellar spectra, with an outline of spectral classification, The University of Chicago press
- (13) Paunzen, E., Weiss, W.W., Heiter, U. & North, P. 1997, A&AS, 123, 93
- (14) Takeda Y. & Takada-Hidai M. 1995, PASJ, 47, 169
- (15) Venn, K. A. & Lambert, D.L. 1990, ApJ, 363, 234