572 \SetRunningHeadM. Murashima et al.X-Ray Spectra of Ton S180 \Received2003/06/24\Accepted2004/12/29
and
accretion, accretion disks – galaxies: Seyfert – X-rays: individual (Ton S180)
X-Ray Spectra of the Narrow-Line Seyfert 1 Galaxy
Ton S180 in Comparison with Galactic Black Holes
Abstract
An analysis was made of 0.3–15 keV X-ray spectra of a Narrow-Line Seyfert 1 Galaxy, Ton S180, using archival data from ASCA, RXTE, and XMM-Newton. At energies above 2.5 keV, a power-law with a photon index of successfully and consistently reproduced the spectra from all of these observatories. Assuming this power-law component to extend toward lower energies, a soft excess, which is one of the most remarkable features of Narrow-Line Seyfert 1 Galaxies, is explained by another power-law multiplied by a thermal cutoff at keV. Some similarities have been observed between this object and Galactic black hole binaries in very high state, the latter being realized under high accretion rates. Attempts have been made to interpret the soft excess in terms of Comptonization of the disk photons by an electron cloud surrounding the accretion disk, like BHBs in a very high state.
1 Introduction
Narrow-Line Seyfert 1 galaxies (hereafter NLS1s) are identified by the unusual narrownesses of their broad components of the H line; the full width at half maximum is less than km s-1 (Osterbrock, Pogge 1985; Véron-Cetty et al. 2001). A general consensus is that NLS1s have relatively smaller black hole masses than other more typical Seyfert 1 galaxies (e.g. Wang, Lu 2001; Hayashida 2000; Kawaguchi 2003), together with high accretion rates, even near the Eddington limit (e.g. Pounds et al. 1995).
In the X-ray band, NLS1s show two remarkable features. One is the X-ray spectrum, characterized by a steep power-law with a photon index of 2 to 2.5 and a prominent soft excess below 2 keV (e.g. Leighly 1999b). The soft excess is generally modeled empirically by a blackbody with a temperature of 0.1 – 0.2 keV. The other is a large-amplitude variability on various time scales, from several thousand seconds to more than several years (e.g. Leighly 1999a). Although many attempts have been made to characterize this variability by utilizing a cross-correlation function or other methods, no clear correlations have been observed so far between the soft and hard spectral components.
Of these X-ray properties of NLS1s, a particularly puzzling issue is the nature of the soft X-ray component. Although we are tempted to interpret it as being optically-thick thermal emission from accretion disks, the observed temperature (0.1 – 0.2 keV) is significantly higher than the prediction from the standard accretion disk model (Shakura, Sunyaev 1973) for the suggested black-hole mass of . Furthermore, the strong variability exhibited by the soft component is obviously distinct from the relative calmness of the optically thick disk emission components from Galactic black hole binaries (hereafter BHBs).
With regard to the high accretion rates of NLS1s, which appear to be one of their common physical properties, we have revealed that BHBs under high accretion rates exhibit two characteristic states (Kubota et al. 2001; Kobayashi et al. 2003; Kubota, Makishima 2004). In one state, which is called a very high state, the accretion-disk emission exhibits a significant hard tail extending into higher energies, presumably due to Comptonization of the original disk photons, while in the other state the accretion disk deviates from the standard model and becomes what is called a slim disk (Abramowicz et al. 1988; Mineshige et al. 2000; Watarai et al. 2001). When we fit the spectrum of a BHB in either of these states with the standard disk model, the disk temperature is significantly higher than a prediction of the standard model. These two non-standard states may also explain (Watarai et al. 2001; Kubota et al. 2002) the X-ray spectral properties of ultra-luminous X-ray sources (ULXs ; Makishima et al. 2000), which are thought to involve intermediate-mass black holes. We may therefore attempt to identify the soft excess of NLS1s either with strongly Comptonized disk emission, or with the slim disk emission (Mineshige et al. 2000; Haba 2004).
Vaughan et al. (2002), based on XMM-Newton observations of the prototypical NLS1 Tonantzintla (Ton) S180, located at a redshift of , suggested that the soft component prefers power-law to blackbody modeling, and hence can be interpreted as arising via inverse Compton scattering. This suggests that NLS1s are generally in a state analogous to the very high state of BHBs, and Ton S180 is one of the best candidates to examine this possibility. In order to confirm this analogy between NLS1s and BHBs, we here focus on this particular NLS1.
There have been a number of X-ray observations of Ton S180. A long observation of Ton S180 was performed with ASCA in 1999 during a simultaneous campaign with repeated pointings with the Rossi X-ray Timing Explorer (RXTE). To the ASCA dataset acquired on this occasion, Romano et al. (2001), Turner et al. (2001), and Edelson et al. (2001) applied a series of standard analysis, while focusing on the spectral energy distributions, or variability. In addition, this source had previously been observed in the X-ray band by ROSAT (Fink et al. 1997), BeppoSAX (Comastri et al. 1998), and once by ASCA (Turner et al. 1998). An observation with high-energy resolution was also performed with the Chandra LETG (Turner et al. 2001). The most recent observations were performed with XMM-Newton in 2000 December as mentioned above (Vaughan et al. 2002) and in 2002 June. All of these observations found typical features of NLS1s: a steep power-law () and a featureless soft excess below 2 keV in the spectrum, as well as rapid variability.
In the present work, we utilized three archival datasets out of these observations. One was the ASCA data in 1999, which still provide one of the highest-quality spectra of Ton S180 at energies of 3 – 10 keV because of the very long exposure and the low background. We then utilized the RXTE data, which were simultaneous with ASCA exposure. After quantifying the hard-band spectral property using these ASCA and RXTE data, we proceeded to an analysis of the X-ray spectra obtained by the first XMM-Newton observation, in order to extract the soft excess.
We employed a Hubble constant of km s-1 Mpc-1 and a deceleration parameter of in the present analysis.
2 Observation
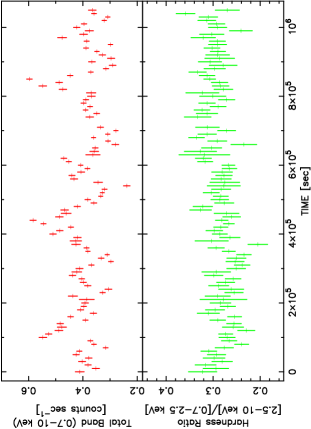
A long continuous observation of Ton S180 was performed over 12 days with ASCA on 1999 December 3 – 15, as a part of a multi-satellite, broad-band campaign (Turner et al. 2002). After screening the data with the standard criteria, we obtained a net exposure of 410 ks with the Gas Imaging Spectrometer (GIS : Ohashi et al. 1996; Makishima et al. 1996) and 356 ks with the Solid-State Imaging Spectrometer (SIS : Burke et al. 1994). Because of the long-term degradation of the SIS, we utilized mainly the GIS data in the present work, and utilized the SIS data only to analyze spectra at energies above 2.5 keV. In figure 1, we show the 0.7 – 10 keV light curve of Ton S180 obtained with GIS 2 and GIS 3, using a signal integration region of radius. The typical count rate from the target is 0.4 c s-1, while that of background derived from off-source regions is 0.01 c s-1 when normalized to the same detector area; we subtracted the background in advance.
The simultaneous RXTE observation was carried out from 1999 November 11 to December 16. During this period, RXTE regularly observed the target once per orbit, for 1 – 2 ks each. We utilized data obtained with the Proportional Counter Array (PCA) from December 3 to 15, covering the same period as the ASCA observation. These datasets were acquired during 157 pointings, achieving a total exposure of 262 ks. The PCA covers an energy band of 2 to 60 keV (Jahoda et al. 1996) with five proportional counter units (PCUs). Specifically, we utilized the standard-2 format data from PCU 0 and PCU 2, because only these two out of the five PCUs were active during these observations. Since we are interested in the average spectrum, we accumulated all of these pointing data from the top layer of the two PCUs into a single 3 – 15 keV spectrum, from which we subtracted the background spectrum estimated using the latest mission-long faint model. According to the data-analysis procedure recommended by the RXTE Guest Observer Facility, the standard screening criteria were applied, to achieve a net exposure of 48 ks.
The first observation of Ton S180 with XMM-Newton was performed in December 2000. The obtained EPIC MOS 2 and PN data have a net exposure of 29 ks and 21 ks, respectively. The second observation was performed in June 2002, and the EPIC MOS2 and PN data were acquired for net exposures of 18 ks and 13 ks, respectively. All instruments were operated in a small-window mode with a medium filter for both observations. In order to avoid calibration uncertainties and degradation, which are especially prominent in a lower energy band, such as a gain problem of the PN small window mode around O-edge, we utilized the data of only the first observation. We extracted the MOS 2 and PN spectra of Ton S180 using a signal integration region of radius, and subtracted the background spectra obtained in an off-source region.
| Instrument | Energy range [keV] ∗*∗*footnotemark: | ||
| GIS 2+3 | 2.5 – 9 | 165/225 | |
| SIS 0 | 2.5 – 9 | 132/141 | |
| SIS 1 | 2.5 – 9 | 127/119 | |
| GIS 23 + SIS 0 + SIS 1 ††\dagger††\daggerfootnotemark: | 427/486 | ||
| PCA | 3 – 15 | 36/24 | |
| GIS 23 + SIS 0 + SIS 1 + PCA ††\dagger††\daggerfootnotemark: | 453/507 | ||
| EPIC MOS 2 | 2.5 – 10 | 90/106 | |
| EPIC PN | 2.5 – 10 | 218/224 | |
| ∗*∗*footnotemark: Excluding 6 – 7 keV. ††\dagger††\daggerfootnotemark: A Combined fit to the spectra. | |||
3 Data Analysis and Results
3.1 Variability
As can be seen in the GIS light curve (top panel of figure 1), the 0.7 – 10 keV signal intensity varied by a factor of during the ASCA observation. The variation has a preferred time scale of s, although a detailed timing analysis is beyond the scope of the present paper. It is possibly the same phenomenon as the 2.08-day ( s) QPO that Halpern et al. (2003) found in a long (33 days) EUVE observation, which partially overlaps with the present ASCA exposure.
In the bottom panel of figure 1, we also show the variation of the hardness ratio, which is defined as the ratio of counts in 2.5 – 10 keV to those in 0.7 – 2.5 keV. The hardness ratio is not completely constant during the observation, implying some spectral variation. However, the associated spectral change is rather small, as briefly described in subsection 3.3. We therefore analyzed mainly the time-averaged spectra.
| Model | [keV] | |||
| Blackbody + PL | 330/393 | |||
| MCD + PL | 328/393 | |||
| 2PL | 320/393 | |||
| ∗*∗*footnotemark: The absorption is fixed at the Galactic line-of-sight value of . | ||||
3.2 Time-Averaged Spectra
3.2.1 ASCA and RXTE spectra
In order to extract the soft excess spectrum, we first need to determine the spectral hard component as accurately as possible. We utilized the data obtained with GIS 2 and GIS 3 on-board ASCA, because of its long exposure and high sensitivity at higher energies. We fitted the time-averaged and background-subtracted GIS 2 GIS 3 spectrum with a single power-law model at energies above 2.5 keV, but excluding 6 – 7 keV where Fe-K lines are suggested. As summarized in table 1, we obtained an acceptable fit with a photon index of the hard component as . We also analyzed the SIS data from the same ASCA observation. By fitting the background-subtracted SIS 0 and SIS 1 spectra separately with a single power-law model in the energy range above 2.5 keV, and further simultaneously fitting the GIS and SIS spectra, we obtained the results summarized in Table 1. Thus, the keV ASCA spectra were successfully and consistently fitted by a steep single power-law with .
In order to determine the hard component at higher energies, we utilized the spectrum obtained with the PCA on-board RXTE. A single power-law fit to the 3 – 15 keV PCA spectrum was successful, yielding a photon index of , which is consistent with the results of ASCA. Furthermore, by allowing relative normalizations to take free values, we achieved a successful () simultaneous power-law fit to the spectra of ASCA and RXTE. The obtained photon index, , agrees with those from the individual instruments. We include these results in table 1.
In figure 1, the GIS spectrum shows an excess below 2 keV, where the power-law model determined in 2.5 keV is extrapolated toward lower energies employing the Galactic absorption column density of . We thus reconfirmed the soft excess that has been repeatedly observed from this source. Assuming again Galactic line-of sight absorption, this soft excess is reproduced equally well by either a blackbody with a temperature of 0.13 keV, or a multi color disk model (MCD : [Mitsuda et al.(1984)]) with a temperature of 0.16 keV, or a very steep power-law with a photon index of 5.22. These results are summarized in table ‣ 2.
The hard power-law has a keV luminosity of , while the absorption-corrected soft component has a keV luminosity of if represented, e.g., by the MCD model.
3.2.2 XMM-Newton spectra
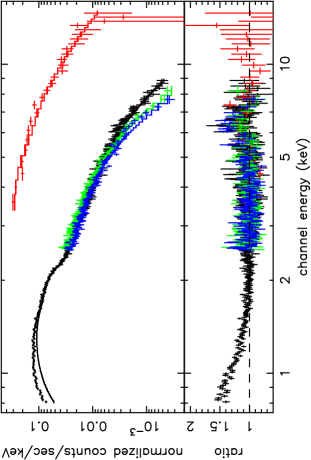
In order to better quantify the soft excess, we utilized the XMM-Newton data, which extend down to an energy of 0.3 keV. We first limited the energy range of analysis to 0.8 – 10 keV in order to examine the consistency with the ASCA results. We determined the hard component in the same way as the ASCA analysis, fitting the spectra of the EPIC MOS 2 and PN separately at energies above 2.5 keV with a single power-law. The obtained photon indices are again summarized in table 1. Thus, the spectrum of Ton S180 at energies above 2.5 keV (up to 10 or 15 keV) is consistently described with a single power-law of 2.3 – 2.4, by five instruments: the GIS and SIS on-board ASCA, the RXTE PCA, and the two types of EPIC cameras on-board XMM-Newton.
We fixed the obtained hard-component model, and added a second steeper power-law to represent the soft excess. This two-power-law model gave acceptable fits () to the MOS 2 and PN spectra in the limited 0.8 – 10 keV range, with the photon indices for the second power-law of 4.3 and 4.8, respectively. However, as shown in figure 4, the data fall significantly below the model when we extrapolate the two-power-law model to lower energies down to 0.3 keV. The fit remained unacceptable even if we allow the absorption to vary freely.
| Instrument | [keV] | |||
| MOS 2 | 274/260 | |||
| PN | 686/675 | |||
| MOS 2 + PN ††\dagger††\daggerfootnotemark: | 974/934 | |||
| ∗*∗*footnotemark: The absorption is fixed at the Galactic line-of-sight value of . ††\dagger††\daggerfootnotemark: A Combined fit to the spectra. | ||||
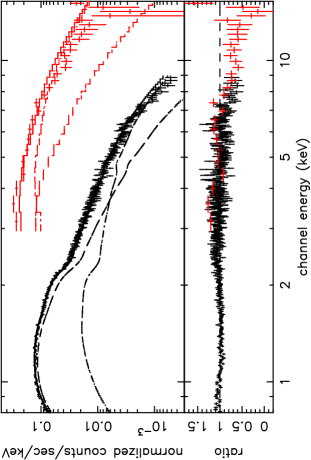
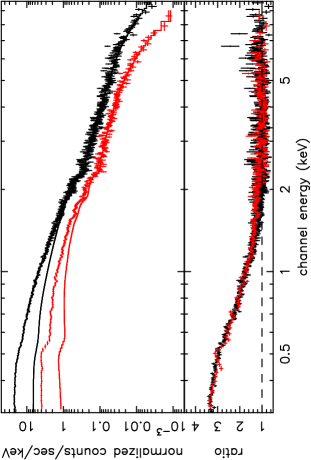
We then allowed the two power-law components to vary freely, to find that the EPIC spectra could be explained reasonably well (with ) by the sum of two power-laws, with photon indices of 3.1 and 1.3, both absorbed by the Galactic column. This is consistent with Vaughan et al. (2002), who reported that the overall ( keV) XMM-Newton spectra are reproduced by a very flat hard tail with a photon index of 1.5, together with a steep () power-law, which accounts for the softer part of the EPIC spectra. However, this result is inconsistent with that of ASCA and RXTE derived in sub subsection 3.2.1. Actually, as shown in figure 5, the two-power-law model with the indices fixed at 3.1 and 1.3 (but with their normalizations both left free) gives an inadequate fit to the ASCA GIS data, which have higher statistics than the XMM-Newton data at higher energies. As we extrapolate the same model to a higher band up to 15 keV to include the RXTE spectrum, the model further deviates from the observation (with ). Thus, the two-power-law model determined with the XMM-Newton spectra fails to explain those of ASCA and RXTE toward higher energies.
3.2.3 Unified spectral modeling
The ASCA and RXTE spectra covering 0.8 – 15 keV were simultaneously reproduced by a two-power-law model with photon indices of 5.22 and 2.28. The 0.3 – 10 keV XMM-Newton spectra were also explained by another two-power-law model with smaller photon indices of 3.1 and 1.3. These two models are hardly distinguished in the energy band of 0.8 – 9 keV. Therefore, the spectra of ASCA and XMM-Newton are basically similar in energies where their sensitivities significantly overlap, in spite of the difference in the epoch of observation. Nevertheless, the model of ASCA and RXTE cannot reproduce the XMM-Newton spectra at lower energies below 0.8 keV, and that of XMM-Newton cannot explain the ASCA and RXTE spectra at higher energies above keV. In short, both two-power-law models cannot explain the overall X-ray spectrum of Ton S180. We should thus adopt the hard component determined by the ASCA and RXTE data, and utilize the XMM-Newton data to better constrain the soft excess. A model that can explain a whole spectrum of this NLS1 will therefore consist of a power-law with an index of , and an appropriate component for the soft excess. As suggested by figure 3, the latter must have a mildly convex shape, with a steep slope from keV down to keV, but a gradual flattening to lower energies.
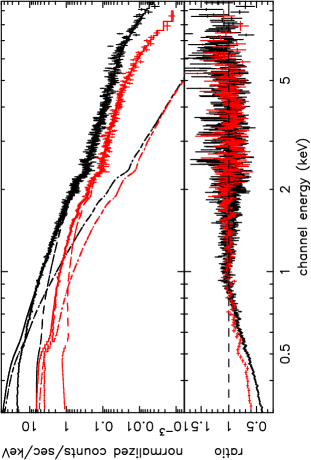
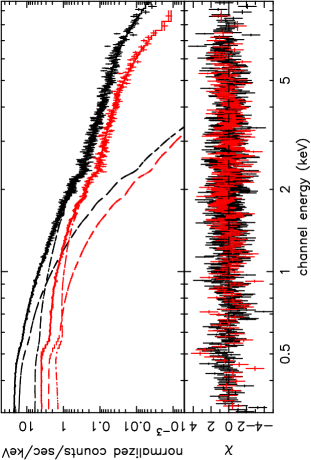
We adopted a power-law multiplied by a thermal (exponential) cutoff factor to reproduce the curvature of the soft excess. All of the parameters of this component and of the hard power-law were left free to vary, except for the absorption, which was again fixed to the Galactic value. As shown in figure 6 and table ‣ 3, this model gave acceptable fits to the MOS 2 and PN spectra, either separately or jointly, over the entire keV energy range. The obtained joint fit () is actually considerably better than the two-power-law fit () that we obtained in sub subsection 3.2.2. The slope of the hard component has remained close to what we determined in sub subsection 3.2.1 and 3.2.2, while ignoring the data below 2.5 keV. The index of the soft excess is similar to that of the hard component, and the cutoff energy is keV, in agreement with the visual impression from the spectral ratio in figure 3.
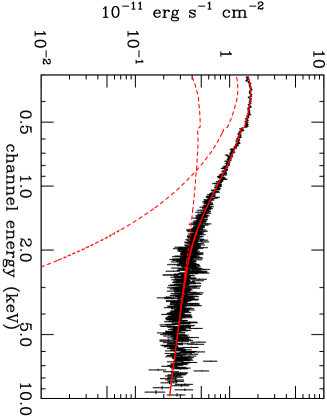
Thus, we have successfully reproduce the overall XMM-Newton spectra of Ton S180 by combining the power-law and another power-law with an exponential cutoff, representing the hard component and the soft excess, respectively. In figure 7, we show the unfolded PN spectrum and the best-fit model in the form of , where is the energy flux density. This model implies a hard-component luminosity of and a soft-excess luminosity of , in the energy ranges of keV and keV, respectively.
3.3 Spectral Variability
In order to briefly investigate the spectral variability, we divided the 12 days of long ASCA data into 12 subsets of ks each, and fitted with the individual spectra using the MCD and power-law model, which is one of the conventional models. The obtained disk temperatures are almost constant, 0.16 keV, within an error of 0.06 keV. The indices slightly change from to with relatively large errors of . The luminosity of the power-law varies together with the total luminosity by a factor of 1.4, and its ratio to the MCD luminosity changes between and . Due to large errors compared to the range of parameter changes, we found no significant correlations among the model parameters, such as a positive correlation between the disk luminosity and temperature that is reported in the case of BHB (Tanaka, Lewin 1995; Tanaka 1997; and references therein).
4 Discussion
The standard accretion model predicts a disk temperature of eV for a black hole with a mass of (Wang, Lu 2001), assuming a face-on geometry, a color hardening factor of (a ratio of a color temperature to an effective one; Shimura, Takahara 1995), and a luminosity close to the Eddington limit; the latter two assumptions yield the maximum disk temperature. This theoretical model also predicts a disk inner radius of km. With the ASCA spectra, we obtained the temperatures of the soft excess as 0.13 keV and 0.16 keV by fitting with the blackbody and the MCD, respectively, as listed in table ‣ 2. We also obtained a disk inner radius of km using the disk temperature and luminosity. As Vaughan et al. (2002) argued based on the XMM-Newton spectra, these conventional fits give a four-times higher temperature and a much smaller inner disk radius than is expected. Consequently, the soft excess cannot be interpreted as being optically thick thermal emission directly from a standard accretion disk.
Although an XMM-Newton observation was performed one year after that with the other two satellites, the source was found in very similar states on these two occasions; in fact, the luminosity agrees within 30%, and the spectral shape is very similar. Our analysis using the five instruments on-board the three satellites have consistently shown that the 2.5 – 15 keV spectra of Ton S180 are reproduced by a single power-law flux with . Assuming that this single power-law flux continues toward energies below 2.5 keV, we have found that the soft excess has a mildly convex shape. The slope of the soft excess toward lower energies is estimated to be , and its curvature toward higher energies is reproduced by an exponential factor of keV.
As described in section 1, a possible interpretation of the soft excess is the slim-disk scenario. In fact, this interpretation has been proposed both observationally (Haba 2004) and theoretically (Mineshige et al. 2000; Kawaguchi 2003; Różańska et al. 2004). In the present work, we employed the very high-state scenario as an alternative working hypothesis to explain NLS1s. As a result, we found several interesting similarities between Ton S180 and BHBs in this particular state. Firstly, the power-law shaped hard component with a relatively steep photon index of , which dominates the 0.3 – 15 keV spectrum of Ton S180, is very reminiscent of the characteristic spectral slope observed from BHBs in the very high state over a few to a few tens of keV range (Kubota, Makishima 2004). Secondly, the rapid variability characterizing NLS1s is also commonly observed from BHBs in the very high state (Miyamoto et al. 1993; McClintock, Remillard 2003), while not being confirmed so far from BHBs in the slim-disk state. Finally, the intensity variation of a BHB in a very high state often takes the form of quasi-periodic oscillations, with a frequency of 1 – 20 Hz (McClintock, Remillard 2003). If we scale this frequency by 6 orders of magnitude with the difference in the black-hole mass between BHBs and Ton S180, we expect to observe a similar behavior from Ton S180 with a frequency of Hz, or a period of s. The variation that we observe in figure 1 is indeed suggestive of such oscillations.
If our analogy between Ton S180 and very-high-state BHBs is correct, and the emission from the latter is indeed dominated by Comptonized disk photons, and the soft excess from Ton S180 is also inferred to be arising via Comptonization, as already suggested by Vaughan et al. (2002). The shape of the soft excess that we have determined, a power-law multiplied by an exponential factor, is in a qualitative agreement with a prediction by the theory of unsaturated Comptonization (Sunyaev, Titarchuk 1980). The seed photons may be supplied by an optically-thick accretion disk, which may be visible at optical – ultraviolet frequencies (Turner et al. 2002). The scattering electron cloud is suggested to have a temperature of keV; this is significantly higher than the disk temperature of 36 eV, which is predicted by the standard disk scenario, and suggested by the optical – ultraviolet data (Turner et al. 2002). However, this electron temperature is much lower than is usually invoked for BHBs, and hence requires rather large optical depths to produce sufficient Comptonization effects. Magdziarz et al. (1998) fitted the soft excess in NGC 5548, which is a typical Seyfert 1 galaxy, by Comptonization due to such a cool ( keV) and optically thick () plasma. The reality and physical details of electron scattering with such a low electron temperature and large optical depths are a subject of future study.
In summary, we have accurately quantified the keV spectrum of Ton S180 using the three satellites, and pointed out empirical similarities between this NLS1 and BHBs in very high states. This analogy suggests that the soft excess of Ton S180 arises via Comptonization of the disk photons, by an electron cloud surrounding the accretion disk.
References
- [Abramowicz et al.(1988)] Abramowicz, M. A., Czerny, B., Lasota, J. P., & Szuszkiewicz, E. 1988, ApJ, 332, 646
- [Burke et. al. (1994)] Burke, B. E., Mountain, R. W., Daniels, P. J., Cooper, M. J., & Dolat, V. S. 1994, IEEE Trans. Nucl. Sci., 41, 375
- [Comastri et al. (1988)] Comastri, A., et al. 1998, A&A, 333, 31
- [Edelson et al. (2002)] Edelson, R., Turner, T. J., Pounds, K., Vaughan, S., Markowitz, A., Marshall, H., Dobbie, P., & Warwick, R. 2002, ApJ, 568, 610
- [Fink et al. (1997)] Fink, H. H., Walter, R., Schartel, N., & Engels, D. 1997, A&A, 317, 25
- [Haba(2004)] Haba, Y. 2004, PhD Thesis, Nagoya University
- [Hayashida(2000)] Hayashida, K. 2000, New Astron. Rev., 44, 419
- [Hayashida(2000)] Halpern, J. P., Leighly, K. M., & Marshall, H. L. 2003, ApJ, 585, 665
- [Jahoda et al.(1996)] Jahoda, K., Swank, J. H., Giles, A. B., Stark, M. J., Strohmayer, T., Zhang, W., & Morgan, E. H. 1996, Proc. SPIE, 2808, 59
- [Kawaguchi(2003)] Kawaguchi, T. 2003, ApJ, 593, 69
- [Kobayashi et al. (2003)] Kobayashi, Y., Kubota, A., Nakazawa, K., Takahashi, T., & Makishima, K. 2003, PASJ, 55, 273
- [Kubota, Done and Makishima (2002)] Kubota, A., Done, C., & Makishima, K. 2002, MNRAS, 337L, 11
- [Kubota and Makishima (2004)] Kubota, A., & Makishima, K. 2004, ApJ, 601, 428
- [Kubota et al. (2001b)] Kubota, A., Makishima, K., & Ebisawa, K. 2001, ApJ, 560L, 147
- [Leighly(1999a)] Leighly, K. M. 1999a, ApJS, 125, 297
- [Leighly(1999b)] Leighly, K. M. 1999b, ApJS, 125, 317
- [Magdziarz et al.(1996)] Magdziarz, P., Blaes, O. M., Zdziarski, A. A., Johnson, W. N., & Smith, D. A. 1998, MNRAS, 301, 179
- [Makishima et al.(1996)] Makishima, K., et al. 1996, PASJ, 48, 171
- [Makishima et al.(2000)] Makishima, K., et al. 2000, ApJ, 535, 632
- [McClintock and Premillard (2003)] McClintock, J. E., & Remillard, R. A. 2003, astro-ph/0306213
- [Mineshige et al.(2000)] Mineshige, S., Kawaguchi, T., Takeuchi, M., & Hayashida, K. 2000, PASJ, 52, 499
- [Mitsuda et al.(1984)] Mitsuda, K., et al. 1984, PASJ, 36, 741
- [Miyamoto et al.(1993)] Miyamoto, S. and Iga, S. and Kitamoto, S., & Kamado, Y. 1993, ApJ, 403L, 39
- [Ohashi et al.(1996)] Ohashi, T., et al. 1996, PASJ, 48, 157
- [Osterbrock(1985)] Osterbrock, D. E., & Pogge, R. W. 1985, ApJ, 297, 166
- [Pounds(1995)] Pounds, K. A., Done, C., & Osborne, J. P. 1995, MNRAS, 277L, 5
- [Romano(2002)] Romano, P., Turner, T. J., Mathur, S., & George, I. M. 2002, ApJ, 564, 162
- [] Różańska, A., Czerny, B., Siemiginowska, A., Dumont, A. M., & Kawaguchi, T. 2004, ApJ, 600, 96
- [Shakura(1973)] Shakura, N. I., & Sunyaev, R. A. 1973, A&A, 24, 337
- [Shimura(1995)] Shimura, T., & Takahara, F. 1995, ApJ, 445, 780
- [Shakura(1973)] Sunyaev, R. A., & Titarchuk, L. G. 1980, A&A, 86, 121
- [Tanaka (1997)] Tanaka, Y. 1997, in Accretion Disks - New Aspects, ed E. Meyer-Hofmeister & H. Spruit, (Berlin, Springer-Verlag), 1
- [Tanaka et al. (1995)] Tanaka, Y., & Lewin, W. H. 1995, in X-Ray Binaries, ed. W. H. Lewin, J. van Paradijs, & E. van den Heuvel (Cambridge, Cambridge University Press), 126
- [Turner(2001)] Turner, T. J., et al. 2001, ApJ, 548L, 13
- [Turner(2002)] Turner, T. J., et al. 2002, ApJ, 568, 120
- [Turner(1998)] Turner, T. J., George, I. M., & Nandra, K. 1998, ApJ, 508, 648
- [Vaughan et al.(2002)] Vaughan, S., Boller, Th., Fabian, A. C., Ballantyne, D. R., Brandt, W. N., & Trümper, J. 2002, MNRAS, 337, 247
- [Véron-Cetty(2001)] Véron-Cetty, M. P., Véron, P., & Gonçalves, A. C. 2001, A&A, 372, 730
- [Wang and Lu (2001)] Wang, T., & Lu, Y. 2001, A&A, 377, 52
- [Watarai et al.(2001)] Watarai, K., Mizuno, T., & Mineshige, S. 2001, ApJ, 549L, 77