-PROCESS NUCLEOSYNTHESIS IN MHD JET EXPLOSIONS OF CORE-COLLAPSE SUPERNOVAE
Abstract
We investigate -process nucleosynthesis during the magnetohydrodynamical (MHD) explosion of supernova in a massive star of 13 . Contrary to the case of the spherical explosion, jet-like explosion due to the combined effects of the rotation and magnetic field lowers the electron fraction significantly inside the layers above the iron core. We find that the ejected material of low electron fraction responsible for the -process comes out from the silicon rich layer of the presupernova model. This leads to the production up to the third peak in the solar -process elements. We examine whether the fission affects the -process paths by using the full nuclear reaction network with both the spontaneous and -delayed fission included. Moreover, we pay particular attention how the mass formula affects the -process peaks with use of two mass formulae. It is found that both formulae can reproduce the global abundance pattern up to the third peak though detailed distributions are rather different. We point out that there are variations in the -process nucleosynthesis if the MHD effects play an important role in the supernova explosion.
1 INTRODUCTION
It has been considered that the origin of heavy neutron-rich elements like uranium is mainly due to the -process nucleosynthesis that occurs during the supernova explosions and/or neutron star mergers (Thielemann et al., 2001; Qian, 2003). The main issue concerning the -process research is to reproduce the three peaks ( 80, 130, and 195) in the abundance pattern for the -elements in the solar system. Among models of the -process, it has been believed that supernovae are the most plausible astrophysical site (Qian, 2005). The explosion is triggered by the gravitational collapse of massive stars of (e.g., Hashimoto, 1995). Since a proto-neutron star is formed after the explosion, neutron-rich elements seem to be easily ejected by the supernova shock. Unfortunately all realistic numerical simulations concerning the collapse-driven supernovae have failed to explode the outer layer outside the Fe-core (Janka et al., 2004). Therefore, plausible site/mechanism of the -process has not yet been clarified. On the other hand, explosive nucleosynthesis that produces most elements up to Fe-group nuclei has been calculated under the assumption that the explosion is triggered from outside the Fe-core whose location is defined as the mass cut (Hashimoto et al., 1989; Thielemann, Nomoto, Hashimoto, 1996); the calculated abundances from C to Ge are consistent with the supernova observations and the chemical evolution of galaxies (Tsujimoto et al., 1993; Timmes, Woosley, & Weaver, 1995). However, this situation can not be applied to the -process due to the large electron fraction and the low entropy distribution above the . A specific model of neutrino-wind with the very high entropy per baryon ( and ) has been suggested to reproduce up to the third peak in the abundance pattern of the -process (Freiburghaus et al., 1999). It should be noted that this model includes artificial parameters such as mass loss rates and initial conditions of hydrodynamical calculations (Sumiyoshi et al., 2000). On the other hand, detailed -process calculations that include the fission have not been fully performed. If the -process occurs along the paths of the neutron-drip line, the fission process should become important (Panov, Freiburghaus, & Thielemann, 2001).
The explosive nucleosynthesis under the jet-like explosion is investigated with use of the two-dimensional hydrodynamical code (Nagataki et al., 1997), where strong -rich freezeout region has emerged. Recently, two-dimensional magnetohydrodynamical (MHD) calculations have been performed under the various initial parameters concerning the rotation and magnetic field (Kotake et al., 2004; Yamada & Sawai, 2004; Kotake et al., 2004; Yamada, Kotake, & Yamasaki, 2004; Takiwaki et al., 2004). The ZEUS-2D code developed by Stone & Norman (1992) has been modified to include a tabulated equation of state (Shen et al., 1998), electron captures, and neutrino transport (Kotake et al., 2004). Various combinations have been investigated for the initial ratio of the rotational energy () and/or magnetic energy () to the gravitational energy (). In case of the cylindrical profiles of the rotation and magnetic field, it is found that the shape of the shock wave becomes prolate compared to the case without magnetic fields though detailed studies of neutrino transport must be developed. Furthermore, the confined magnetic fields behind the shock front push the shock wave strongly. The aspect ratio of the polar to the equatorial radius in the stalled shock front becomes 1.4 for the initial values of and . It is noted that whether the initial models of stellar evolution include magnetorotational effects (Heger et al., 2004) or not (Woosley & Weaver, 1995), no significant differences in the hydrodynamical features are found.
In the present paper, we will carry out the calculations of the MHD explosion of the He-core of 3.3 whose mass in the main sequence stage is about 13 star. Thereafter, we investigate the r-process nucleosynthesis using the results of MHD calculations. We find new -process site thanks to a large nuclear reaction network that includes fission; we obtain the region that produces the -process elements under the low .
In §2 the full nuclear reaction network necessary to the -process calculation is constructed. We describe initial models in §3 and give explosion models based on the MHD simulations. The results of the -process nucleosynthesis calculations are presented in §4. We summarize and discuss the results in §5.
2 NUCLEAR REACTION NETWORK
We have developed the nuclear reaction network that had been constructed for the rapid-proton capture process (Koike et al., 2004). The network is extended toward the neutron-rich side to the neutron-drip line. The full network consists of about 4000 nuclear species up to = 100. We include two body reactions, i.e., (n,), (p,), (,), (p,n), (,p), (,n), and their inverses. This network contains specific reactions such as three body reactions, heavy ion reactions and weak interactions. As shown in Table 1 we construct two kinds of the network A and B that consist of different nuclear data set. For nuclear masses, the experimental data (Audi & Wapstra, 1995) is used if available; otherwise, the theoretical data by mass formula FRDM (Mller, Nix, Myers, & Swiatecki, 1995) is adopted in the range , and/or ETFSI (Goriely, 2002) in .
Most reaction rates are taken from the compilation (REACLIB) of Rauscher & Thielemann (2000, 2001) that includes experimental and theoretical data for the reaction rates and partition functions with use of FRDM (NETWORK A) or ETFSI (NETWORK B). Reaction rates for that are not available in REACLIB are taken from Goriely (2002).
The rates on decay channels, -, -decay, and -delayed neutron emission, are taken from JAERI (Horiguchi, Tachibana, & Katakura, 1996), that includes experimental and theoretical decay rates of nuclei near the stability line. On the -decay rates not available in JAERI, theoretical rates by Mller, Nix, & Kratz (1997) for NETWORK A or those by Tachibana & Yamada (1995) are adopted for NETWORK B.
The same fission data is adopted for both NETWORK A and B. (a) Spontaneous fission: Experimental half lives and branching ratios of spontaneous fission are taken from Horiguchi, Tachibana, & Katakura (1996) and Kinsey et al. (1996). While theoretical formula of half life (Kodama & Takahashi, 1975, eq. (23)) with empirical fission barrier (Mamdouh, Pearson, Rayet & Tondeur, 1999, 2001) is adopted for nuclei whose half lives are not known experimentally, for all nuclei of both 155 and 240, the life times of the decay are set to be s (Panov, Freiburghaus, & Thielemann, 2001). (b) -delayed fission: Branching ratios of -delayed fission are taken from Staudt & Klapdor-Kleingrothaus (1992). (c) Fission yields: Empirical formula (Kodama & Takahashi, 1975, eq. (5)) is adopted about decay products.
Since many charged particles participate in the nucleosynthesis during the explosion, we have included the screening effects for all relevant reactions (Koike et al., 2004). We also use theoretical weak interaction rates that are the function of the density and temperature (Fuller, Fowler, & Newman, 1980, 1982).
| Nuclides | A | Nuclides | A | Nuclides | A | Nuclides | A | Nuclides | A |
|---|---|---|---|---|---|---|---|---|---|
| H | 1 – 3 | Sc | 39 – 67 | Nb | 83 – 125 | Pm | 143 – 187 | Tl | 203 – 263 |
| 3 | 67 | 129 | 187 | 255 | |||||
| He | 3 – 6 | Ti | 40 – 70 | Mo | 86 – 126 | Sm | 144 – 188 | Pb | 204 – 264 |
| 6 | 72 | 132 | 188 | 259 | |||||
| Li | 6 – 8 | V | 43 – 73 | Tc | 90 – 129 | Eu | 151 – 189 | Bi | 209 – 265 |
| 8 | 76 | 133 | 193 | 263 | |||||
| Be | 7 – 12 | Cr | 44 – 74 | Ru | 96 – 130 | Gd | 152 – 190 | Po | 210 – 266 |
| 12 | 78 | 136 | 196 | 267 | |||||
| B | 8 – 14 | Mn | 46 – 77 | Rh | 101 – 141 | Tb | 155 – 198 | At | 211 – 269 |
| 14 | 81 | 137 | 197 | 269 | |||||
| C | 11 – 18 | Fe | 47 – 78 | Pd | 102 – 142 | Dy | 156 – 212 | Rn | 215 – 270 |
| 18 | 84 | 138 | 202 | 270 | |||||
| N | 12 – 21 | Co | 50 – 81 | Ag | 105 – 149 | Ho | 161 – 215 | Fr | 218 – 271 |
| 21 | 85 | 147 | 203 | 271 | |||||
| O | 14 – 22 | Ni | 51 – 82 | Cd | 106 – 150 | Er | 162 – 216 | Ra | 221 – 272 |
| 22 | 86 | 148 | 208 | 272 | |||||
| F | 17 – 26 | Cu | 56 – 91 | In | 111 – 155 | Tm | 167 – 221 | Ac | 224 – 273 |
| 26 | 89 | 149 | 215 | 273 | |||||
| Ne | 7 – 30 | Zn | 57 – 94 | Sn | 112 – 156 | Yb | 168 – 222 | Th | 227 – 274 |
| 34 | 92 | 154 | 218 | 274 | |||||
| Na | 20 – 34 | Ga | 60 – 95 | Sb | 119 – 162 | Lu | 173 – 224 | Pa | 230 – 278 |
| 37 | 97 | 161 | 225 | 277 | |||||
| Mg | 20 – 36 | Ge | 61 – 102 | Te | 120 – 164 | Hf | 174 – 226 | U | 232 – 280 |
| 38 | 100 | 164 | 228 | 280 | |||||
| Al | 22 – 41 | As | 64 – 103 | I | 123 – 171 | Ta | 179 – 235 | Np | 235 – 284 |
| 41 | 101 | 165 | 229 | 284 | |||||
| Si | 24 – 44 | Se | 65 – 106 | Xe | 124 – 180 | W | 180 – 236 | Pu | 238 – 287 |
| 46 | 104 | 168 | 232 | 288 | |||||
| P | 27 – 45 | Br | 68 – 117 | Cs | 129 – 181 | Re | 183 – 239 | Am | 241 – 290 |
| 49 | 117 | 181 | 235 | 292 | |||||
| S | 28 – 48 | Kr | 69 – 118 | Ba | 130 – 182 | Os | 184 – 240 | Cm | 244 – 294 |
| 50 | 118 | 182 | 236 | 296 | |||||
| Cl | 31 – 51 | Rb | 74 – 119 | La | 135 – 183 | Ir | 189 – 241 | Bk | 247 – 298 |
| 51 | 119 | 183 | 239 | 300 | |||||
| Ar | 32 – 56 | Sr | 77 – 120 | Ce | 136 – 184 | Pt | 190 – 242 | Cf | 250 – 302 |
| 54 | 120 | 184 | 243 | 304 | |||||
| K | 35 – 55 | Y | 79 – 121 | Pr | 141 – 185 | Au | 195 – 257 | Es | 253 – 306 |
| 57 | 121 | 185 | 247 | 308 | |||||
| Ca | 36 – 62 | Zr | 81 – 122 | Nd | 142 – 186 | Hg | 196 – 258 | Fm | 256 – 310 |
| 60 | 124 | 186 | 251 | 312 |
3 SUPERNOVA MODELS
3.1 Initial Models
The presupernova model has been calculated from the evolution of He-core of 3.3 that corresponds to 13 in the main sequence stage (Hashimoto, 1995). The mass of the Fe-core is 1.18 that is the smallest Fe-core in massive stars obtained from the stellar evolutionally calculation with the limitation of the spherical symmetry. The edge of the Fe-core that has steep density gradient is at cm from the center. The mass of the Si-rich layer is and the layer extends to cm above the Fe-core. Since the central density exceeds () and temperature in units of K, the Fe-core just begins to collapse.
Initial models for the collapse calculations (precollapse models) are constructed by using the density and temperature distributions of the original Fe+Si core. We adopt cylindrical properties of the angular velocity and the toroidal component of the magnetic field as follows (Kotake et al., 2004):
| (1) |
where and are the distances from the rotational axis and the equatorial plane with and being model parameters. Both and are the initial values at and . Initial parameters of four precollapse models are given in Table 2. The spherically symmetric case is denoted by model 1. In model 2, the profiles of rotation and magnetic field in the Fe-core are taken to be nearly uniform. We present model 4 as the case having a differentially rapid rotating core and strong magnetic fields. An intermediate example, model 3 between model 2 and model 4 is prepared for reference. Since the value of is higher compared to that used in Takiwaki et al. (2004) by a few percents, we regard the present case of % as rather rapid rotating stars with the moderate magnetic field. In all computations, spherical coordinates are adopted. The computational region is set to be km and , where the included mass in the precollapse models amounts to . The first quadrant of the meridian section is covered with mesh points. To get information of mass elements, five thousand tracer particles are placed within the region of between ( km) and ( km).
| Model | (%) | (%) | (G) | |||
|---|---|---|---|---|---|---|
| model 1 | 0 | 0 | 0 | 0 | 0 | 0 |
| model 2 | 0.5 | 0.1 | 1 | 1 | 5.2 | 5.4 |
| model 3 | 0.5 | 0.1 | 0.5 | 1 | 7.9 | 1.0 |
| model 4 | 0.5 | 0.1 | 0.1 | 1 | 42.9 | 5.2 |
3.2 Explosion Models
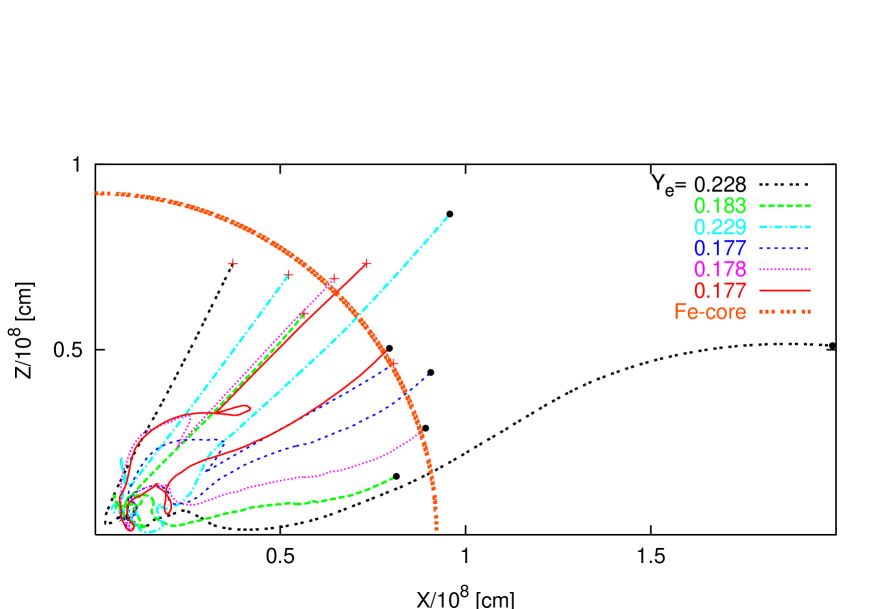
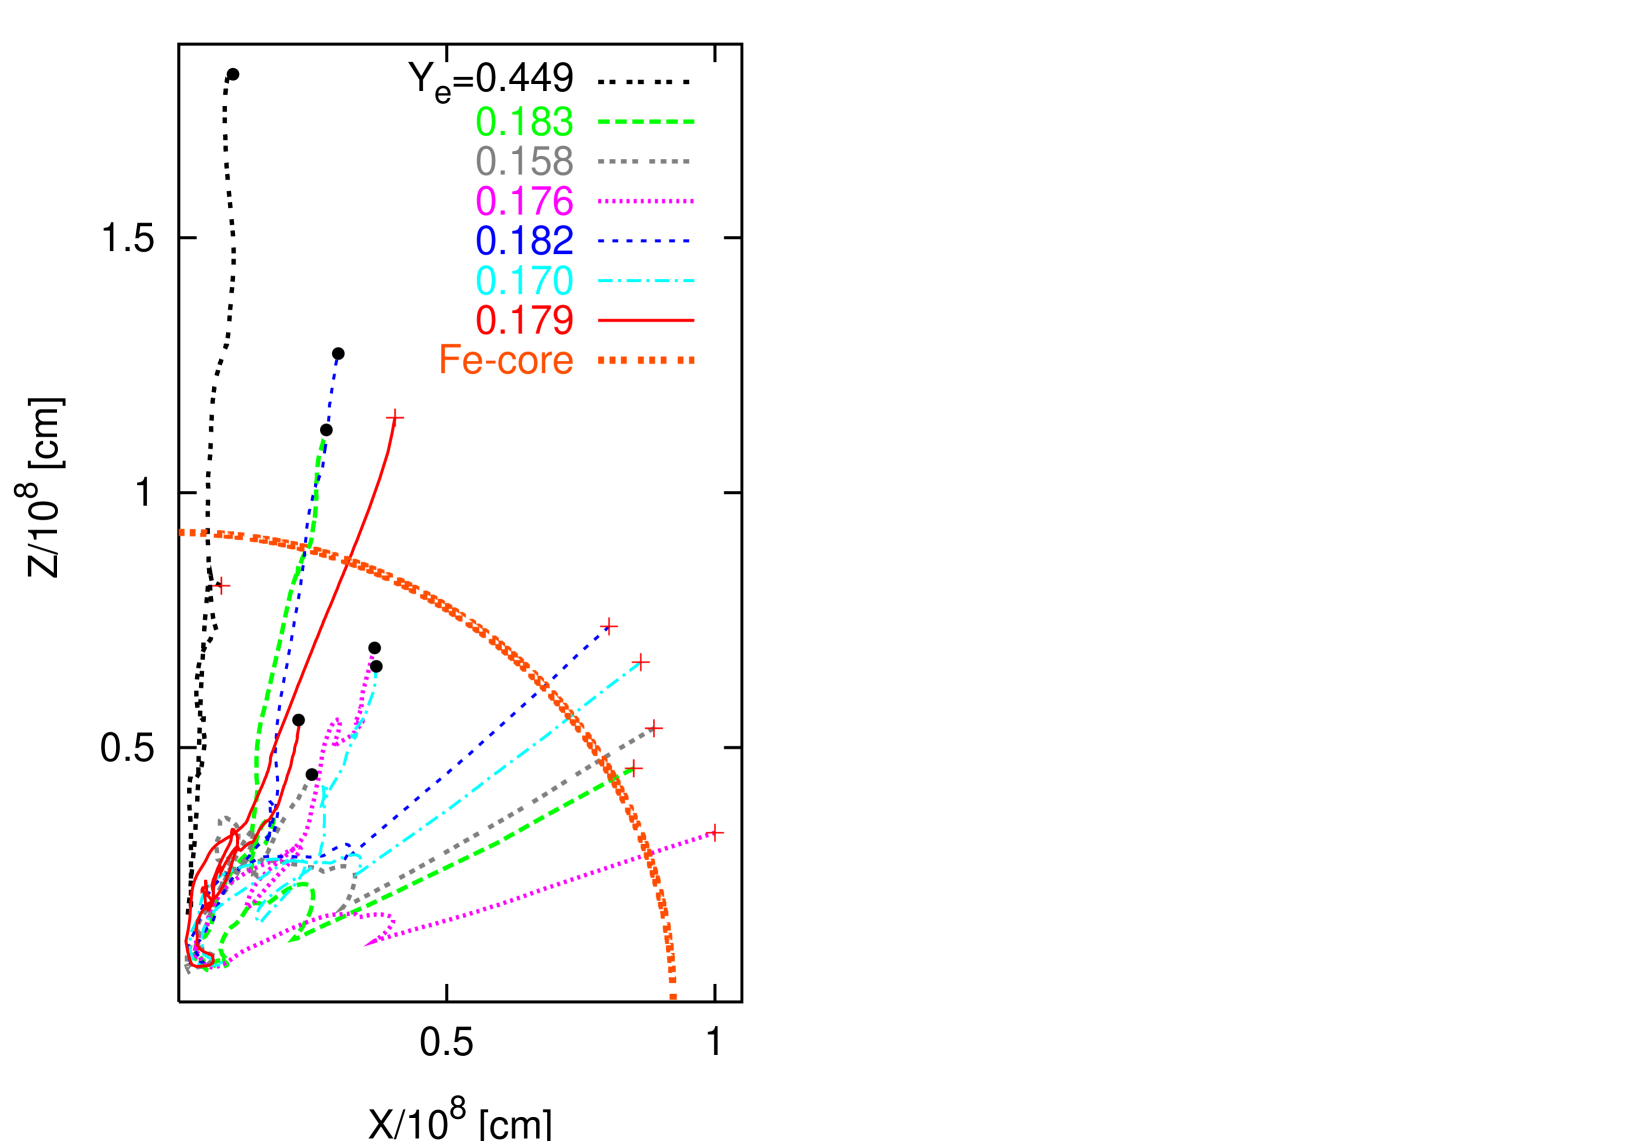
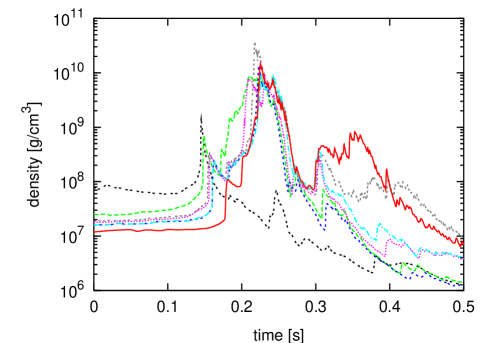
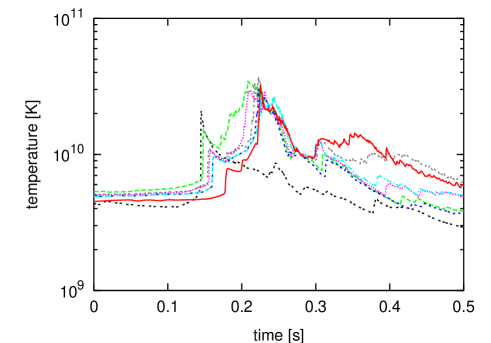
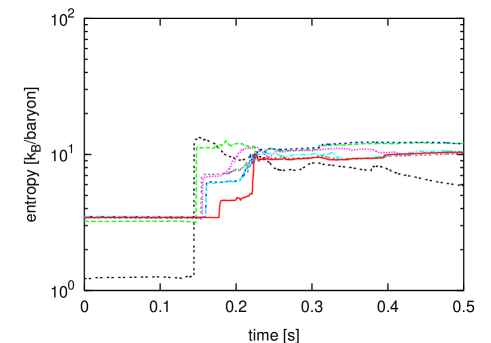
We perform the calculations of the collapse, bounce, and the propagation of the shock wave with use of ZEUS-2D in which the realistic equation of state (Shen et al., 1998) has been implemented by Kotake et al. (2004). We do not include the neutrino transport, since our aim is to clarify the differences in the nucleosynthesis between spherical and MHD jet explosion. It is noted that the contribution of the nuclear energy generation is usually negligible compared to the shock energy. In Table 3, our results of MHD calculations are summarized. is the explosion energy when the shock reaches the edge of the Fe-core (Yamada & Sawai, 2004). In model 3, the explosion is failed due to the specific combination of rotation and magnetic field between the values of model 2 and model 4; although still exists, the radial distance from the center in the generated shock front at the bounce shrinks gradually after a few oscillations of the front. Therefore, it does not always depend on and/or whether the explosion succeeds or not. In Figs. 1 and 2 trajectories of tracer particles are shown for some specified values of . While the jet-like explosion occurs along the equator in model 2 (Fig. 1), collimated jet is emerged from the rotational axis in model 4 (Fig. 2). Figure 3 shows the density, temperature, and entropy per baryon in of the tracer particles in Fig. 2. We find after the jet-like explosion of model 4 that it remains 1.24 proto-neutron star inside the radius 300 km accompanying successive accretion onto the star with at s.
| Model | ||||||||
|---|---|---|---|---|---|---|---|---|
| model 1 | 114 | 424 | 0 | 0 | 2.050 | 0.272 | ||
| model 2 | 132 | 565 | 6.2 | 0.042 | 0.728 | 0.177 | ||
| model 3 | 138 | 492 | 6.0 | 0.143 | 0.559 | – | – | – |
| model 4 | 141 | 507 | 6.0 | 0.130 | 0.306 | 0.158 |
4 SIMULATIONS OF THE -PROCESS NUCLEOSYNTHESIS
During the explosion, the temperature exceeds K around the layers of the Si+Fe core, where the region of the nuclear statistical equilibrium (NSE) is realized as shown in Fig. 3. Therefore, we follow the change in of the ejected tracer particle due to the weak interactions of electron/positron captures, and -decays until the last stage of NSE. We set this stage to be ; afterward the temperature decreases in time as shown in Fig. 3. The change in is calculated from the relation
| (2) |
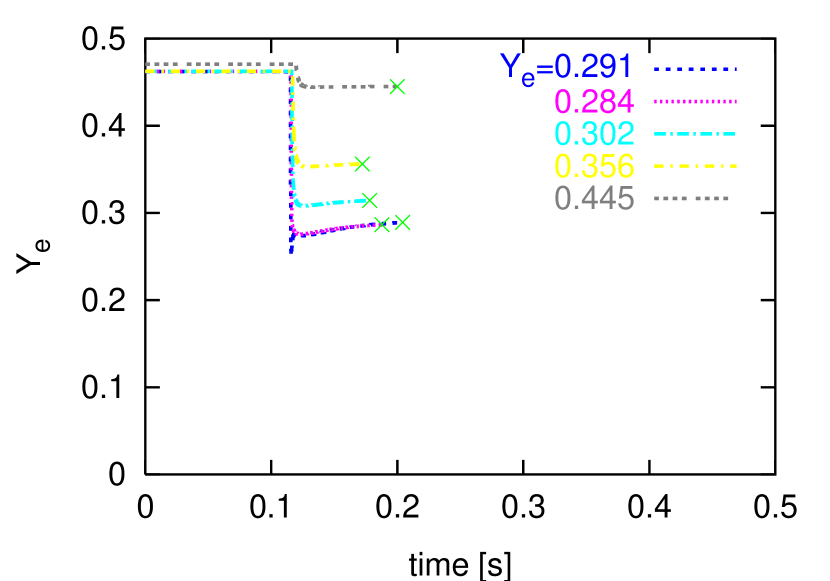
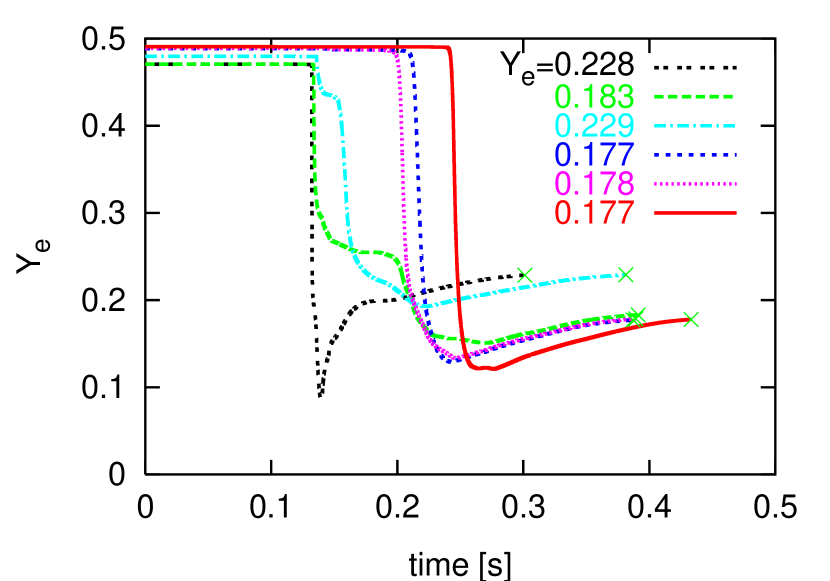
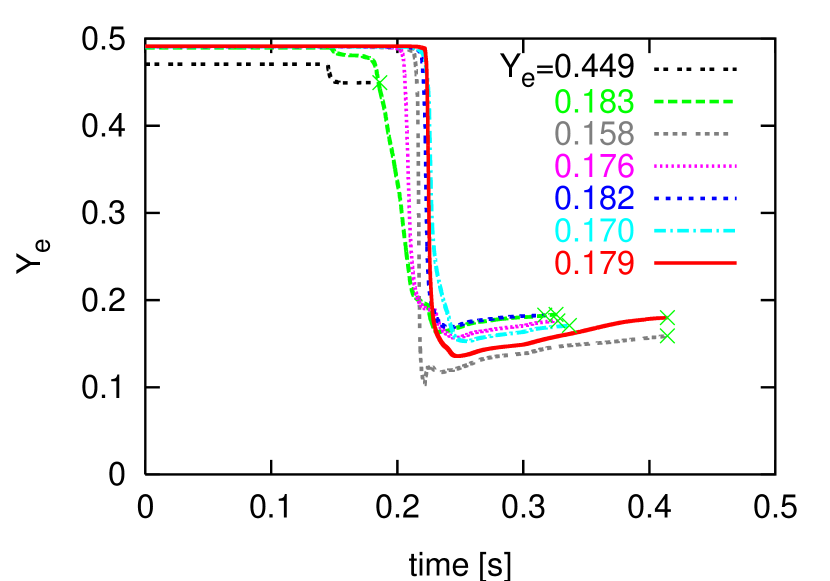
where for the abundance , consists of the and positron capture rates, and consists of the and electron capture rates, respectively. Time evolutions of relevant to the -process are shown in Fig. 4 (left panels). The trajectories of tracer particles with are depicted in Fig. 1 for model 2 and those with in Fig. 2 for model 4, respectively; the values of indicate those of the last stage of the NSE calculation. In model 4, the polar region is ejected having rather high value of . The lowest value of is discovered from around the region inclined at 20 – 30 degrees from the rotational axis.
Thereafter, using the compositions obtained from the last NSE stage and the profiles of the density and temperature during the explosion, we perform the -process nucleosynthesis with the nuclear reaction network described in §2. We remark that after the last stage of the NSE, the changes in for Fig. 4 are obtained from the calculations by the full network. After the time , both the temperature and density are extrapolated to s () in proportion to with for the temperature and for the density, respectively (Sumiyoshi et al., 2001). We consider that the qualitative results of the -process nucleosynthesis do not depend much on the value of .
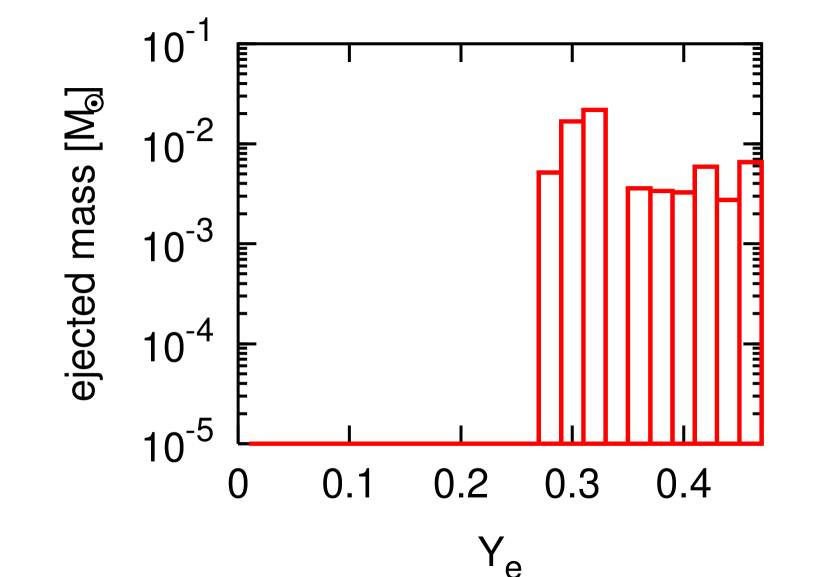
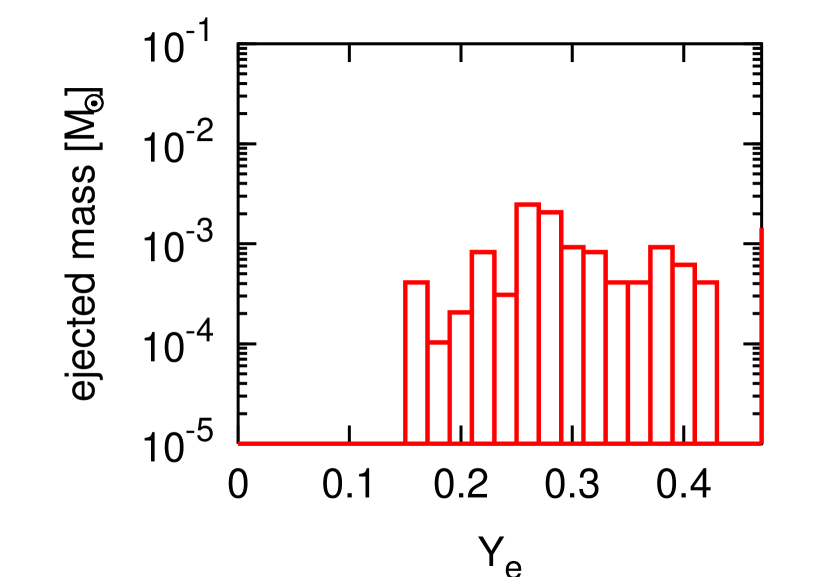
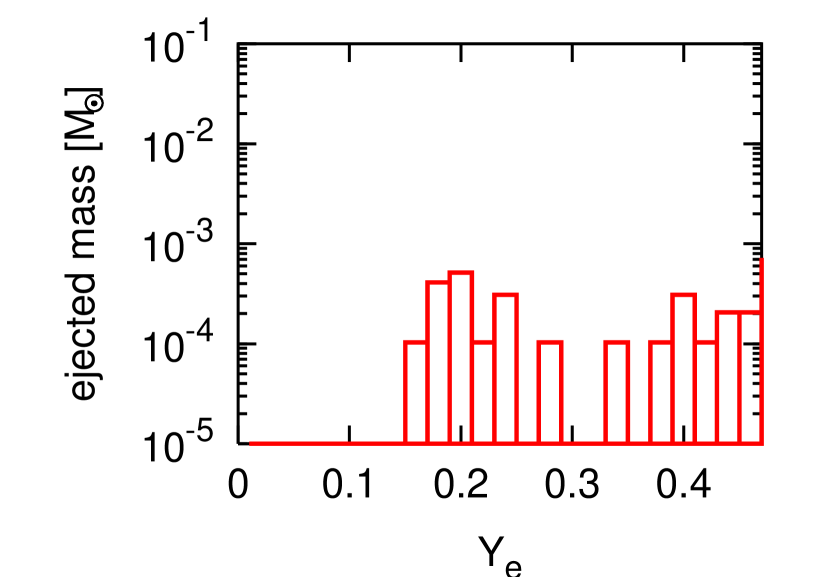
Figures 4 (right panels) show the ejected mass in against in the range . For the spherical explosion, materials with is ejected. The ejection for occurs from inside the Fe-core in the range of km. On the other hand, ejection occurs in the direction of the equator with for model 2. As shown in Fig. 2, materials with are emerged for the jet-like explosion along the rotational axis (model 4). For both models 2 and 4, the ejection for comes from the Si-rich layer. We recognize that as against the spherical explosion, jet-like explosion of model 4 decreases significantly.
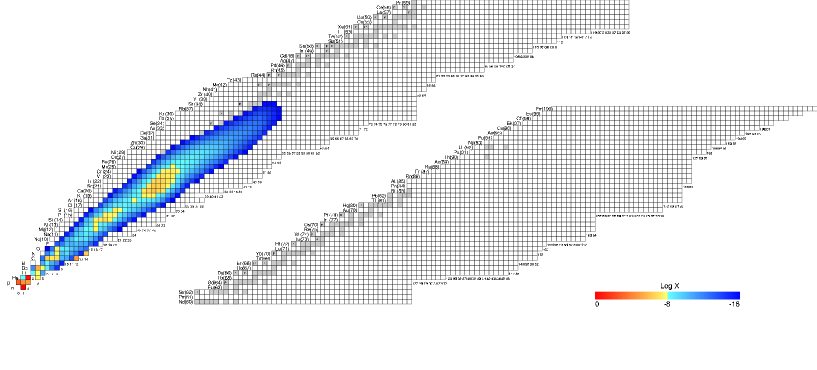
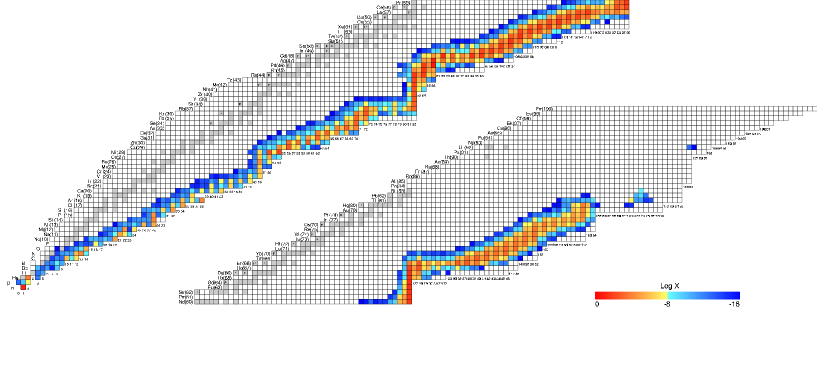
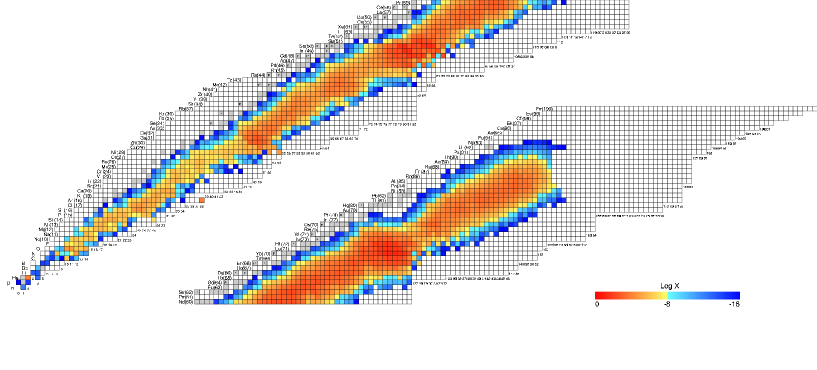
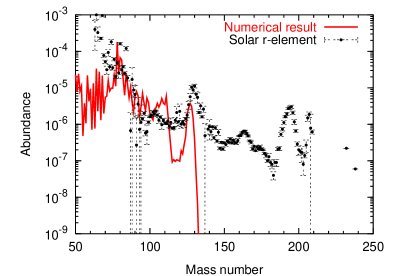
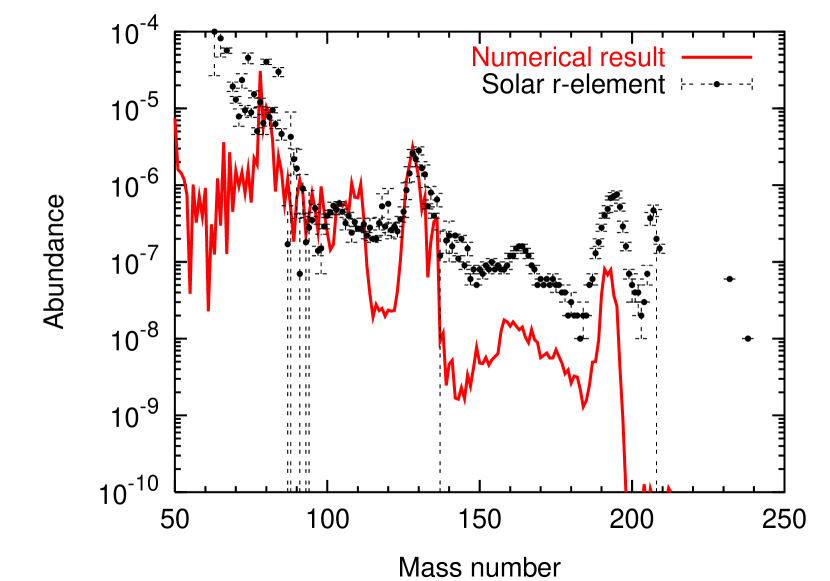
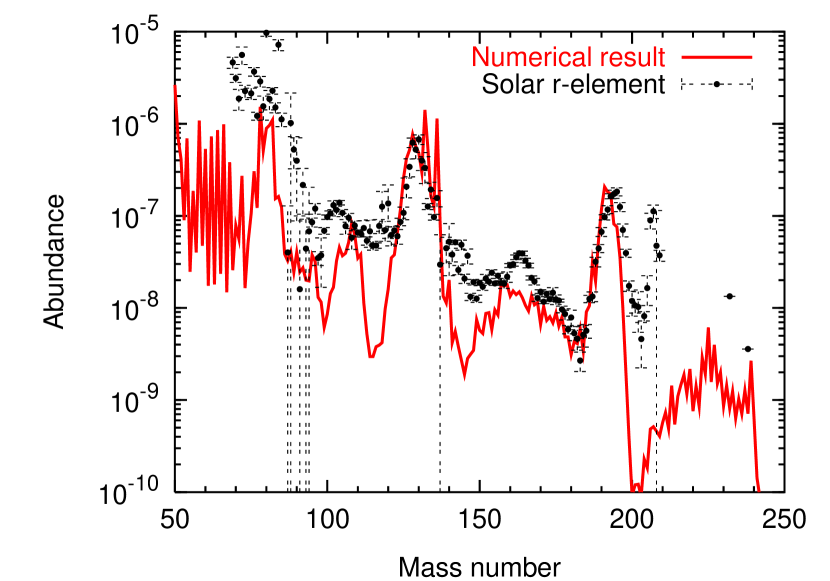
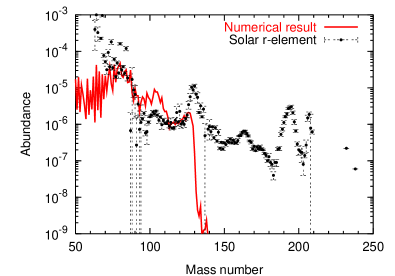
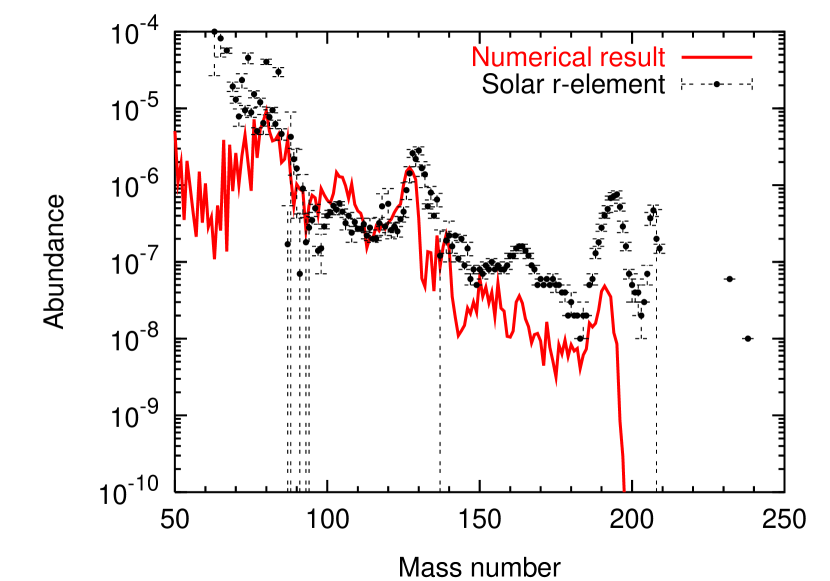
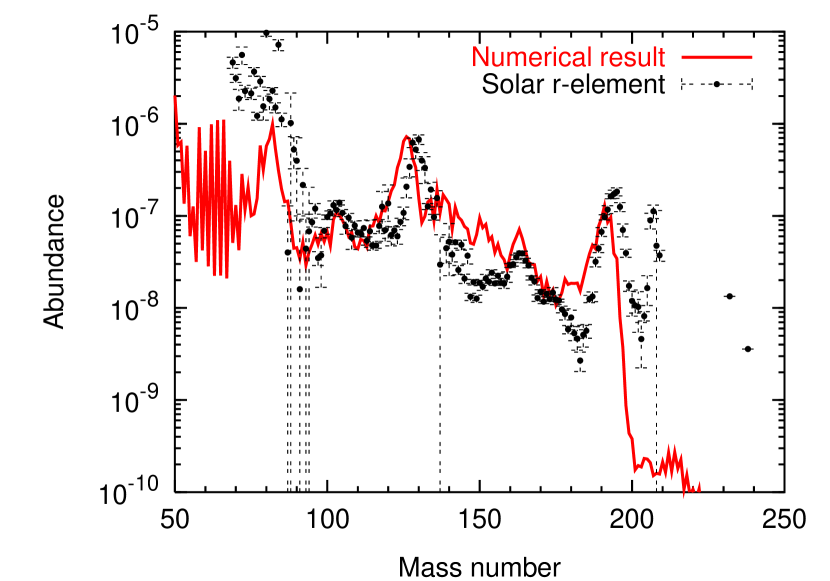
We calculated the -process nucleosynthesis during the MHD explosion using NETWORKs A and B. The progress in the -process is shown in Fig. 5 at three epochs in model 4. Since decreases to 0.158 at the last stage of NSE, the -process paths reach to the neutron drip line. Figures 6 and 7 show the comparison of the solar -process abundances with obtained abundances. Generally, compared to the spherical explosion the jet-like explosion results in the increase of the nuclei for . The reproduction of the peaks in the distributions of the -elements depends on the decrease in during the early phase of the explosion (). In model 1, the produced -elements are not enough to explain even the second peak in the -process pattern. In model 2, although the second peak is reproduced well, the amount of the produced -elements are too small to explain the third peak. For model 4 we succeed in making the global abundance pattern of the -elements from the first to the third peak.
Moreover, we find that the fission cycling leads to the normal -process nucleosynthesis based on (n,) (,n) equilibrium accompanied with -decays for the low region (). On the other hand, distribution of final products are found to be much sensitive to the mass formula as seen in the differences between Figs. 6 and 7. This is because the global -process pattern and the profiles of the peaks in the abundance pattern depend on the -decay rates that have been calculated using the mass formulae explained in §2.
5 SUMMARY & DISCUSSION
Using ZEUS-2D, we find the thermodynamical conditions for the -process to occur. The appropriate condition of the density, temperature and can be satisfied under the initial rotation law and the magnetic field strength of the precollapse model; the jet between the polar and the equatorial radius produces the -process elements which emerge from the Si-rich layers above the Fe-core. Contrary to the calculation under an artificial explosion energy and a located outside the Fe-core in the spherical model (Thielemann, Nomoto, Hashimoto, 1996), we have pursued the calculation from the collapse to the bounce, and shock wave propagation that attains to the edge of the Fe-core. While the spherical explosion reproduces at most to the beginning of the second peak in the abundance pattern of the solar -elements, jet-like explosion due to the effects of MHD in the direction of the rotational axis succeeds in reproducing the third peak. However, our results depend on the initial parameters for both the strength of the rotation and magnetic field. For the jet-like explosion from the equator, the reproduction of the -elements is limited to the second peak. We stress that the -process nucleosynthesis can have many variations if the MHD effects play an important role in the supernova explosion.
The shape and the position of peaks depend crucially on the mass formula and -decay rates. However, it is considered that theoretical data on -decay rates has large uncertainty. Therefore, model 4 can reproduce well the solar -process abundance pattern within the uncertainties of -decay rates. The -decay rates calculated by the gross theory are tend to become small compared to those obtained by shell model computations. As a consequence, NETWORK A makes the three peaks more clearly than NETWORK B. Small abundance peak around is not built enough in the present calculations for both networks. It is hoped that the information of the -process acquired through theoretical and observational studies may give severe constraints to the nuclear data.
In the present calculation, the fission process does not play an important role, since the ejected mass of the very low region is small. However, production of abundances for may need the region of as suggested in Figs. 6 and 7. Furthermore, fission should be included in the -process calculation for the situation of very low such as a neutron star merger with (Freiburghaus et al., 1999; Rosswog, Freiburghaus, & Thielemann, 2001).
As shown in Table 3 ejected mass of the -elements amounts to in case of model 4 that is one tenth of the total ejected mass. Since the ejected mass of oxygen is for the spherical explosion of the helium core (Hashimoto, 1995), the ratio is large by a factor of 100 compared to the corresponding solar ratio of . It has been pointed out for the explosion of massive stars the underproduction of the p-nuclides with respect to oxygen, when normalized to the solar values (Rayet et al., 1995). However it is found that as far as the case in the 3.3 helium core, produced p-nuclides are free from the problem of the underproduction (Rayet et al., 1995). Considering uncertainties neglected in the present simulations and the differences in the nucleosynthesis between the spherical and jet-like explosion, the problem of the overproduction in the -elements should be worth while to examine in detail.
In the present investigation, as the first step we ignore the effects of neutrino transport. It is known that neutrinos take off the explosion energy significantly. Therefore, delayed explosion by neutrino heating is the most promising scope of the supernova explosion. However, there exists difficulties related to the two dimensional treatment of neutrino transport (Kotake, Yamada, & Sato, 2005): even one dimensional simulations that include the detailed neutrino transport process do not succeed in the explosion (Janka et al., 2004). Our purpose has been to study the effects of the MHD jet on the -process and elucidate the differences in the produced -elements from the spherical explosion. For the next step, some investigations that include the neutrino transport will be pursued.
References
- Audi & Wapstra (1995) Audi, G., & Wapstra, A. H. 1995, Nucl. Phys. A, 595, 409
- Freiburghaus et al. (1999) Freiburghaus, C., Rosswog, S., Thielmann, F.-K. 1999, ApJ, 525, L121
- Fuller, Fowler, & Newman (1980) Fuller, G. M., Fowler, W. A., & Newman, M. 1980, ApJS 42 447
- Fuller, Fowler, & Newman (1982) Fuller, G. M., Fowler, W. A., & Newman, M. 1982, ApJS 48 279
- Goriely (2002) Goriely, S. (2002), in Proc. of Nuclei in the Cosmos VII (Japan, July 2002) in press, MOST: http://www-astro.ulb.ac.be/Nucdata
- Hashimoto et al. (1989) Hashimoto, M., Nomoto, K., Shigeyama, T. 1989, AA, 210, L5.
- Hashimoto (1995) Hashimoto, M. 1995, Prog. Theor. Phys. 94 663.
- Heger et al. (2004) Heger, A., Woosley, S. E., Langer, N., & Spruit, H. C. in IAU Symp. 215, Stellar Rotaion, in press (astro-ph/0301374)
- Horiguchi, Tachibana, & Katakura (1996) Horiguchi, T., Tachibana, T., & Katakura, T. 1996, Chart of the Nuclides (Ibaraki: Nucl. Data Center)
- Kppeler et al. (1989) Kppeler, F., Beer, H. and Wisshak, K. 1989, Rep. Phys. 52 945
- Janka et al. (2004) Janka, H.-Th. et al. IAU Coll. 192, in press (astro-ph/0401461)
- Kinsey et al. (1996) Kinsey, R. R. et al., The NUDAT/PCNUDAT Program for Nuclear Data, the 9 th International Symposium of Capture-Gamma-ray Spectroscopy and Related Topics, Budapest, Hungary, October (1996)
- Kodama & Takahashi (1975) Kodama, T., Takahashi, K. 1975 Nucl. Phys. A239 489.
- Koike et al. (2004) Koike, O., Hashimoto, M., Kuromizu, R., Fujimoto, S., 2004, ApJ, 603, 242
- Kotake et al. (2004) Kotake, K., Sawai, H., Yamada, S., & Sato, K. 2004, ApJ, 608, 391
- Kotake et al. (2004) Kotake, K., Yamada, S., Sato, K., Sumiyoshi, K., Ono, H., & Suzuki, H. 2004, Phys. Rev. D. , 609, 124004
- Kotake, Yamada, & Sato (2005) Kotake, K., Yamada, S., & Sato, K. 2005, ApJ, 618, 474
- Mamdouh, Pearson, Rayet & Tondeur (1999) Mamdouh, A., Pearson, J.M., Rayet, M., & Tondeur, F. 1999, Nucl. Phys. A. 644, 389
- Mamdouh, Pearson, Rayet & Tondeur (2001) Mamdouh, A., Pearson, J.M., Rayet, M., & Tondeur, F. 2001, Nucl. Phys. A. 679, 337
- Mller, Nix, Myers, & Swiatecki (1995) Mller, P., Myers, W. D., & Swiatecki, W. J. 1995, At. Data Nucl. Data Tables, 59, 185
- Mller, Nix, & Kratz (1997) Mller, P., Nix, J. R., Kratz, K.-L. 1997, Atomic Data and Nuclear Data Tables, Vol. 66 p. 131
- Nagataki et al. (1997) Nagataki, S., Hashimoto, M., Sato, K., & Yamada, S. 1997, ApJ, 486, 1026
- Panov, Freiburghaus, & Thielemann (2001) Panov, I. V., Freiburghaus, C., Thielmann, F.-K. 2001, Nucl. Phys. A688 587c.
- Qian (2003) Qian Y.-Z. 2003, Prog. Part. Nucl. Phys. 50, 153
- Qian (2005) Qian, Y-Z. 2005, First Argonne/MSU/JINA/INT RIA Wokshop
- Rauscher & Thielemann (2000) Rauscher, T., & Thielemann, F.-K. 2000, At. Data Nucl. Data Tables 75 1
- Rauscher & Thielemann (2001) Rauscher, T., & Thielemann, F.-K. 2001, At. Data Nucl. Data Tables, 79 47 REACLIB Web Site : http://quasar.physik.unibas.ch/ tommy/reaclib.html
- Rayet et al. (1995) Rayet, M., Arnould, M., Hashimoto, M., Prantzos, N., & Nomoto, K. 1995, A&A 298, 517
- Staudt & Klapdor-Kleingrothaus (1992) Staudt, A., Klapdor-Kleingrothaus, H. V. 1992, Nucl. Phys. A549 254
- Rosswog, Freiburghaus, & Thielemann (2001) Rosswog, S.K., Freiburghaus, C., & Thielemann, F.-K. 2001, Nucl. Phys. A688, 344
- Shen et al. (1998) Shen, H., Toki, H., Oyamatsu, K., & Sumiyoshi, K. 1998, Nucl. Phys. A., 637, 435
- Stone & Norman (1992) Stone, J. M., & Norman, M. L. 1992, ApJS, 80, 791
- Sumiyoshi et al. (2000) Sumiyoshi, K. et al. 2000, Pub. Astron. Soc. Japan, 52 601
- Sumiyoshi et al. (2001) Sumiyoshi, K. et al. 2001, ApJ, 561, 880
- Tachibana & Yamada (1995) Tachibana, T., & Yamada, M. Proc. Int. Conf on exotic nuclei and atomic masses, Arles, 1995, p.763
- Takiwaki et al. (2004) Takiwaki, T., Kotake, K., Nagataki, S., & Sato, K. 2004, ApJ, 616, 1086
- Thielemann, Nomoto, Hashimoto (1996) Thielemann, F.-K., Nomoto, K., & Hashimoto, M., 1996, ApJ, 460, 408
- Thielemann et al. (2001) Thielemann, F.-K., et al. Proceedings of 1CRC 2001: 1©Copernicus Gesellschaft 2001
- Timmes, Woosley, & Weaver (1995) Timmes, F. X., Woosley, S. E., & Weaver, T. A. 1995, ApJS, 98, 617
-
Tsujimoto et al. (1993)
Tsujimoto, T., Iwamoto, K., Hashimoto, M., Nomoto, K., & F-K Thielemann
1993 in Origin and Evolution of the Elements, World Scientific, 50 - Woosley & Weaver (1995) Woosley, S. E., & Weaver, T. A. 1995, ApJS, 101, 181
- Yamada & Sawai (2004) Yamada, S., & Sawai, H., 2004, ApJ, 608, 907
- Yamada, Kotake, & Yamasaki (2004) Yamada, S., Kotake, K., & Yamasaki, T. 2004, New. J. Phys., 6, 79