A cross-calibration between Tycho-2 photometry and HST spectrophotometry
Abstract
I show that Tycho-2 photometry and HST spectrophotometry are accurate and stable enough to obtain a precise cross-calibration by analyzing a well-calibrated sample of 256 stars observed with both Hipparcos and HST. Based on this analysis, I obtain the following photometric zero points in the Vega magnitude system for Tycho-2: 0.0200.001 (), 0.0780.009 (), and 0.0580.009 ().
1 Introduction
It is nowadays extremely common to analyze photometric observations by comparing them with synthetic photometry derived from observed or theoretical spectral energy distributions (SEDs). Such comparisons are done by establishing a magnitude system based on a reference spectrum, be that of a real object, such as Vega, or a simple artificial spectrum, such as a constant in or (STScI, 1998). Each reference spectrum yields a different magnitude system defined from the expression:
| (1) |
where is the total-system sensitivity curve, is the SED of the object, is the SED of the reference spectrum, and ZPP is the zero point for filter . In order to attain accurate results when comparing measured magnitudes or colors with SED models, it is necessary not only to have an accurate knowledge of but also of and of ZPP. For example, Bohlin & Gilliland (2004) measured the spectrum of Vega and found that in the Johnson system (which uses that star as a reference), ZPV = 0.0260.008. One can also define a system where ZPP = 0 for any filter, such as the VEGAMAG111Note that it is possible to derive VEGAMAG magnitudes from SEDs using the Johnson throughputs but those values should be different from published photometry due to the different zero points used., STMAG, or ABMAG systems (STScI, 1998).
The lack of an accurate knowledge of the system sensitivities has plagued some ground-based systems such as Johnson’s (Bessell et al., 1998), mostly due to the use of different observing conditions, technologies, and reduction techniques by different observers. Modern space-based telescopes tend to be more uniform and stable and usually produce better-quality photometry. ZPP is usually close to 0.0 but not exactly so, the reason being the common use of secondary calibrators (Vega is often too bright for a detector and/or unaccesible from many sites to be observed). ZPP thus needs to be measured (Bessell et al., 1998; Cohen et al., 2003; Bohlin & Gilliland, 2004), since assuming it is exactly zero can introduce systematic errors in the comparison between observed magnitudes and reference SEDs.
The Hipparcos mission (ESA, 1997) observed the full sky and yielded the Tycho catalog, which is reasonably complete down to . The original Tycho catalog was consequently reprocessed by Høg et al. (2000b) to produce the Tycho-2 catalog, which contains 2.5 million stars and is currently the most complete and accurate all-sky photometric survey in the optical. The Tycho-2 catalog contains photometry in two optical bands, and , whose sensitivities were analyzed by Bessell (2000) and use Vega as the reference spectrum. The careful processing of Tycho-2 photometry was described by Høg et al. (2000a), including the difffferent tests used to check for possible systematic errors.
HST spectrophotometry is calibrated using the method of Colina & Bohlin (1994), which is based on a combination of Landolt photometry, ground-based spectrophotometry, and SED models. Four white dwarf stars observed with the Space Telescope Imaging Spectrograph (STIS) are used as primary calibrators: G191B2B, GD71, GD153, and HZ43 (Bohlin et al., 1995). The absolute flux calibration has an accuracy of 4% in the FUV and 2% in the optical (Bohlin, 2000) but, given that the photometric repeatibility of STIS is 0.2-0.4% (Bohlin et al., 2001), the relative flux calibration for colors derived from STIS spectra is expected to be better than 2% in the optical. The latest values for the Advanced Camera for Surveys (ACS) photometric zero points are also based on that same calibration (De Marchi et al., 2004).
Given the usefulness of the Tycho-2 photometric database for a number of astronomical studies and the accuracy of the absolute flux calibration of HST spectrophotometry, I considered it important to calibrate the first with respect to the second one, as well as to check the existence of possible problems in either of them. Ultimately, we want to obtain the zero points for Tycho-2 magnitudes, ZP and ZP, and color, ZP.
2 The data
In order to test the consistency of the Tycho-2 and HST calibrations we would ideally need a large uniform sample of stars with and magnitudes that has also been observed in the optical with an HST spectrograph. Such a sample has indeed been obtained for the Next Generation Spectral Library (or NGSL, Gregg et al. 2004, see also http://lifshitz.ucdavis.edu/~mgregg/gregg/ngsl/ngsl.html). Originally, the NGSL intended to obtain low-resolution 1660-10 200 Å spectra for 600 stars with a wide range of temperatures, gravities, and metallicities. Unfortunately, the failure of STIS in August 2004 ended the program before reaching that goal. However, 378 stars that are also included in the Tycho-2 catalog had already been observed, and that number is large enough for our purposes.


Each star was observed using three different STIS gratings, G230LB, G430L, and G750L. Here, only the latter two will be used since those are the ones that span the Tycho-2 filters. The NGSL spectra were obtained using the 520.2 slit without a peak-up, which is not the ideal configuration for absolute spectrophotometric calibration, the reason being that the slit is narrow enough that if the star is not well centered, the aperture correction used may not be accurate. In principle, an off-center positioning could also cause problems with the relative spectrophotometric calibration if the aperture correction was strongly dependent on wavelength due to variations in the PSF222Also, due to diffraction off the slit edge.. Fortunately, for G430L and G750L that is only a strong effect at the long-wavelength part of the spectrum beyond (STScI, 2005). Therefore, the relative fluxes (and hence the derived colors) should not be affected as long as the star did not shift position significantly during the visit. Given that all exposures for a given star were obtained in a single orbit (usually not filling it completely) and that the typical drift rate for HST is less than 10 mas/hr (STScI, 2005), indeed one would expect a shift of less than 10% of a STIS CCD pixel in the relative position of the star with respect to the slit between the first and the last exposure. There are also two calibration issues that need to be addressed regarding the fact that all exposures were obtained at the E1 position using a CCD subarray. The use of a subarray requires the definition of a background region closer to the star than for a measurement with a full array; I checked that this selection did not affect the measured fluxes. Also, the location of the E1 position, closer to the readout point in the detector, minimizes CTE effects but the CTE correction algorithm itself (Bohlin & Goudfrooij, 2003) was not originally designed to work with CCD subarrays, so a test should be carried out to check for its validity.
In order to explore the possible problems with the spectrophotometric accuracy mentioned in the previous paragraph, I first calculated the effect of the CTE correction on the derived spectrophotometric and magnitudes by extracting the spectra with and without the correction and comparing the results. The correction turned out to be very small, with an average of 0.010 magnitudes for , 0.018 magnitudes for , and 0.008 magnitudes for . As a further check, I measured the value of the discontinuity between the G430L and G750L gratings by calculating the ratio between the two fluxes in the 5550-5650 Å, region, where both gratings overlap in coverage. Results are shown in Fig. 1, both without applying the CTE correction and applying it. As it can be seen, in both cases the majority of the data points are clustered around a zero value for the jump, indicating the lack of a systematic effect. However, for the non-CTE-correction case a small slope as a function of is present, which indicates that a non-negligible correction is indeed required. For the case with CTE correction, the data have no dependency with and have a distribution with mean of 0.12% and standard deviation of 1.83%.
Given the results in the previous paragraph, I adopted the following criteria for selecting the NGSL sample:
-
•
The CTE correction was applied.
-
•
Only stars with a 5600 Å jump of less than 2.5% (in absolute value) were included.
-
•
Given that the spectrophotometry and the photometry used in this article were obtained in different epochs, I eliminated variable stars. The criterion used was the presence of a variability flag in the Tycho photometry.
With the restrictions above, our final NGSL sample was reduced to 256 objects.
In order to provide a further check on the possible effects of systematic aperture and CTE effects I used a control sample by analyzing the spectrophotometric standards of Bohlin et al. (2001) that have Tycho-2 photometry with magnitudes brighter than 12.0 and uncertainties of 0.06 magnitudes or less. Those stars were observed with STIS using the 522 slit and with the full CCD array, so the problems mentioned above (slit centering and validity of the CTE correction algorithm) should not be relevant. Four of the Bohlin et al. (2001) stars satisfy the above requirements for both and (BD +17 4708, BD +28, 4211, BD +75 325, HD 93521) and an additional three do so only for (AGK + 81 266, Feige 34, HZ 44).
The stars in both samples were analyzed using a synthetic photometry code created for Maíz-Apellániz (2004) and their spectrophotometric and magnitudes calculated.
3 Results
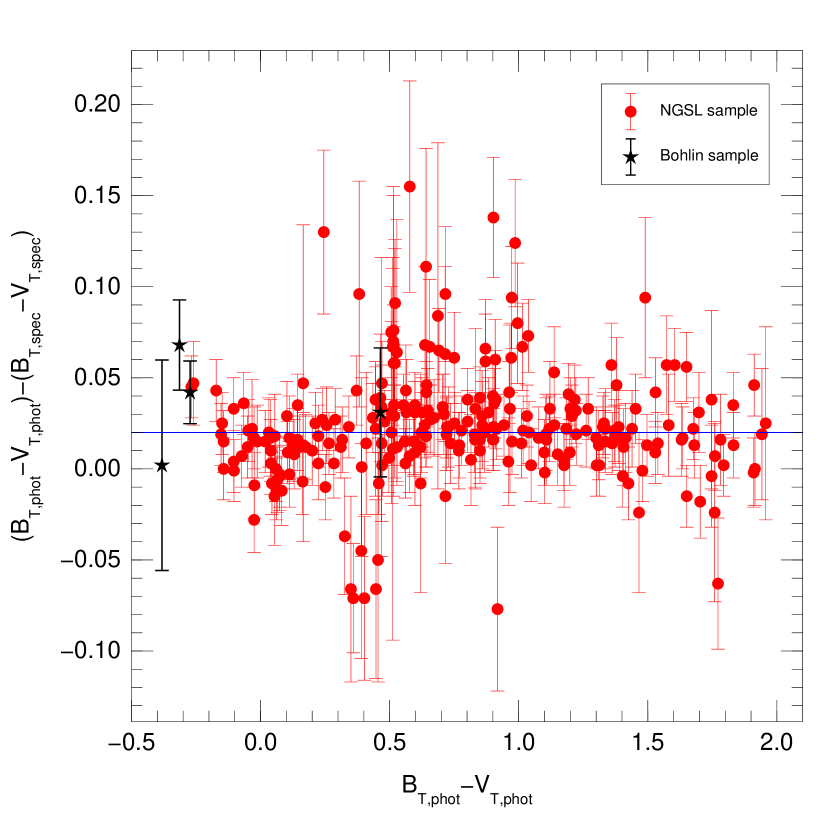


I start by analyzing the relative flux calibration of our data. I show in Fig. 2 the difference between the photometric (from the Tycho-2 catalog) and spectrophotometric (computed from STIS spectra) values for the of each of the stars in our samples as a function of the photometric . No general trend is observed as a function of color and the data are symmetrically distributed around a central value, which I take to be ZP. I measured ZP by calculating the weighted mean using as weights and found it to be 0.0200.001 magnitudes. I show the histogram for the data in Fig. 3, both in absolute and relative (corrected for ZP and dividing each point by its photometric uncertainty) terms. The second histogram has a median of and a standard deviation of 1.04 and the distribution is very well approximated by a normalized Gaussian. All of the above implies that an accurate cross-calibration of colors vs. relative fluxes between Tycho-2 photometry and HST spectrophotometry is possible in principle without having to invoke e.g. modifications in the Tycho filter sensitivities or the STIS calibration. Furthermore, given that the normalized histogram has a standard deviation only slightly larger than 1.0, the largest source of deviations from the expected value originates in the photometry, not in the spectrophotometry. Since the mean photometric = 0.025 magnitudes, the accuracy of the spectrophotometrically-derived Tycho-2 colors must be better than 1%, which agrees with the published value for the STIS photometric repeatibility Bohlin et al. (2001).
Only four objects in the Bohlin sample have both and photometry. Of course, such a low number is not enough to do accurate statistics but we can see in Fig. 2 that the results from that sample are consistent with the derived ZP and with the absence of a color dependence for the cross-calibration. One can argue that the two stars with around 0.3 (BD +75 325 and HD 93521) are slightly above the ZP line and, hence, may indicate the beginning of a small departure from the general rule for very blue objects. However, it can also be a fluctuation caused by small-number statistics, which is reinforced by the reversal of the trend in the bluest of the stars in the Bohlin sample, BD +28 4211. In any case, even if the effect turned out to be real, it would be very small and affect only extremely blue stars.
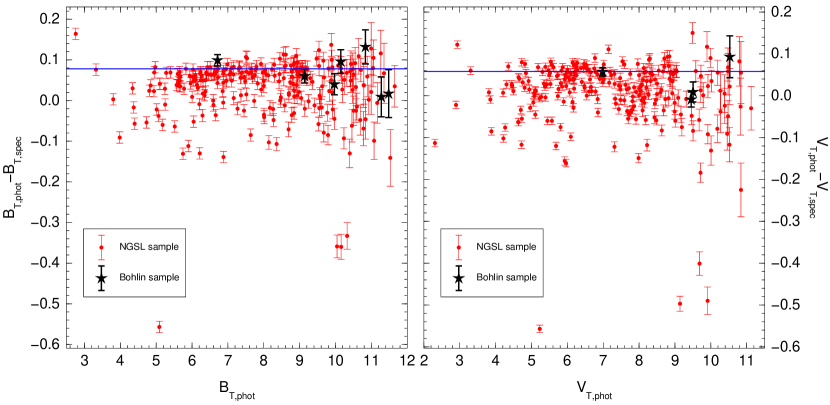
Next, I deal with the absolute calibration of our data. I show in Fig. 4 the difference between the photometric and spectrophotometric values for both (left panel) and (right panel). Once again, no significant trend is observable as a function of or , thus enabling the cross-calibration of the two systems. However, a difference is readily apparent between the relative and absolute plots for the NGSL sample: for the absolute case the data are also concentrated around a central point but a tail towards the negative in the distributions of and is clearly present. Such a behavior is the expected one if some of the stars are not well centered on the 520.2 slit, as previously mentioned. Under such circumstances it is not possible to derive a value for either ZP or ZP with a precision of the order of 0.01 magnitudes or better. Therefore, for that task I decided to use instead the Bohlin sample, which was obtained using the wider 522 slit. Given the high precision achieved for ZP, it is a better strategy to measure just one of the two absolute ZP values and then use the color zero point to obtain the other one. Considering that I have more stars with data than with data (seven vs. four), I choose the first one for the absolute flux calibration. A weighted mean for those seven stars in the Bohlin sample yields ZP = 0.0780.009 magnitudes. Applying ZP, we then obtain ZP = 0.0580.009 magnitudes. As it can be seen in Fig. 4, those values are compatible with the observed distributions in and for the NGSL sample if one discards the negative-values tail.
I have obtained a precise cross-calibration between Tycho-2 photometry and HST spectrophotometry which, combined with the independent absolute flux calibrations of both instruments, should allow for accurate comparisons between Tycho-2 photometry and synthetic photometry generated from SED models. Furthermore, the use of the zero points presented here should also allow combinations of Tycho-2 photometry with that of other surveys with precise zero points, such as 2MASS (Cohen et al., 2003).
References
- Bessell (2000) Bessell, M. S. 2000, PASP, 112, 961
- Bessell et al. (1998) Bessell, M. S., Castelli, F., & Plez, B. 1998, A&A, 333, 231
- Bohlin (2000) Bohlin, R. C. 2000, AJ, 120, 437
- Bohlin et al. (1995) Bohlin, R. C., Colina, L., & Finley, D. S. 1995, AJ, 110, 1316
- Bohlin et al. (2001) Bohlin, R. C., Dickinson, M. E., & Calzetti, D. 2001, AJ, 122, 2118
- Bohlin & Gilliland (2004) Bohlin, R. C., & Gilliland, R. L. 2004, AJ, 127, 3508
- Bohlin & Goudfrooij (2003) Bohlin, R. C., & Goudfrooij, P. 2003, STIS Instrument Science Report 2001-003 (STScI: Baltimore)
- Cohen et al. (2003) Cohen, M., Wheaton, W. A., & Megeath, S. T. 2003, AJ, 126, 1090
- Colina & Bohlin (1994) Colina, L., & Bohlin, R. C. 1994, AJ, 108, 1931
- De Marchi et al. (2004) De Marchi, G., Sirianni, M., Gilliland, R., Bohlin, R., Pavlovsky, C., Jee, M. Mack, J., van der Marel, R., & Boffi, F. 2004, ACS Instrument Science Report 2004-008 (STScI: Baltimore)
- ESA (1997) ESA. 1997, The Hipparcos and Tycho Catalogues (ESA SP-1200)
- Gregg et al. (2004) Gregg, M. D., Silva, D., Rayner, J., Valdes, F., Worthey, G., Pickles, A., Rose, J. A., Vacca, W., & Carney, B. 2004, American Astronomical Society Meeting Abstracts, 205
- Høg et al. (2000a) Høg, E., Fabricius, C., Makarov, V. V., Bastian, U., Schwekendiek, P., Wicenec, A., Urban, S., Corbin, T., & Wycoff, G. 2000a, A&A, 357, 367
- Høg et al. (2000b) Høg, E., Fabricius, C., Makarov, V. V., Urban, S., Corbin, T., Wycoff, G., Bastian, U., Schwekendiek, P., & Wicenec, A. 2000b, A&A, 355, L27
- Maíz-Apellániz (2004) Maíz-Apellániz, J. 2004, PASP, 116, 859
- STScI (1998) STScI. 1998, Synphot User’s Guide, Howard Bushouse and Bernie Simon (eds.)
- STScI (2005) —. 2005, STIS Instrument Handbook, J. Maíz Apellániz and J. Kim (eds.)