The Vega Debris Disk – A Surprise from Spitzer11affiliation: Based on observations with NASA Spitzer Space Telescope, which is operated by the Jet Propulsion Laboratory, California Institute of Technology under NASA contract 1407.
Abstract
We present high spatial resolution mid- and far-infrared images of the Vega debris disk obtained with the Multiband Imaging Photometer for Spitzer (MIPS). The disk is well resolved and its angular size is much larger than found previously. The radius of the disk is at least 43″ (330 AU), 70″ (543 AU), and 105″ (815 AU) in extent at 24, 70 and 160 , respectively. The disk images are circular, smooth and without clumpiness at all three wavelengths. The radial surface brightness profiles follow radial power laws of or , and imply an inner boundary at a radius of 11″2″ (86 AU). Assuming an amalgam of amorphous silicate and carbonaceous grains, the disk can be modeled as an axially symmetric and geometrically thin disk, viewed face-on, with the surface particle number density following an inverse radial power law. The disk radiometric properties are consistent with a range of models using grains of sizes 1 to 50 . The exact minimum and maximum grain size limits depend on the adopted grain composition. However, all these models require a surface number density profile and a total mass of 31.510-3 in grains. We find that a ring, containing grains larger than 180 and at radii of 86-200 AU from the star, can reproduce the observed 850 flux, while its emission does not violate the observed MIPS profiles. This ring could be associated with a population of larger asteroidal bodies analogous to our own Kuiper Belt. Cascades of collisions starting with encounters among these large bodies in the ring produce the small debris that is blown outward by radiation pressure to much larger distances where we detect its thermal emission. The relatively short lifetime ( years) of these small grains and the observed total mass, 310-3 , set a lower limit on the dust production rate, 1015 g/s. This rate would require a very massive asteroidal reservoir for the dust to be produced in a steady state throughout Vega’s life. Instead, we suggest that the disk we imaged is ephemeral and that we are witnessing the aftermath of a large and relatively recent collisional event, and subsequent collisional cascade.
Subject headings:
circumstellar matter – infrared: stars – planetary systems – stars: individual (Vega)1. Introduction
Vega ( Lyrae = HD 172167 = HR 7001, A0 V, d=7.76 pc) has been used both as a fundamental photometric standard and as a template for modeling of stellar atmospheres. One of the highlights of the IRAS mission was the discovery of a large infrared excess around Vega, which was observed originally as a photometric standard. The far infrared emission was attributed to thermal dust emission from a disk of debris orbiting the star (Aumann et al., 1984). Subsequent IRAS observations of other main sequence stars in the solar neighborhood found that nearly 15% of them exhibit infrared excesses (Backman & Paresce, 1993; Mannings & Barlow, 1998).
The dust found around these main sequence stars cannot be primordial material left over from the star forming stage because the time scale to remove primordial material (10 Myr) is short compared to the lifetimes of these stars (for example, Vega is estimated as 350 Myr old, Barrado y Navascues 1998; Song et al. 2000). Therefore, the dust must be re-supplied. Second-generation dust in such systems is thought to arise primarily from collisions between planetesimals and from cometary activity. Ground- and space-based observations of the nearest subsample of Vega-like stars from optical to submillimeter wavelengths have revealed disk-like structures — debris disks — with density gaps and enhancements (Holland et al., 1998; Greaves et al., 1998; Koerner, Sargent, & Ostroff, 2001; Wilner et al., 2002; Weinberger et al., 2002; Clampin et al., 2003). Debris disks are the most visible signposts of other planetary systems, representing indirect evidence of planetary system formation. We can learn about the diversity of planetary systems from the study of debris disk structures. Vega is one of the closer and brighter debris disks, which provides us an opportunity to study it in detail spatially, as a foundation for understanding other debris disks.
Harvey, Wilking, & Joy (1984) observed Vega at 47 and 95 with the Kuiper Airborne Observatory and inferred that the source of infrared emission may be as large as 23″ in radius. Van der Bliek, Prusti, & Waters (1994) re-analyzed the IRAS data and found that the IRAS 60 emission from Vega is 18″3″ in radius. They also suggested that the emission at 60 is caused by small dust grains with size between 0.1 and 10 . Infrared Space Observatory (ISO) observations show a smooth, resolved, face-on disk with a radius of 22″2″ at 60 , and 36″3″ at 90 (Heinrichsen, Walker, & Klaas, 1998). Mauron & Dole (1998) attempted to detect Vega’s disk through optical scattered light by using linear photopolarimetry. Their upper limit implies that the debris around Vega contains a very small number of 0.01-0.3 grains. Zuckerman & Becklin (1993) detected emission by dust from Vega at 800 and suggested the presence of 100-300 grains to account for the submillimeter observations.
The 850 map of Vega obtained by Holland et al. (1998) with the Submillimeter Common-User Bolometer Array (SCUBA) on the James Clerk Maxwell Telescope shows an extended, roughly circular structure with dimensions of 24″21″(2″). The 850 resolved emission is not uniformly distributed; instead, there is an elongated bright central region oriented northeast-southwest with a bright peak offset 9″ (70 AU) to the northeast of the star’s position. Observations at 1.3 mm obtained by Koerner, Sargent, & Ostroff (2001) and by Wilner et al. (2002) resolved dust emission peaks offset from the star by 8″ to 14″ that appear to be associated with a ring of emission at a radius of 60 to 95 AU.
Here we present the first high spatial resolution 24, 70 and 160 images of Vega obtained with the Spitzer Space Telescope (Werner et al., 2004). The sensitivity and resolution of Spitzer allow us to detect fainter and more extended emission in the Vega debris disk system than was known previously. Details about observations, data reduction, and stellar photosphere subtraction are presented in §2. The resolved images are discussed in §3. The true nature of the disk can be revealed by studying the radial profiles of the disk, which are presented in §4, with interpretations of disk temperature structures and masses in §5. The origin of the debris we detected with Spitzer is discussed in §6, followed by our conclusions in §7.
2. Observations, Data Reduction, and Photospheric Subtractions
Vega was imaged on 11 April 2004 with the Multiband Imaging Photometer for Spitzer (MIPS; Rieke et al. 2004a). Multiple dithered 3 sec exposures were obtained using the 24, 70 (both coarse and fine scales), and 160 channels. Details about the observations are listed in Table 1 along with the combined sensitivity at each band.
The data were processed using the MIPS instrument team Data Analysis Tool (DAT; Gordon et al. 2004a, b) for basic reduction (dark subtraction, flat fielding/illumination correction). In addition, the 24 images were processed to remove a vertical “jail-bar” pattern caused by the bright saturated central star. Due to the known transient behaviors associated with the 70 detectors, a detector dependent structure in the coarse scale mode data was removed by subtracting column averages from each exposure with the source region masked. Similar artifacts were taken out in the 70 fine mode data by subtracting the off-source chopped background observations. The processed exposures were then mosaicked together.
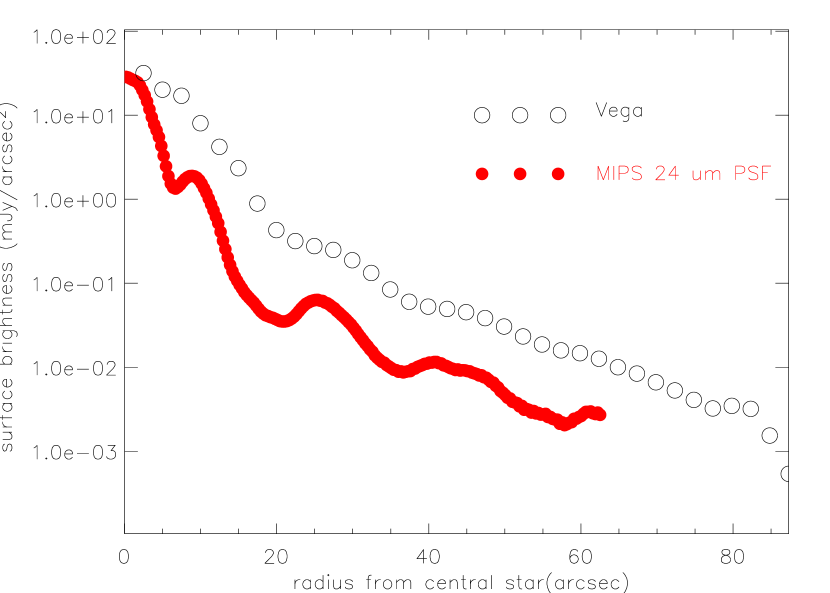
The Vega disk at 24 is tenuous compared to the very bright photosphere (7.4 Jy). The existence of a very low surface brightness disk is best illustrated by examining the radial profile (Figure 1). Relative to the observed Point Spread Function (PSF) scaled to Vega’s photospheric level, the observed radial profile lies consistently above the scaled point source profile. The contrast between the bright and dark Airy rings in the image of Vega is much lower, implying the brightness of the dark Airy rings has been filled in by a low surface brightness, extended component.
Vega’s photosphere contributes a significant fraction of the flux near the center of our images at both 24 and 70 , while the emission from Vega’s debris disk dominates most of the flux at 160 . To study the emission from Vega’s debris disk the photospheric contributions have to be removed in all three channels. To remove Vega’s photosphere, we subtracted reference observed PSFs, scaled to Vega’s photospheric flux, from our images. Changing the PSF scaling factor by more than 10% resulted in artifacts in the subtracted images at the position of the core of the PSF and/or at the positions of the Airy minima and maxima. We conclude that our photospheric removal is accurate to 10% within any given resolution element in the resulting photosphere-subtracted images.
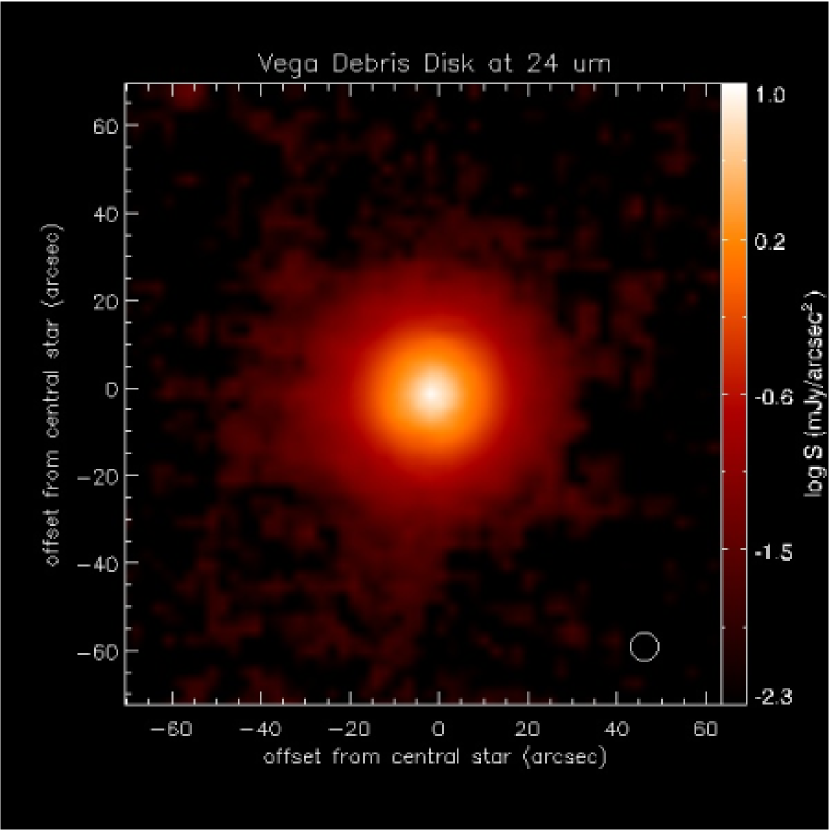
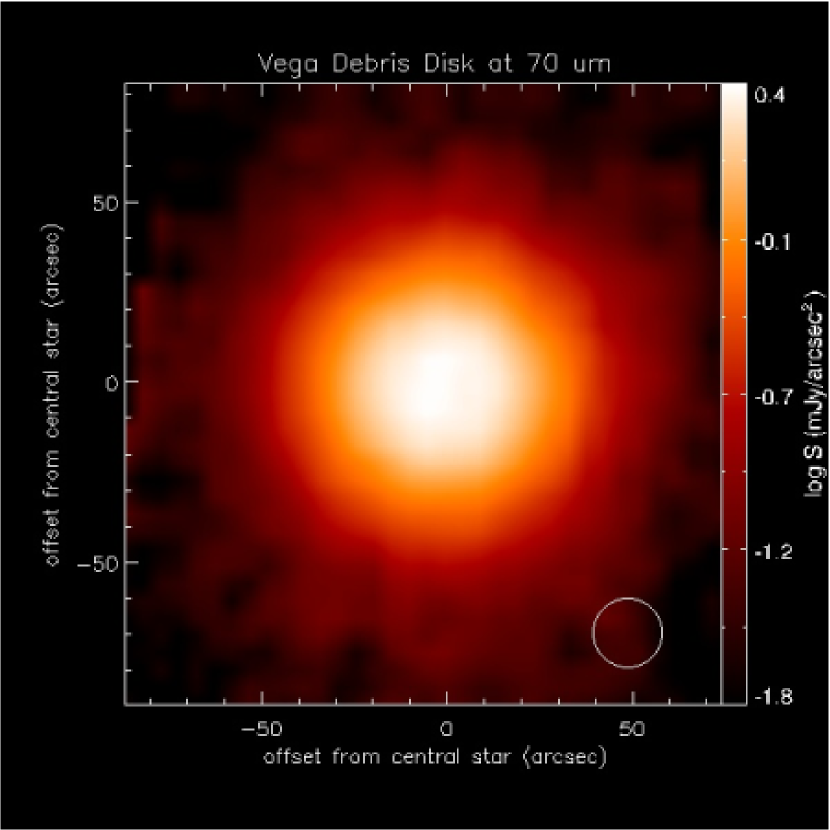
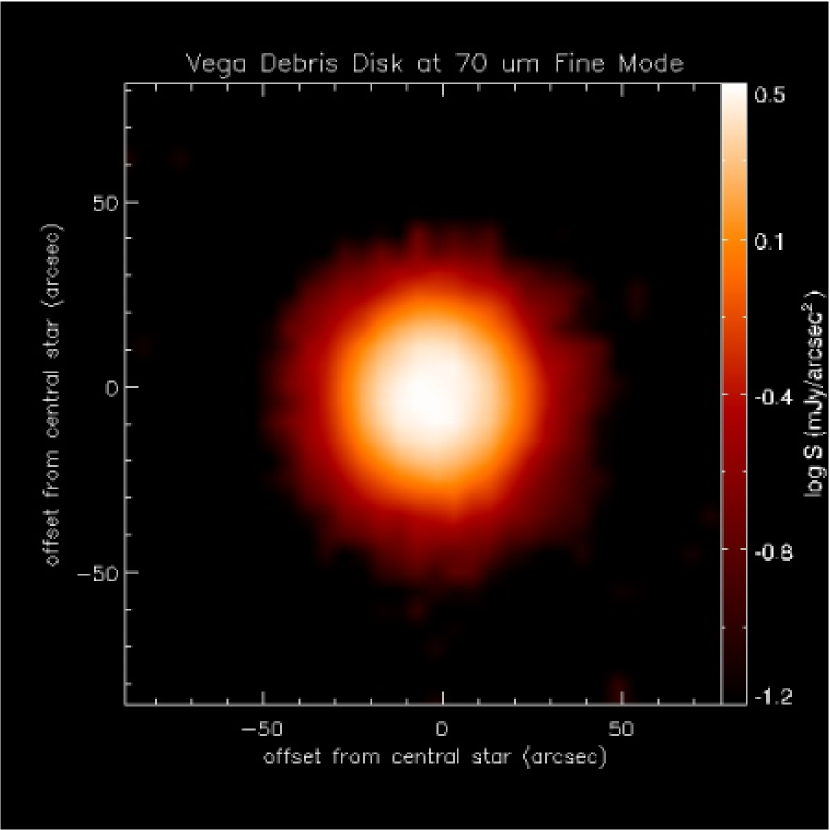
At 24 we processed the data for a PSF reference star (HD 217382) in exactly the same way as we did for Vega. Because the central pixel in the Vega images was saturated, registering the reference PSF to the Vega image was difficult. We took advantage of image latents present in both data sets to do the registration and photosphere subtraction on a frame-by-frame basis. We then mosaicked the resulting images to produce the final 24 image of Vega’s disk, shown in Figure 2. The mosaic does not show any saturation artifact at the center because of the sub-pixel dithers used in the observation: a pixel that was saturated in one image is partially overlapped by unsaturated neighboring pixels in an image from a different dither position. There were enough dither positions to provide partial coverage even at Vega’s position in the final mosaic. Because of this in-filling of the saturated area, the effective exposure time in the central 6″ is about half of that elsewhere. Photospheric removal at 70 was more straight forward. We registered the scaled reference PSF mosaic (HD 48915) to the Vega mosaic by centroiding, and subtracted. The results are shown in Figure 3a (coarse scale) and 3b (fine scale).
The MIPS 160 array suffers from a spectral leak caused by an internal reflection in the optical train allowing leakage from very blue and bright Rayleigh-Jeans sources to contaminate the signals at 160 . However, the spectral leak image is offset to one side of the true 160 image, and the brightness of the leak is proportional to the photospheric flux. Comparison of 160 images of stellar (blue) sources with images of asteroids shows that the near-infrared leak contributes very little to the 160 images on the opposite side of the source location. The predicted flux for Vega’s photosphere is 162 mJy, which is much fainter than the expected disk brightness at 160 . We took advantage of this situation by using only the half of the 160 image where the leak contribution is negligible. We also subtracted a scaled (red) 160 reference PSF (asteroid Harmonia) from the Vega mosaic, using the pointing information (accurate to 1″) to register. The result is shown in Figure 4.
3. Disk Morphologies at 24, 70 and 160
We define our observed sensitivity based on the 1- background noise per pixel using blank sky area in the image. The 1- background noise in the PSF-subtracted image is 11 Jy/arcsec2 at 24 . The disk at 24 is symmetric and centered at the star position; no obvious asymmetry is seen in the image. At the 1- level, the 24 disk extends to 43″ (330 AU) in radius. The total flux density (within the 1- contour) is 1.5 Jy 11110% including errors in absolute flux calibration, and in color correction (less than 5% for a blackbody temperature of 95 K)..
This flux density value is in agreement with the IRAS 25 measurement. The quoted IRAS 25 flux density for Vega is 10.5 Jy (combining IRAS PSC and FSC). Based on Kurucz models, Vega’s photosphere is 6.63 Jy at 25 . The relation between the IRAS quoted flux and actual flux is , where is the color correction factor. The color correction factor is 1.41 for T = 9750 K blackbody (Vega photosphere) and 0.83 for T = 95 K (debris disk as determined by previous studies), suggesting that the actual flux from the disk is 1.4 Jy at 25 .
Vega’s disk looks very similar in both 70 images. The fine scale data were taken in 12 dithered positions with sub-pixel offsets to provide a good spatial sampling for the disk. There is no obvious clumpy structure in the fine scale image. Similar to the disk image at 24 , the disk at 70 appears symmetric and smooth. At a 1- detection limit, the outermost boundary of the disk at 70 (coarse scale mode) is 70″ (543 AU) in radius. The total flux (within the 1- contour) is 7 Jy ().
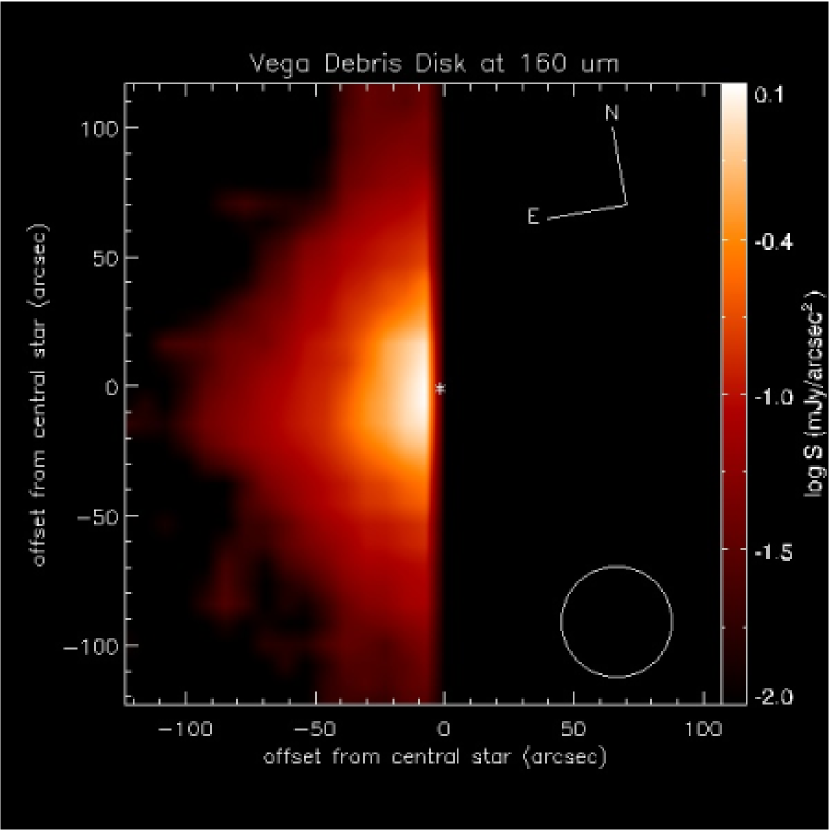
Assuming, based on the 24 and 70 morphology, that the disk is also azimuthally symmetric at 160 , we are able to determine that the outermost extent of the disk at 160 is 105″ (815 AU) in radius (1-). Assuming the bad side of the disk image (affected by the leak) has similar flux as the good side, the total flux from the disk at 160 (within the 1- contour) is 4 Jy .
Within the resolution errors, the disk image is circular at all wavelengths, suggesting a face-on disk. This behavior is consistent with Vega being a pole-on star (Gulliver, Hill, & Adelman, 1994). Based on previous studies (IRAS, ISO and SCUBA), the spectral energy distribution (SED) of the disk can be characterized as a blackbody of T = 95 K with a emissivity. The fluxes measured by MIPS match the previously observed SED within 15%.
A striking immediate result from the MIPS images is the physical size of the Vega disk. Submillimeter and millimeter observations show a low surface brightness ring with radius 11″, much smaller than the emission seen in the MIPS bands. In contrast, MIPS images of the Fomalhaut debris disk (Stapelfeldt et al., 2004) indicate that the submillimeter and far-infrared morphologies agree well. A second surprise is the presence of material warm enough to be detected in the MIPS bands at a large distance from the star. Artymowicz & Clampin (1997) estimated the size of the disk if the grains are blown out by radiation pressure, and suggested that the disk could be up to a few thousand AU, consistent with our images.
4. The Surface Brightness Radial Distribution
4.1. At 24
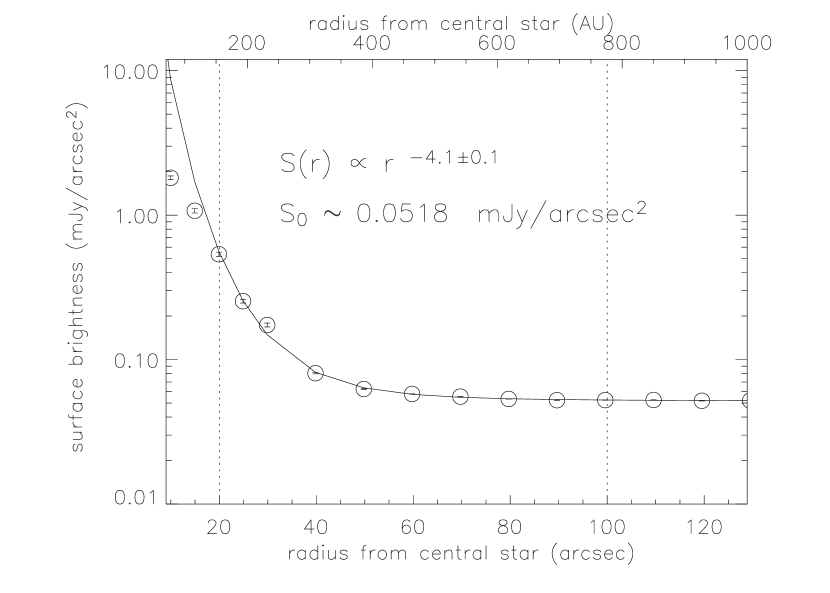
Because the disk is almost perfectly face-on, its extent can be best shown in an azimuthally averaged radial intensity profile. The advantage of using radial profiles is that the noise is reduced by , where N is the total number of pixels used in averaging the intensity at a given radius. The radial surface brightness profile of the disk at 24 is shown in Figure 5. A bin size of 25 (1 pixel) was used to calculate the average brightness at a given radius r when 40″, but a bin size of 10″ (4 pixels) was used when 40″ to increase the signal-to-noise, up to 250″ ( 4′) from the star. A power law plus a constant background () was used to fit the data points between 22″ and 150″ to determine the true sky background () and the flux radial dependence. A power index of 4.10.1 is indicated, based on a least-squares fit.
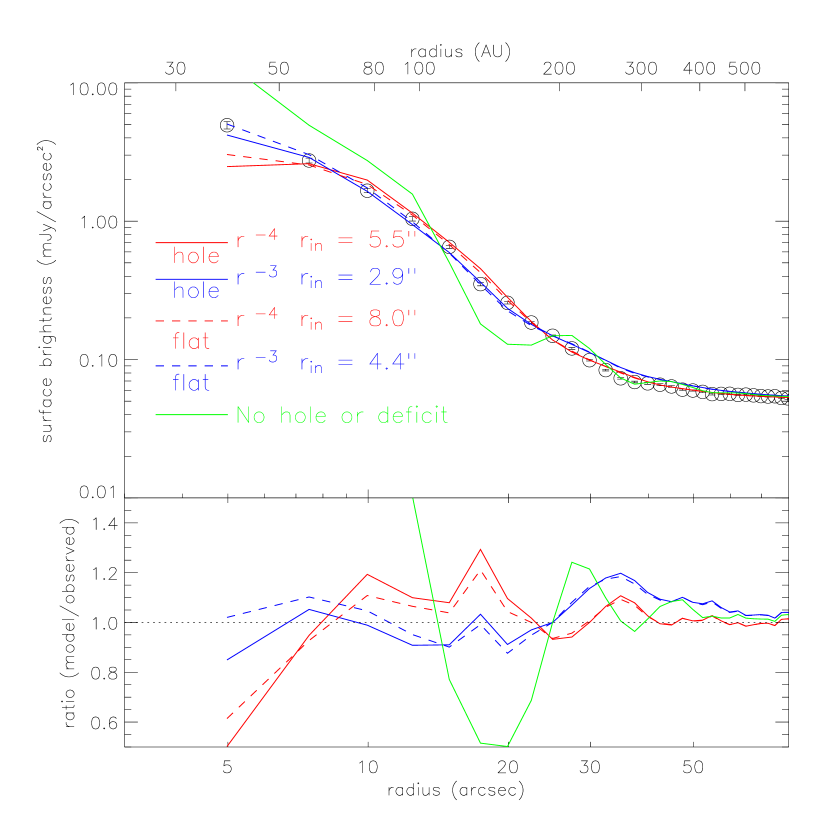
The dashed lines on Figure 5 mark the data range for the power law fitting. The power index of 4.1 fits fairly well for the disk surface brightness when 200 AU, but deviates significantly when 150 AU. To understand the inner structure of the disk, we first compute a disk model with a surface brightness distribution and then convolve the model disk with the 24 PSF. With a rapid power law fall-off (4), the radial profile of the convolved model disk (shown as a green solid line in Figure 6) is similar to the point source PSF, which was not seen in the observed data. This comparison suggests the surface brightness distribution must flatten or go to zero (a real physical empty hole) in the inner part of the disk.
We first investigated the possibility of a real empty hole in the surface brightness distribution. By adjusting power-law indices and inner hole sizes, we are able to reproduce the observed radial profile using two different models. Model A, which is with an inner disk hole () at 5.5″ with an error of 7% at 90% confidence level (shown as a red solid line in Figure 6), fits very well when 200 AU as expected. Model B, which is with = 2.9″ with an error of 17% (shown as a blue solid line in Figure 6), fits very well when 200 AU, but has slightly higher surface brightness at 200 AU compared to the power law. The lower panel of Figure 6 shows the ratio between the model and observed radial profiles.
We have shown that a real empty hole in the surface brightness profile can fit the data well. Next we investigated the possibility of a flat surface brightness distribution in the inner part of the disk. Assuming the surface brightness is constant, ), when , rather than zero in the empty hole case, we found two models that can fit the observed profile. Model A’, which is with an = 8.0″ with an error of 5% (shown as a red dashed line in Figure 6), fits very well when 200 AU. Model B’, which is with = 4.4″ with an error of 14% (shown as a blue dashed line in Figure 6), fits very well when 200 AU, but has slightly higher surface brightness at 200 AU compared to the power law. The deficit in the flat surface brightness distribution is very large (99%) when compared to the extrapolation of the steep power law to the disk center. The difference between an empty hole and a flat distribution in terms of surface brightness is insignificant. For 200 AU, Model A and A’ provide a good fit to the data whereas Model B and B’ match the data well for 200 AU. The most important conclusion from these fittings is that the disk surface brightness distribution follows simple power-law dependences, implying that the disk density structure is simple and smooth.
4.2. At 70
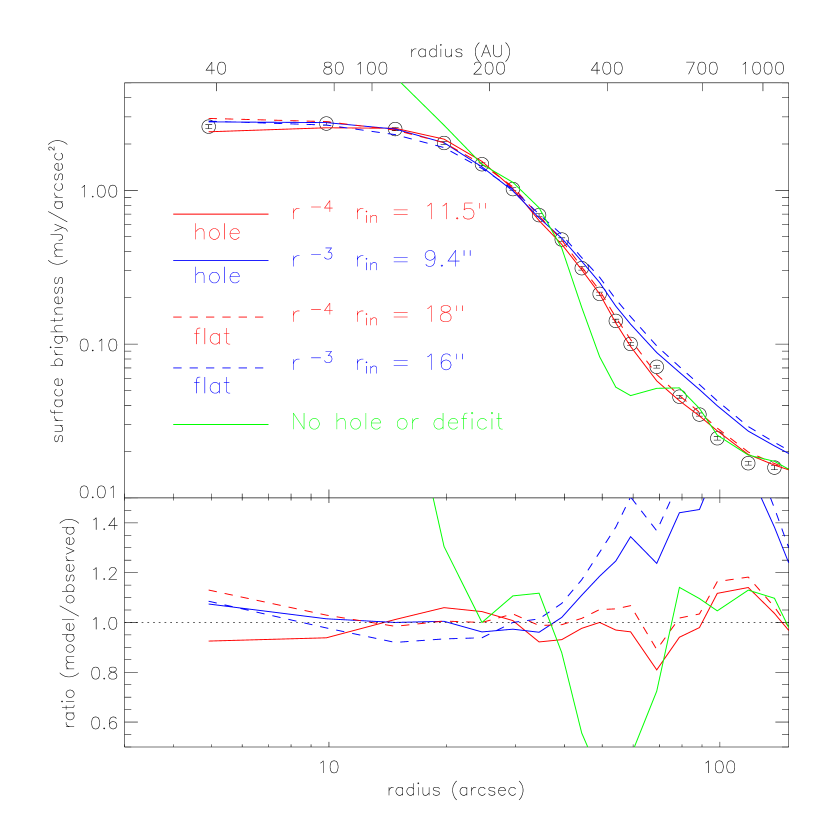
The 70 radial profile of the Vega disk was computed using an average of the data from both observing modes for 40″, but only the coarse scale mode data when 40″. The combined radial profile is shown in Figure 7. Fitting with a power law plus a constant background function, , the surface brightness of the disk shows a power law for 200 AU with a very small error in the index. Similar approaches to those pursued at 24 (hole or flat distribution) were used to fit the inner part of the radial profile at 70 . The results are shown in Figure 8. For an empty hole in the surface brightness distribution, Model A gives a = 11.5″ with an error of 5% and Model B give a = 9.4″ with an error of 7%. For a flat distribution, Model A’ gives a = 18″ with an error of 6% and Model B’ gives a = 16″ with an error of 6%, and the deficit is larger than 99% when compared to the extrapolation of the power law to the disk center. For the inner part of the disk ( 350 AU), Model A/A’ and Model B/B’ give similar results, but Model A and A’ give a much better fit for 350 AU.

4.3. [24][70] color distribution
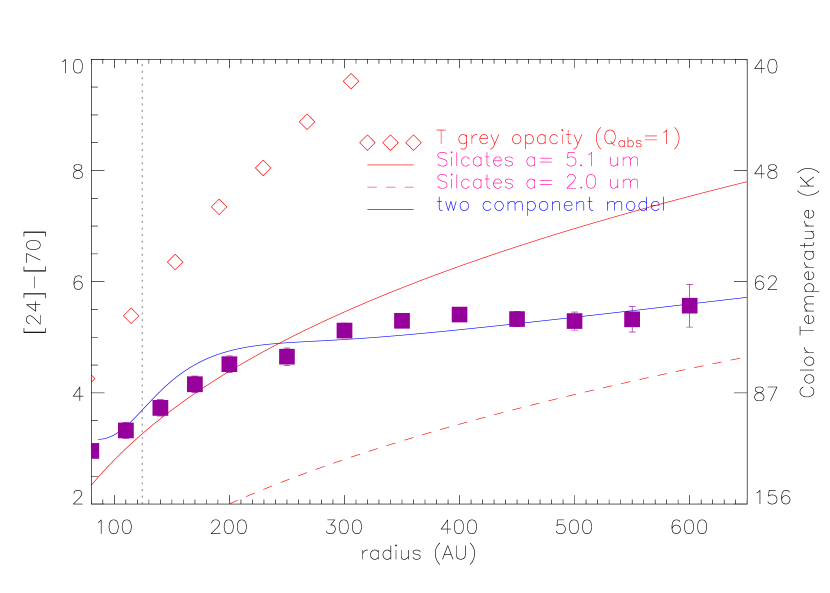
To compare the disk structure between 24 and 70 , we first convolved the 24 disk image with a Gaussion kernel to match the 70 resolution. The radially dependent [24][70] color is estimated at a given radius from the star by computing the flux ratio between 70 and 24 . The resultant radial color distribution is shown in Figure 9. The [24][70] color initially increases (color temperature decreases) with distance from the star, but levels off between 300 and 600 AU (with a color temperature of 67 K). For comparison, we also overplot the expected color from the canonical temperature distribution, with and for Vega, assuming spherical blackbody radiators (i.e., absorption efficiency 1).
We compute the radial color values for single-size silicates assuming the grains are heated only by stellar radiation and emit in an optically thin case (for details, see section 5). As shown in Figure 9, the [24][70] color in the inner part ( 200 AU) of the disk is consistent with the emission from single-size silicates with radius 5.1 . Furthermore, a disk with only 2 grains does not reproduce the observed color distribution at all. The temperature structure of the disk cannot be easily explained by thermal emission from a disk composed of single-size grains. To produce the observed [24][70] color, additional components must be invoked.
4.4. At 160
Since the disk is bright and extended at 160 , we were able to extract a disk radial profile based on the good half of the disk image. To verify our 160 radial profile is legitimate we also extracted radial profiles of a true (no leak) 160 source (asteroid Harmonia) and a calibration star (HD 3712, K0IIIa) only using the good half of the image. We found that the radial profiles extracted only from the good half the images look similar, suggesting the good half of the image is not affected by the leak.
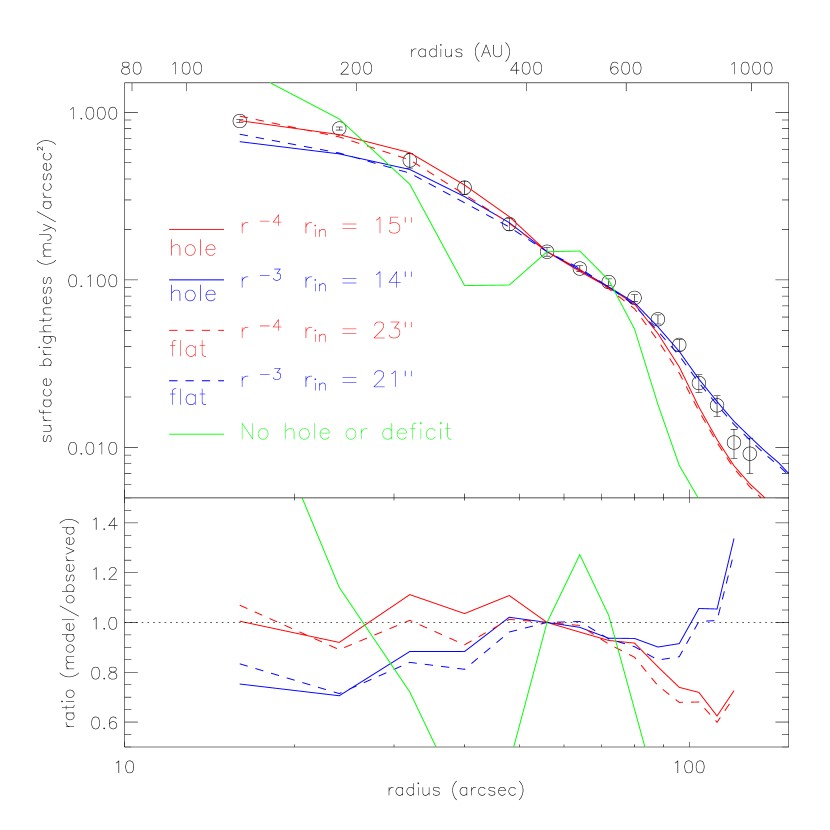
The Vega disk radial profile at 160 is shown in Figure 10 after background subtraction. Similar approaches (hole or flat distribution) were used to fit the radial profile. The results are: Model A (hole, r-4) gives a = 15″; Model A’ (flat, r-4) gives a = 23″; Model B (hole, r-3) gives a = 14″; Model B’ (flat, ) give a = 21″. The errors in these model fits are on the order of 30%. Again, the deficit in the flat distribution is greater than 99% when compared to the extrapolation of the steep power law to the disk center.
4.5. Summary
The surface brightness distribution at the 24 band agrees with a radial-dependent power law with index of 3 (inner part) or 4 (outer part). At 70 , the power law fits better than the in the outer part of the disk. In addition, this radial-dependent power law cannot apply all the way to the star; a hole or a flat distribution in the disk is required. The inner edge of the power-law surface brightness distribution depends on whether the central region contains no flux or a constant non-zero flux. In the latter case, the inner disk radius is 50% larger. However, the current data are not adequate to distinguish between a empty hole and a flat non-zero central flux deficit. Therefore, the inner boundary of the disk is determined as a weighted average of these radii obtained from different fits in all three bands. We conclude that the inner boundary of the Vega debris disk has a radius of 11″2″ (or 8616 AU). The “hole” is not required to be physically empty; rather it is a region lacking material that emits strongly at 24, 70, and 160 . Interestingly, the radius of the 11″2″ hole is about the same size as the 850 (and mm-wave) ring. This implies that the material we detect in the MIPS bands might originate from the submillimeter ring (large parent bodies) where collisional grinding generates small debris that is blown out by radiation pressure to the distances where we detect their emission.
5. Disk Structure and Mass
For particles moving in a steady-state flow, the mass gain/loss rate through any annulus is expected to be constant. If the particles are moving at their terminal velocities ( const.), the surface number density () is expected to be proportional to due to mass conservation ( const.). Therefore, for a radiation pressure driven outflow, the surface particle number density should follow an inverse radial power law if the particles have reached their terminal velocities. In §5.1, we will show the Vega debris disk is well modeled with an surface number density power law.
5.1. Preferred Model
We assume that the disk is axially symmetric and geometrically thin, viewed face-on, and that the surface number density is governed by a simple radial power law; i.e., where is the inner radius of the disk. Based on results in §4, we set 86 AU and simplify the disk inside as a physically empty space. The emission from grains at a given radius and wavelength can be written as
| (1) |
where is the distance to Vega and is the total number of grains of a given radius between and .
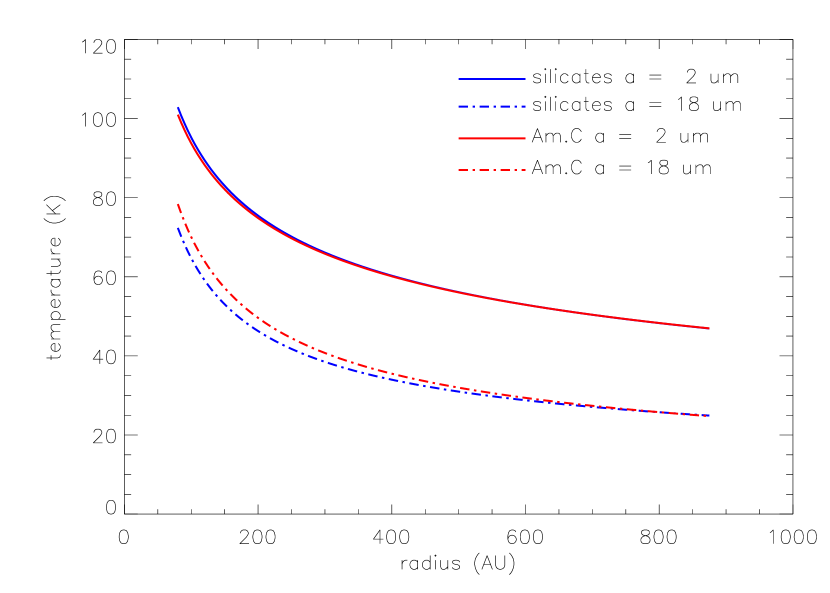
To probe the nature of the Vega disk further, we have fitted it with models including realistic grain optical properties. A dust grain temperature for a given set of grain parameters (composition, grain radius , i.e. ) at a given wavelength () and location from the star (), can be computed assuming the dust is only heated by the star. We use the photospheric flux from the Kurucz model for Vega as the input radiation field. The absorption coefficient is calculated with Mie theory, using the optical constants for astronomical silicates (= 3.5 g/cm3, Laor & Draine 1993). The grain temperatures at different radii from the star, , shown in Figure 11, are computed based on balancing the energy between the absorption and emission by the dust grains (scattering can be ignored for the wavelengths of interest).
The total flux from an annulus ( to ) by integrating Equ. (1) is
| (2) |
If the annulus is small enough (i.e., ), the flux can be written as
| (3) |
The surface brightness distribution, , is the total flux divided by the annulus area, i.e.,
| (4) |
Equ. (4) can be used to qualitatively evaluate the expected power index in the surface number density. For a given wavelength and set of grain properties, the observed surface brightness, , is proportional to . In general, the temperature, , is proportional to for small grains, or for large grains. Using the temperature distribution for silicate grains with 2 , the Planck function at 24 basically follows in the inner part of the disk, but in the outer part of the disk. In other words, if the observed 24 flux is dominated by the emission from small grains, a 1 power index for the surface density distribution is preferred based on the fits in §4 ( for inner disk but for outer disk).
For proper comparison to the observed surface brightnesses (after subtraction of the true sky background determined from the fits in §4), the modeled surface brightness profile using Equ. (4) is then convolved with smoothed theoretical PSFs222The observed PSFs are found to match well with smoothed theoretical STinyTim PSFs. If the object is well resolved compared to the instrument beam, convolving with a gaussian with a FWHM equal to the instrumental resolution is sufficient. However, if the object is not very well resolved, convolving with a gaussian will not match the observed data since MIPS PSFs are not gaussian-like especially at 160 . to match the observed resolutions: 6″, 18″ and 40″ for 24, 70 and 160 , respectively. All the fittings shown below are restricted to the data points between 100 to 700 AU where high signal-to-noise data are available. We first attempted to fit the radial profiles using a single grain size, but could not obtain a reasonable fit simultaneously for all three wavelengths. In fact, the [24][70] color indicates that the disk is composed of a hot component that emits efficiently at 24 ; while the comparable disk size at 70 and 160 indicates that the disk is also composed of a cold component that emits efficiently at longer wavelengths.
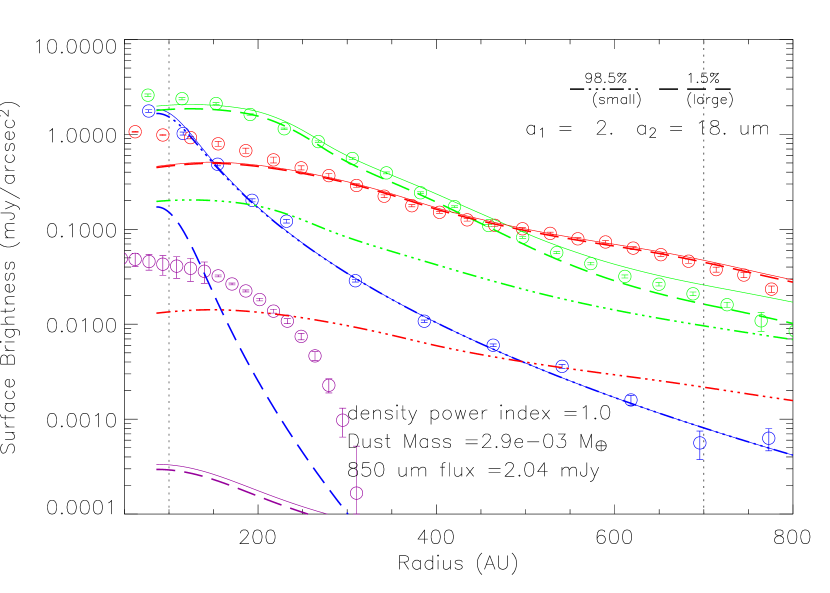
We are able to find a reasonable fit for all three radial profiles by assuming the disk has an inverse radial surface density distribution (), and is composed of grains with sizes: = 2 and 18 , with the former size accounting for 98.5% of the disk particles by number. The fits are shown in Figure 12. Assuming the disk extends to 1000 AU, the total mass of the material that emits at 24, 70 and 160 is 2.910-3 , with 92% of the mass from the large grain component. However, the contributions of the small and large components to the total grain surface area are comparable. Note that the poor quality of the fit at the central part of the 160 profile is not sensitive to variation of the model parameters. The deficit at the central 160 model profile might suggest the existence of a unresolved cold component close to the star. To further constrain these parameters and estimate their uncertainties, we searched large regions of parameter space, computing a statistic at each point. The search covered the following four-dimensional hypervolume: for the surface density power index, , we searched from 0.5 to 3.0 with an interval of 0.1; for the number fraction of the small grains (), we searched from 10% to 99.9% with logarithmic spacing; for the grain size in the component 1 (small grains, ) and component 2 (large grains, ), we searched from 0.3 to 52 with logarithmic spacing. At 90% confidence, we conclude that , %, , and . The total mass estimated from the fitting is not well constrained (2.910) since the mass estimate is very sensitive to the specific size of the large component.
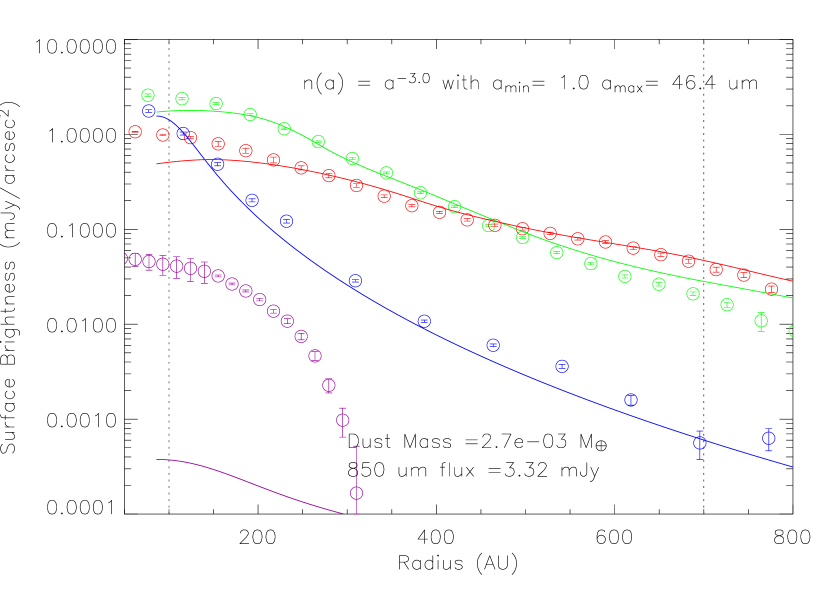
We also fit the radial profiles using a grain size distribution, , with minimum and maximum size cut-offs, and . The parameter space searched for the best fit encompassed values of ranging from -1.0 to -4.0, from 0.5 to 3.0 , and from 10 to 60 . We fixed the surface number density index, , at 1 because we found that the model profiles drop too quickly for 1 in the previous two-component fitting. At the 90% confidence level, we found a best fit with 0.5, , and . The best fit is shown in Figure 13. With these parameters, the total dust mass detected by MIPS is 2.81.110-3 .
Our two-size and power-law distribution models both fit the surface brightness profiles well at all three MIPS bands and can be used to predict the surface brightness profiles at 850 . The modeled 850 profile is shown as a purple line in Figures 12 and 13, after convolution with a Gaussian beam-size of 16″. For comparison, the reprocessed 1998 SCUBA archival data are also plotted as purple open circles after subtracting a 5 mJy point source (representing the stellar photosphere) and smoothing with an additional Gaussian beam-size of 7″. The total modeled flux emitted at 850 based on the two models is less than 3.5 mJy, much lower than what was found in the SCUBA data, 918 mJy (Holland et al., 2005).
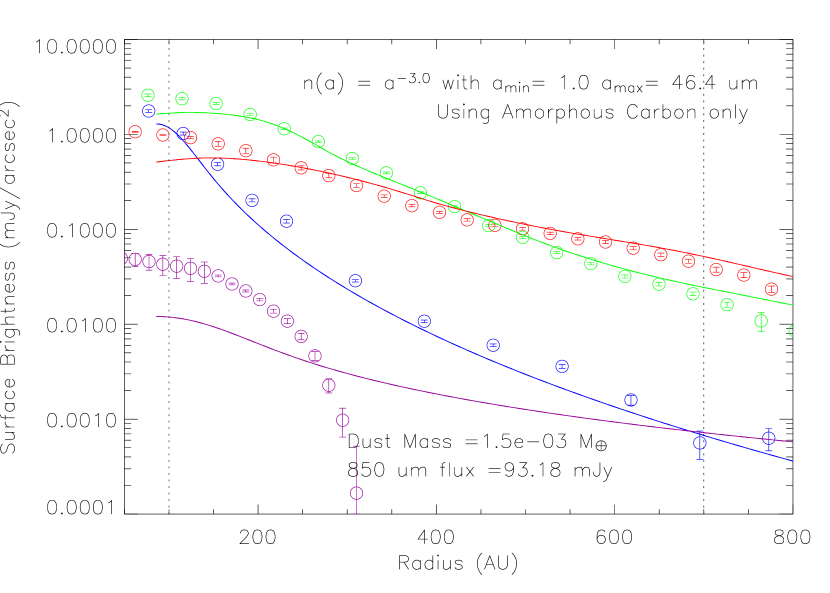
To test the sensitivity of the model fits to the assumption of astronomical silicates, we also fit the radial profiles using amorphous carbon grains ( 1.85 g/cm3, Zubko et al. 1996). Similar to the silicate grains, a temperature distribution is computed for each of the grain sizes. Without changing the grain size distribution, a satisfactory fit is automatically obtained at all three MIPS wavelengths (Figure 14). This is because the resultant temperature distributions in this environment are very similar between silicates and amorphous carbons (Figure 11). The total mass required to fit the MIPS data is 1.510-3 , 1.9 times lower than the silicate grains due to the reduced grain density in amorphous carbon. However, we rule out the possibility that the disk contains solely amorphous carbon as in that case the emission at 850 would extend well beyond the observed SCUBA emission.
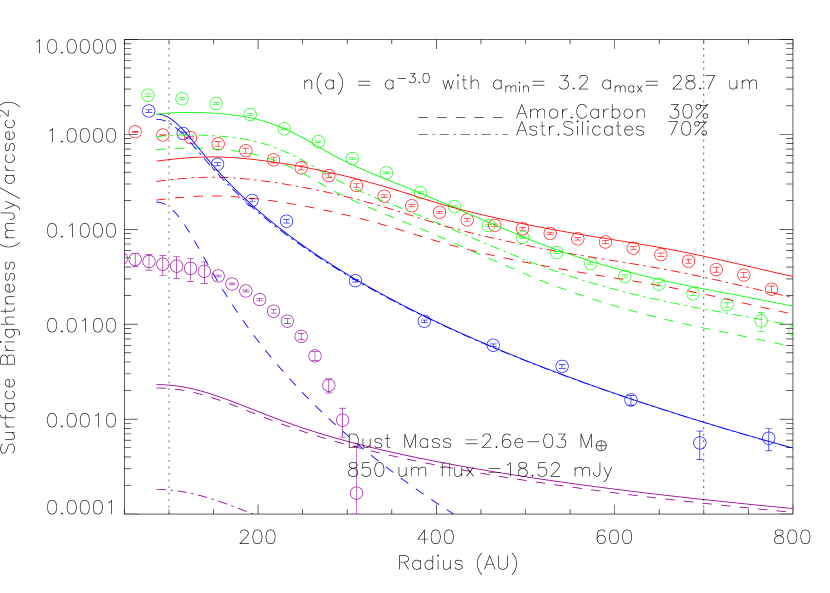
A mixture of silicate and carbon grains is probably a more realistic dust grain model since both silicate and carbonaceous materials have been found in the Solar System. Without spectral features to identify grain composition, we simply assume that the particles in the disk consist of 70% silicates and 30% amorphous carbon grains. The best fit of this admixture model is displayed in Figure 15 with a grain size distribution and a minimum size cut-off 3.20.8 and a maximum size cut-off 2914 . The derived total mass in the disk is 2.610 with 18% from the amorphous carbon grains. The total emission at 850 is 19 mJy assuming an aperture of 90″.
The independence of total mass on grain size distribution can be understood as a consequence of the drop in emission efficiency in proportion to the grain radius for grains much smaller than the wavelength; i.e., when (Rayleigh limit). As a result of this effect, the radiation goes as surface area times radius, or as . The number of grains required for a given surface brightness is therefore proportional to . The mass of a grain goes as volume, or . Therefore, the product of the required number of grains and the mass per grain is roughly independent of grain size. For grains with , the total mass of grains required to produce a given radiometric signature is roughly independent of . Hence, the system mass derived from the MIPS data is insensitive to the specifics of the grain model. Since the temperature distributions for silicate and amorphous carbon grains are similar, hereafter we assume a pure silicate composition for our disk model, for simplicity.
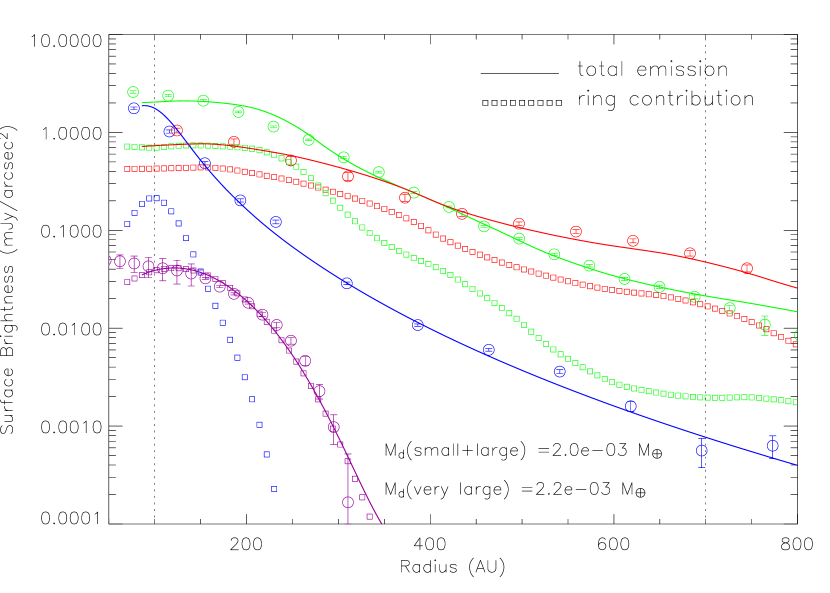
Our modeled flux at 850 is 4-45 times lower than what was found in the SCUBA data. This implies that a third component is needed to account for the 850 emission. We believe MIPS is seeing small grains blown out by radiation pressure while SCUBA is seeing larger grains that are gravitationally bound to the star and could be the grinding source of the small grains. The MIPS and SCUBA observations are then distinctly different grain populations. To further test this scenario, we assume a ring structure in the disk, containing silicate grains with 215 . We do not try to model the ring’s physical structure; instead we only try to find a structure where its resultant emission profile is consistent with the 850 profile and does not violate the 24, 70 and 160 profiles. We achieved a fit with a ring structure that has a constant density from 86 to 100 AU, and drops as from 100 AU to a cut-off radius of 200 AU. The radial profiles for this three-component model are shown in Figure 16. In this model, the 24 profile is dominated by the small (2 ) grain population in the disk. The 70 profile, while dominated by emission from the large (18 ) grains in the disk, has a significant contribution (200 AU from the star) from the very large (215 ) grains in the ring. Within this radius, the 215 grains contribute 30% of the total emission. At 160 , the large grains in the disk and the very large grains in the ring contribute roughly equal amounts of emission.
Having single-size grains in the ring is not mandatory. For silicate grains, we found that the modeled 24, 70 and 160 radial profiles remain unchanged for grains with size larger than 180 since 1 for very large grains and their corresponding temperature structure given the same heating source is similar (the canonical temperature distribution). Therefore, the total mass in the ring only changes by a factor of since the emission goes as the grain surface area (). Due to the uncertainty in the absorption coefficient in the submillimeter regime (Hildebrand, 1983; Pollack et al., 1994), we do not try to constrain the particle size distribution in the ring. The mass in the ring is at least a few tenths of a lunar mass (on order of ), consistent with the previous submillimeter measurements (Zuckerman & Becklin, 1993; Holland et al., 1998).
5.2. Stochastic Grain Heating
The relatively constant [24][70] color temperature with radius suggests an alternative class of model in which tiny grains are heated stochastically by absorbing a single photon from the star. Stochastic heating occurs when the assumption that the temperature of a grain is determined by time-averages of the absorption and emission rates breaks down. This can occur when the the time interval between the absorption of photons with energies comparable to or larger than the grain heat capacity is much longer than the grain cooling timescale, a condition that can be realized in very small grains ( a few hundred Å). To test the hypothesis of stochastic heating in the Vega system, we have computed the complete time evolution of grain temperature (eg., Krügel 2003) for small grains exposed to the radiation environment of Vega. We have chosen a distance of 600 AU, characteristic of the debris disk extent, for the calculation.
For grains less than about 50 Å, the cooling timescale was computed to be of order a few hundred seconds. For grains between 30-50 Å, the absorption time scale varies from a few tens of seconds down to a fraction of a second in Vega’s radiation field. With the heating time scale much less than the cooling timescale, the temperature distributions are very strongly peaked near the equilibrium temperature and the emission from such grains can be very well described as an equilibrium process at a single temperature. Of course, any grain larger than 50 Å will also satisfy the assumptions of equilibrium heating. At 20 Å, the heating timescale has lengthened so that larger temperature fluctuations are observed and the temperature distribution of the grain has a significant hot tail. However, the emission from the grain is still very similar to that expected from an equilibrium process. In order to observe significant radiometric effects of stochastic heating in the Vega environment, grains of sizes 15 Å are required. In this small regime, the heating timescales are of order 102 seconds and the grain will be stochastically heated.
A large number 10 Å grains (which absorb inefficiently in the optical and near UV) would be required to absorb sufficient energy from Vega to account for the infrared excess. As an illustration, we carry out a rough order-of-magnitude estimate. We assume that the grain absorption efficiency for a given wavelength of light goes as the geometric cross section times the ratio of grain radius to wavelength. Then, typical stochastically heated 10 Å grains will have absorption efficiencies well below 1% of the geometric cross sections (this estimate is confirmed with real grain optical properties). If we put the grains at a typical distance of 600 AU, and assume a density of 3 g/cm3, then we find that the mass of very small grains required to absorb the fractional luminosity of the star that is re-emitted in the infrared is within an order of magnitude of the mass required in grains in our preferred fit using large grains. It is not clear how to create the necessary numbers of such tiny grains without producing substantial numbers of larger ones that would have a strong effect on the radiometric properties of the system. In addition, Artymowicz (1988) has calculated the effects of radiation pressure on such small grains around an A star and finds, because their absorption cross sections for stellar photons are very small, that they may not be ejected from the system by radiation pressure. Thus, the radial extent of the Vega system might be difficult to explain with tiny grains. The upper limit to the polarization of the debris system obtained by Mauron & Dole (1998) also argues strongly against a system dominated by very small grains. It therefore is unlikely that a disk dominated by a population of small stochastically heated grains can explain all of the available Vega observations; nor is it necessary to invoke such a population as our preferred model fit using large grains is fully consistent with the observations.
5.3. Summary of the Modeling
A range of models using amorphous silicate and/or carbon grains of sizes from 1 to 50 can fit the infrared radiometric behavior of the disk out to 800 AU. The exact minimum and maximum grain size limits depend on the adopted grain composition. However, all these models require a surface number density and a total mass of 3.010 in grains. Models that also fit the submillimeter data additionally require an inner ring (near 100 AU) with largr grains (180 ) and a total mass 10.
6. The Origin of the Debris
One might propose that the dust we see at 100-800 AU is produced in situ from a highly extended Kuiper Belt around Vega. Given that Vega is 2.5 times as massive as the Sun, it is plausible that it could have a more extended population of such objects than does the solar system. Following simple mass scaling and assuming a similar surface density of large bodies in the disks, Vega’s Kuiper belt would extend only about 1.6 times farther than the Sun’s (45-55 AU). If Vega’s Kuiper belt extended to 500 AU, its mass would be over 100 times that of the Sun’s Kuiper Belt (100). This mass, and the implied extent, seem implausible. Further, the distribution of dust that would result from in situ production in such an extended Kuiper Belt almost certainly would not replicate the smooth surface brightness distribution we observe. We therefore disregard the hypothesis that the debris disk around Vega originates from an extended Kuiper Belt.
The radial symmetry of the Vega disk strongly suggests the star system itself as the source of the dust. If the dust were of interstellar origin, it seems likely that it would be inhomogeneously distributed around the star. Also, Artymowicz & Clampin (1997) show that the avoidance distance around Vega (the distance at which small grains would be repelled by radiation pressure), is 3600 AU; therefore, small interstellar grains would not be present where we see the dust, inside about 1000 AU. Further, the radial density distribution of the dust is consistent with that expected from dust being ejected by radiation pressure. The debris we detect with MIPS is unlikely of interstellar origin.
The large extent and the radial and azimuthal distributions of Vega’s disk are all consistent with a model in which the dust originates at a distance 100 AU from Vega, and is blown out to larger radii by radiation pressure. A further consequence of this model, as will be shown below, is that the dust we are seeing in the Spitzer data originated in an event that took place in the relatively recent past. These conclusions do not apply to the larger particles in the ring structure around Vega, which are seen in the submillimeter but have much less contribution to the flux in the MIPS bands.
The grain-sizes we deduce from our model fits to the data, ranging from 1 to 50 , are consistent with their being pushed out of the system by radiation pressure, if we assume the larger grains have significant porosity or are highly non-spherical. The ratio of the radiation force to the gravitational force on a grain is parameterized by , where is the stellar luminosity, is the radiation pressure efficiency of the grain averaged over the stellar spectrum (1 when 1 , Artymowicz & Clampin 1997), is the gravitational constant, is the stellar mass, is speed of light (Burns, Lamy, & Soter, 1979). For , radiation pressure will drive the particle out of the system; for , the particle will spiral into the star due to Poynting-Robertson (P-R) drag. We adopt = 3.5 g/cm3 for solid “astronomical silicate” grains. Using and for Vega, we find = 1.95 and 0.22. The “small” grains in our model will be ejected, while the “large” grains will spiral in under the influence of P-R drag. In order to explain the presence of the larger ( 20 ) silicate grains at large distances from Vega, we require their density to be reduced significantly. They may be aggregates of smaller grains, have significant porosity, or be highly non-spherical. It is also possible that the smaller ( 2) grains are under-dense, but that is not required to explain their presence at such large distances.
Aggregate grains are seen in our own solar system (e.g., cometary dust and zodiacal dust, Grün et al. 2001), and are a natural consequence of growth through coagulation in the early Solar Nebula (Kimura, Okamoto, & Mukai, 2002). Radiation pressure depends not only on the size and material of the dust grains, but also on their shapes and structures. Porosity certainly can decrease the bulk density , therefore increasing the value. In order for = 18 grains to have , their porosity has to be greater than 0.56 (or g/, which is not unreasonable). If our large grains are very non-spherical (plates, needles), they could also be ejected by radiation pressure (see Il’In & Voshchinnikov 1998, for example).
Particles escaping under the influence of radiation pressure are lost from the system on timescales of order the orbital period in the source region (Krivov, Mann, & Krivova, 2000). Considerations of energy conservation lead to the conclusion that such particles reach a terminal radial velocity given by , where is the distance where the grain is released or produced (Moro-Martin & Malhotra, 2005). This implies velocities for the escaping particles (assuming 1) in Vega’s disk in excess of 5 km/s, if the source region is around 100 AU, consistent with the location of the submillimeter dust ring. The residence time for the particles is roughly years for a disk radius of 1000 AU. Clearly, if the dust we are seeing in the Spitzer images is being blown out by radiation pressure, the individual dust grains are of recent origin.
For our hypothetical very large grains (180 ) in the inner ring at 86-200 AU that are seen in the submillimeter data, we find that 0.02, implying very long residence times in that region. They therefore could be the source for the dust we see at much larger distances, or could be associated with a population of larger asteroidal bodies analogous to our own Kuiper Belt, which could be the ultimate source of the dust at large distances. Cascades of collisions starting with encounters between these larger bodies in this ring could produce the small grains that are blown out by radiation pressure force.
The short residence time for small grains (50 ), combined with the dust mass we derived in section 5 (see Figures 13-16), places a lower limit on the dust production rate in the Vega system. Taking the dust mass in small grains to be and a residence time of 1000 years, the required dust production rate is 61014 g/s. Lisse et al. (1999) estimate an overall dust production rate of 2 g/s for the Comet Hale-Bopp. If the dust is generated by cometary activity, the Vega debris disk requires 3 million Hale-Bopp-like comets to account for the dust production rate, which is impossibly high. If we further assume that dust loss and production have been in approximate balance over the life of the Vega system (350 My), we find that the mass of the dust lost over that time is 3.3 . This is a lower limit as we have assumed the longest plausible residence time, and limited the calculation to only those small grains we are sensitive to; presumably there are other grains lost to P-R drag in the inner part of the disk. Further, to produce 3.3 worth of dust, a much larger mass of parent bodies would have to be present in the disk. Assuming a power law size distribution proportional to , where is the radius (see Dohnanyi 1969), the mass of the parent bodies would be two to three orders of magnitude greater, implying a total mass of 330-3300 (or 0.3-3 ) for Vega’s debris disk.
It seems very implausible to have an initial inventory of 330-3300 of dust when Vega was born. Only a fraction of the initial disk mass is presumably incorporated into asteroids; most of it could have been sequestered in giant planets, accreted onto the star, or ejected from the system. Besides, debris disks do not form as solid material only; they start out as massive protoplanetary disks, with 100 times as much gas mass as dust. The disk masses of Herbig Ae/Be stars (what Vega would appear as, when first formed) are on the order of a few tenths of a M☉, measured in the millimeter continuum (Hillenbrand et al., 1992; Mannings & Sargent, 1997). It is very unlikely that this high dust production rate is in a steady state throughout Vega’s life.
The above arguments suggest that the disk we imaged with Spitzer is ephemeral. Such a disk could be produced as the result of the disruption of a large asteroidal or cometary body and subsequent collisional cascade as pieces of the disrupted body collide with other bodies in the source region. The dust mass we observe, 3.0, would form an object 1000 km in radius (the size of Pluto) if collected together. Such a large object is unlikely to undergo a disruptive collision (e.g. Kenyon & Bromley 2004). We hypothesize instead that a more modest sized object was disrupted, and the ensuing collisional cascade, interacting with the background population of asteroidal objects, produced the observed dust. Small bodies were probably the ultimate source of most of the dust mass, although regolith ejection from larger bodies (Kortenkamp & Dermott, 1998) could also have contributed significantly. Thus we favor a scenario in which the dust we observe is young because it is being blown out of the system by radiation pressure, but was produced over some finite interval of time, consistent with a collisional cascade subsequent to a large disruptive collision. This scenario is also consistent with the results of Rieke et al. (2005), who find that episodic collisions, and not steady-state production, best explain dust seen around a large sample of A stars.
7. Conclusion
We have presented images of the Vega debris disk at 24, 70 and 160 obtained by MIPS. The disk is well resolved with 1- detection radii of 43″, 70″, and 105″ at 24, 70 and 160 , respectively. The disk appears circular and smooth at all three wavelengths. No clumpy structure was found. The surface brightness of the disk follows a simple (inner disk) or (outer disk) power law at all three wavelengths, implying the disk density structure is simple and smooth. A region lacking material that emits efficiently at MIPS wavelengths, was inferred at a radius of 11″2″ from a radial profile analysis.
We investigated the nature of the Vega disk with model fitting. We found that an axially symmetric, face-on disk with surface number density can explain the observed radial profiles at all three wavelengths simultaneously. The observed radial profiles can be well reproduced with a two-component grain model consisting of a mixture of small ( 1.3-2.7 ) and large ( 12-30 ) silicate grains with the former size accounting for 98% of the particles in number. The observed radial profile can also be reproduced with a power-law grain size distribution, with a minimum size cut-off 0.7-2.3 and maximum size cut-off 35-57 . The minimum and maximum grain sizes in the disk are constrained by the requirement that the model simultaneously reproduce the 24, 70, and 160 radial profiles.
Silicate and carbonaceous grains have very similar radial temperature profiles in the radiation environment around Vega. Therefore, while the size distribution is well constrained by the surface brightness profiles, the grain composition is not. While the composition of the dust grains in the disk is unknown, it is fully consistent with a mixture of silicate and carbonaceous dust. Regardless of the exact composition, the total mass of the dust seen by MIPS is 3.010-3 assuming an outer radius of 1000 AU.
The total flux at 850 emitted by the grains required to fit the MIPS data is much less than what was measured in the SCUBA data. Another dust component is needed to account for the emission at 850 . Emission from a ring composed of grains larger than 180 can account for the observed 850 profile, while their contribution in the MIPS wavelengths does not change the disk model profiles.
The ring-like structure in our disk model represents a reservoir for gravitationally bound planetesimals, where collisions can occur and generate small dust grains as debris. The dust production rate implied by our observations, 1015 g/s, would require this asteroidal reservoir to be improbably massive, were the disk we observe with Spitzer in a steady state. We conclude that the disk is ephemeral, the consequence of a large and relatively recent collisional event, and subsequent collisional cascade. Radiation pressure sets the small dust grains produced in these collisions on unbound hyperbolic trajectories and they stream out through the disk and leave the system with a time scale on the order of 1000 yr. The large extent of the disk as seen by MIPS is consistent with the dust being ejected by radiation pressure.
References
- Aumann et al. (1984) Aumann, H. H., et al. 1984, ApJ, 278, L23
- Artymowicz (1988) Artymowicz, P. 1988, ApJ, 335, L79
- Artymowicz & Clampin (1997) Artymowicz, P. & Clampin, M. 1997, ApJ, 490, 863
- Backman & Paresce (1993) Backman, D. E. & Paresce, F. 1993, Protostars and Planets III, 1253
- Barrado y Navascues (1998) Barrado y Navascues, D. 1998, A&A, 339, 831
- Burns, Lamy, & Soter (1979) Burns, J. A., Lamy, P. L., & Soter, S. 1979, Icarus, 40, 1
- Clampin et al. (2003) Clampin, M., et al. 2003, AJ, 126, 385
- Dohnanyi (1969) Dohnanyi, J. S. 1969, J. Geophys. Res., 74, 2431
- Gordon et al. (2004a) Gordon, K. D. et al. 2004a, PASP, submitted.
- Gordon et al. (2004b) Gordon, K. D. et al. 2004b,SPIE , in press.
- Greaves et al. (1998) Greaves, J. S., et al. 1998, ApJ, 506, L133
- Grün et al. (2001) Grün, E., Gustafson, B. S., Dermott, S., & Fechtig, H. 2001, Interplanetary dust, by Eberhard Grün et al. Berlin : Springer
- Gulliver, Hill, & Adelman (1994) Gulliver, A. F., Hill, G., & Adelman, S. J. 1994, ApJ, 429, L81
- Habing et al. (1996) Habing, H. J., et al. 1996, A&A, 315, L233
- Harvey, Wilking, & Joy (1984) Harvey, P. M., Wilking, B. A., & Joy, M. 1984, Nature, 307, 441
- Heinrichsen, Walker, & Klaas (1998) Heinrichsen, I., Walker, H. J., & Klaas, U. 1998, MNRAS, 293, L78
- Hildebrand (1983) Hildebrand, R. H. 1983, QJRAS, 24, 267
- Hillenbrand et al. (1992) Hillenbrand, L. A., Strom, S. E., Vrba, F. J., & Keene, J. 1992, ApJ, 397, 613
- Holland et al. (1998) Holland, W. S., et al. 1998, Nature, 392, 788
- Holland et al. (2005) Holland et al. 2005, in preparation.
- Il’In & Voshchinnikov (1998) Il’In, V. B. & Voshchinnikov, N. V. 1998, A&AS, 128, 187
- Kenyon & Bromley (2004) Kenyon, S. J., & Bromley, B. C. 2004, AJ, 127, 513
- Kimura, Okamoto, & Mukai (2002) Kimura, H., Okamoto, H., & Mukai, T. 2002, Icarus, 157, 349
- Koerner, Sargent, & Ostroff (2001) Koerner, D. W., Sargent, A. I., & Ostroff, N. A. 2001, ApJ, 560, L181
- Kortenkamp & Dermott (1998) Kortenkamp, S. J., & Dermott, S. F. 1998, Science, 280, 874
- Krist et al. (2000) Krist, J. E., Stapelfeldt, K. R., Ménard, F., Padgett, D. L., & Burrows, C. J. 2000, ApJ, 538, 793
- Krivov, Mann, & Krivova (2000) Krivov, A. V., Mann, I., & Krivova, N. A. 2000, A&A, 362, 1127
- Krügel (2003) Krügel, E. 2003, The Physics of Interstellar Dust, Bristol : Institute of Physics Publishing
- Laor & Draine (1993) Laor, A. & Draine, B. T. 1993, ApJ, 402, 441
- Lisse et al. (1999) Lisse, C. M., et al. 1999, Earth Moon and Planets, 78, 251
- Mannings & Barlow (1998) Mannings, V. & Barlow, M. J. 1998, ApJ, 497, 330
- Mannings & Sargent (1997) Mannings, V., & Sargent, A. I. 1997, ApJ, 490, 792
- Mauron & Dole (1998) Mauron, N. & Dole, H. 1998, A&A, 337, 808
- Moro-Martin & Malhotra (2005) Moro-Martin, A., & Malhotra, R. 2005, in preparation.
- Pollack et al. (1994) Pollack, J. B., Hollenbach, D., Beckwith, S., Simonelli, D. P., Roush, T., & Fong, W. 1994, ApJ, 421, 615
- Rieke et al. (2004a) Rieke, G. H., et al. 2004, ApJS, 154, 25
- Rieke et al. (2005) Rieke, G. H., et al. 2005, ApJ, 620, 1010
- Song et al. (2000) Song, I., Caillault, J.-P., Barrado y Navascués, D., Stauffer, J. R., & Randich, S. 2000, ApJ, 533, L41
- Stapelfeldt et al. (2004) Stapelfeldt, K. R., et al. 2004, ApJS, 154, 458
- Van der Bliek, Prusti, & Waters (1994) Van der Bliek, N. S., Prusti, T., & Waters, L. B. F. M. 1994, A&A, 285, 229
- Weinberger et al. (2002) Weinberger, A. J., et al. 2002, ApJ, 566, 409
- Werner et al. (2004) Werner, M. W., et al. 2004, ApJS, 154, 1
- Wilner et al. (2002) Wilner, D. J., Holman, M. J., Kuchner, M. & Ho, P. T. P. 2002, ApJ, 569, L115
- Zubko et al. (1996) Zubko, V. G., Mennella, V., Colangeli, L., & Bussoletti, E. 1996, MNRAS, 282, 1321
- Zuckerman & Becklin (1993) Zuckerman, B. & Becklin, E. E. 1993, ApJ, 414, 793
| Array | Field Size | Pixel Size | Exposure | # of Pos. | Eff. Exp. | 1- per pixel |
|---|---|---|---|---|---|---|
| arcsec | exp x cyc. | sec | mJy/arcsec2 | |||
| A24 | small | 2.55 | 3 s x 1 | 4 | 120126aaThe typical effect exposure time is 63 sec for the central 6″ region due to the saturation. | 0.01 |
| A70F | small | 5.20 | 3 s x 1 | 12 | 132151 | 0.13 |
| A70 | large | 9.98 | 3 s x 8 | 1 | 195255 | 0.04 |
| A160 | large | 1618 | 3 s x 4 | 4 | 3866 | 0.02 |