On the Rotation Period of (90377) Sedna
Abstract
We present precise, , -band relative photometry of the unusual solar system object (90377) Sedna. Our data consist of 143 data points taken over eight nights in October 2004 and January 2005. The RMS variability over the longest contiguous stretch of five nights of data spanning nine days is only . This subset of data alone constrain the amplitude of any long-period variations with period to be . Over the course of any given -hour segment, the data exhibits significant linear trends not seen in a comparison star of similar magnitude, and in a few cases these segments show clear evidence for curvature at the level of a few millimagnitudes per hour2. These properties imply that the rotation period of Sedna is , cannot be , and cannot be , unless the intrinsic light curve has significant and comparable power on multiple timescales, which is unlikely. A sinusoidal fit yields a period of and semi-amplitude of . There are additional acceptable fits with flanking periods separated by , as well as another class of fits with , although these later fits appear less viable based on visual inspection. Our results indicate that the period of Sedna is likely consistent with typical rotation periods of solar system objects, thus obviating the need for a massive companion to slow its rotation.
Subject headings:
Kuiper belt – minor planets, asteroids – Oort cloud – solar system: general1. Introduction
There is increasing evidence for the existence of an extended scattered disk; a massive population of objects orbiting beyond the Kuiper belt (Gladman et al., 2002). These objects have orbits with substantial eccentricities and inclinations and are distinct from Kuiper Belt Objects (KBOs) in that their perihelia are little affected by gravitational perturbations from Neptune. Thus it appears that Neptune cannot be responsible for their unusual orbits, and several novel mechanisms to explain the origin of these object have been proposed (Morbidelli & Levison, 2004; Kenyon & Bromley, 2004; Stern, 2005). The total mass in these objects is poorly known because only a handful of members have been discovered. These include the recently detected object (90377) Sedna (), whose orbit has a semimajor axis of and a perihelion of (Brown et al., 2004a).
Sedna appears to be extreme in several ways in addition to its unusual orbit. It is intrinsically bright, with an absolute magnitude of , implying that it is one of the largest known minor planets. Unpublished reports also indicate that it is quite red, has a relatively high albedo, a weak opposition surge, and has a very long rotation period, with (Brown et al., 2004b). The latter claim is especially interesting in light of the fact that a Hubble Space Telescope snapshot of Sedna revealed no evidence for a large companion that could have tidally decreased Sedna’s rotation period from typical solar system rotation periods of to a longer period of .
Here we present precise relative photometry of Sedna that indicates a rotation period of , and rules out rotation periods longer than , under reasonable assumptions. The rotation period of Sedna is likely within the range of typical solar system objects, obviating the need for a massive companion.
| Date | HJD-2450000. | aaNote that the photometry has an arbitrary zero point which differs for the data taken during UT 2004 Oct 8-9, UT 2004 Oct 16, and UT 2005 Jan 7-15. | Phase Angle (∘) | |
|---|---|---|---|---|
| UT 2004 Oct 8 | 3286.83028 | -0.001 | 0.005 | 0.3759 |
| 3286.84411 | -0.004 | 0.006 | 0.3758 | |
| 3286.84823 | -0.013 | 0.006 | 0.3757 | |
| 3286.85249 | -0.001 | 0.007 | 0.3757 | |
| 3286.85723 | -0.001 | 0.007 | 0.3757 | |
| 3286.86124 | 0.005 | 0.009 | 0.3757 | |
| 3286.86525 | -0.010 | 0.007 | 0.3756 |
Note. — [The complete version of this table is in the electronic edition of the Journal. The printed edition contains only a sample.]

2. Observations and Data Reduction
We observed Sedna over eight nights in October 2004 (UT 2004 Oct 8,9,16) and January 2005 (UT 2005 Jan 7-9,11,15). Photometric data were obtained with the MegaCam CCD camera (McLeod et al., 2000) on the MMT 6.5m telescope. The MegaCam instrument uses 36 2048x4608 CCDs to cover a 24’x24’ field-of-view with a pixel scale of 0.08”. Our primary science goal was to search for small KBOs, but we chose to target the field of Sedna to simultaneously acquire a precise light curve for this unusual object. The results of the KBO search will be presented elsewhere. Conditions during the observations ranged from good to poor, with image FWHMs in the range 0.7-1.9”. All data were taken with a Sloan -band filter with 2x2 image binning. Exposure times were 300-450 seconds. The apparent motion of Sedna during our observations was , so trailing losses are negligible.
The images were further binned and then reduced in the usual manner. Photometry was performed in two ways: using PSF-fitting photometry with the DAOPHOT II package (Stetson, 1987, 1992), and using image-subtraction photometry with the ISIS 2.1 package (Alard & Lupton, 1998; Alard, 2000). For the DAOPHOT reductions, relative photometry of Sedna was derived using 10-50 reference stars.
For moving objects, one must take care to consider background stars or galaxies that may be blended with the target in only a subset of exposures, potentially leading to artificial variability when using PSF-fitting photometry. In fact, during the night of UT 2004 Jan 8, Sedna was blended with a background object that was magnitudes fainter. Image subtraction photometry eliminates any constant, stationary objects, and so removes such contamination. On the other hand, the quality of PSF-fitting photometry can be comparable to image-subtraction photometry for uncontaminated objects in relatively sparse fields. Furthermore, we have found that DAOPHOT can extract reliable measurements from very poor-quality frames, where ISIS fails. Therefore, in order to provide the best possible photometry, we adopted a hybrid approach, combining PSF-fitting photometry for the nights which showed no evidence for contaminating background objects (UT 2004 Oct 8-9,16 and UT 2005 Jan 11), and image-subtraction photometry for the remainder of the nights (UT 2005 Jan 7-9,15). We stress that, for nights with no contamination, the light curves produced by the two methods are completely consistent. We used the DAOPHOT-reported errors for all data, as we judged these to be more reliable than ISIS-reported errors.
Due to Sedna’s proper motion, it was not possible to use the same reference stars or images and thus tie the photometry to the same zero point for the entire dataset. Therefore the data consist of three ‘chunks’, corresponding to data taken on UT 2004 Oct 8-9, UT 2004 Oct 16, and UT 2005 Jan 7-15. Each of these chunks have an independent zero point. Although the relative offset and absolute photometric calibration of these chunks could be determined by various methods, these methods all require additional data. These data are not currently available. We therefore chose to present only relative photometry. This final photometry, consisting of 143 data points, is listed in Table 1, where we have subtracted the error-weighted mean instrumental magnitude from each chunk. We note that the apparent magnitude of Sedna during our observations was approximately .
3. Analysis
Figure 1 shows the light curve for Sedna, where each panel corresponds to a different night. The nights belonging to the three separate chunks are indicated; each chunk has an independent zero point. The solid curve is a sinusoidal model, which is described below.
Several relatively model-independent conclusions can be drawn from the properties of the light curve. First, the RMS deviation during the largest chunk spanning nine nights during UT 2005 Jan 7-15 is only . In addition, these data show no evidence for significant curvature; a simple second-order polynomial fit to the January data yields an upper limit to the coefficient of the quadratic term of . This implies that if the light curve amplitude is large, the rotation period must be long. For example, for a sinusoidal light curve, this corresponds a limit on the semi-amplitude of for large . Second, the data during any given individual night spanning generally have very small RMS deviations. For example, the RMS for the night of UT 2004 Oct 8 is only 0.7%. Nevertheless, several nights show evidence for significant variability that is not seen in a comparison star of similar magnitude. In many cases, this variability is consistent with a simple linear trend, which argues that the period cannot be . However, for a few nights, curvature is evident. For example, a second-order polynomial fit to the UT 2004 Oct 8 data yields a detection of curvature with . Similarly, a fit to the UT 2004 Oct 9 data yields . The detection of significant curvature, the fact that the curvature on adjacent nights has opposite sign, and the fact that the difference in mean magnitudes between adjacent nights is , argue that the period must be . This assumes that the primary power in the intrinsic light curve occurs at only one period. We believe this is a reasonable assumption.
| (hours) | () | (136 dof) | |||||
|---|---|---|---|---|---|---|---|
| 10.273 0.002 | 0.0110.001 | 0.730.12 | 0.20.2 | 1.0040.001 | 1.0150.002 | 0.9700.002 | 150.0 |
| 10.321 0.002 | 0.0100.001 | 5.600.12 | 0.20.2 | 1.0040.001 | 1.0190.003 | 0.9690.002 | 150.0 |
| 17.991 0.006 | 0.0110.002 | 4.430.17 | 0.20.2 | 1.0010.008 | 1.0160.025 | 0.9780.036 | 150.0 |
| 17.845 0.006 | 0.0110.002 | 5.840.16 | 0.20.2 | 1.0020.008 | 1.0110.025 | 0.9770.036 | 150.2 |
| 18.139 0.006 | 0.0100.002 | 3.010.18 | 0.20.2 | 1.0030.008 | 1.0260.025 | 0.9710.036 | 150.9 |
We fit the light curve to the seven-parameter model,
| (1) |
where is the flux at the time of observation , is the phase angle of Sedna at this time, is the coefficient of the phase function111We have assumed a linear phase function. This is appropriate given the relatively small range of phase angles spanned by our dataset (Bowell et al., 1989). See Table 1., is the flux zero point for chunk , and and are the error-weighted mean observation times and phase angles, respectively. Note that we are fitting relative photometry, and thus , , and are dimensionless. In practice, we expand the sinusoidal term in equation (1) into separate sine and cosine terms, and then perform a linear fit in flux to the coefficients of these terms, the phase angle term, and the constant terms. We then reconstruct the more physical parameters and from the coefficients of the sine and cosine terms. This has the advantages that the only non-linear variable that must be fitted is , and errors on the parameters , and can be determined analytically at fixed . We constrain to be within of the range , although the exact form of the contraint has little effect on the results. Note that, aside from the phase angle term, equation (1) is equivalent to a Lomb-Scargle periodogram with a floating mean (Lomb, 1976; Scargle, 1982; Cumming, 2004).
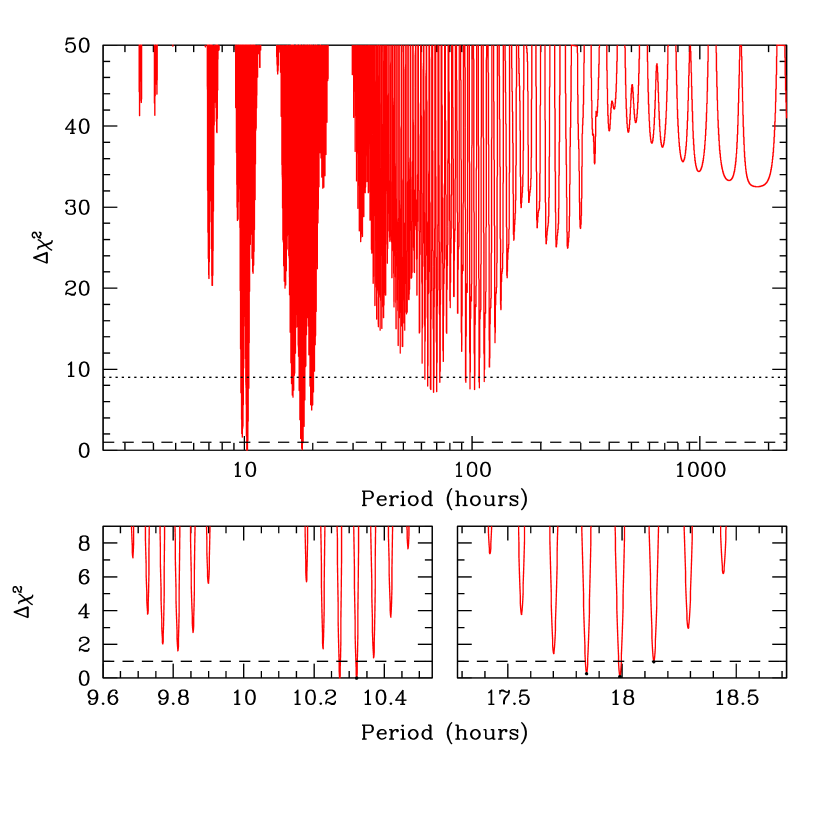
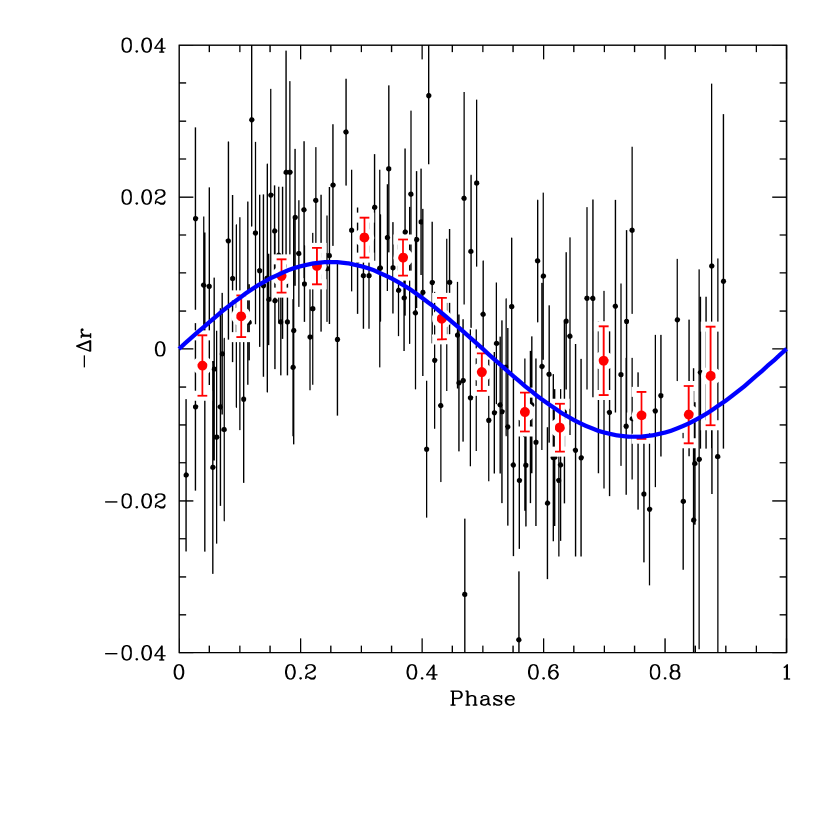
We search for fits in the range , with steps of . The resulting periodogram, here displayed as versus , is shown in Figure 2. The best-fit has for , indicating a good fit. For reference, a constant flux fit to the data yields for . Thus the detection of variability, as judged by the improvement in , is extremely significant. The parameters for the fit are and . The phase angle coefficient is poorly constrained, due to the fact that the separate chunks are not tied together, and thus the time baseline for determining is limited to the day span of our January data. Figure 3 shows the light curve phased to the best-fit period, with the constant flux and phase angle terms subtracted, along with the model fit. The model appears to describe the data reasonably well.
Flanking the best-fit period are additional fits separated by (see Fig. 2); these correspond to fits in which there are one or more additional cycles between the October and January datasets, i.e. where for integer . In addition, there is a cluster of fits that is separated by from the best-fit period. These corresponds to fits in which there is one additional cycle between UT Oct 9 and UT Oct 16. Finally, there are also diurnal aliases near and (and the associated aliases of these aliases). Fits near the latter period are allowed at the level.
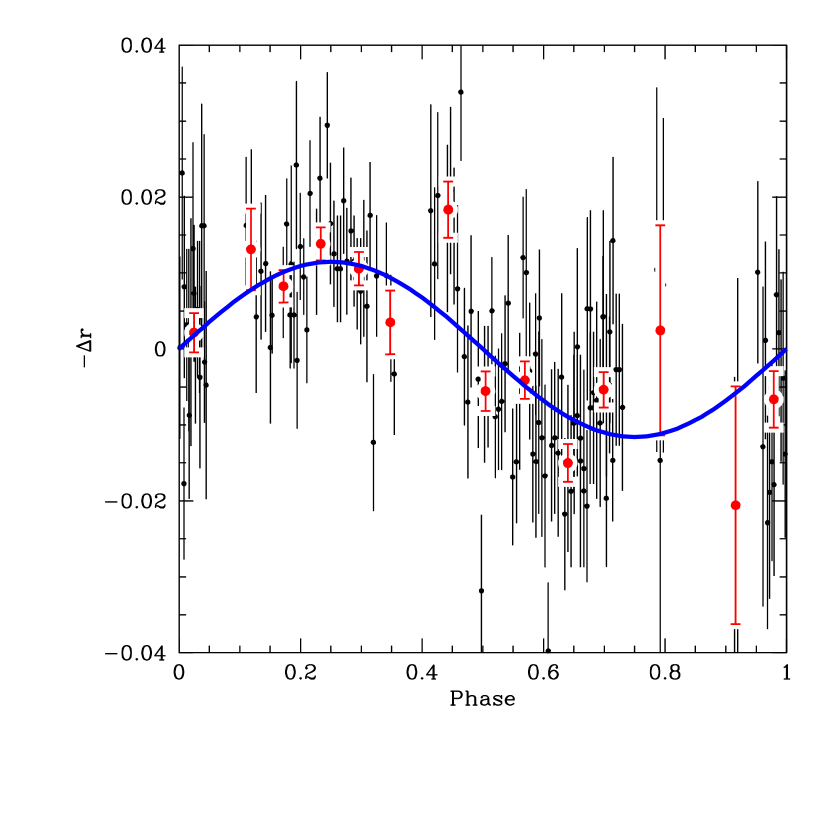
We find a total of five fits that are statistically indistinguishable () from the best fit. The parameters of these fits are given in Table 2. Two of these fits have , and appear equally good by eye. The other three fits have . Although these fits are statistically acceptable, they appear much less convincing upon inspection of the phased light curves, one example of which is shown in Figure 4. The amplitude is relatively constant for all the acceptable fits, with . Models with are ruled out at the level. Refitting the data after subtracting the flux predicted by the best-fit model reveals no significant additional periodicities.
As a sanity check, we repeated the analysis described above on a light curve constructed from comparison stars of similar magnitude as Sedna. We find no evidence for variability at the level exhibited by Sedna. The best fit has an improvement in over a constant flux model of for 4 additional degrees of freedom, with an amplitude of only .
4. Summary and Discussion
We have presented relative photometry of the unusual solar system object Sedna, obtained with the MMT 6.5m telescope over eight nights in two campaigns in October 2004 and January 2005. The light curve during the longest contiguous stretch of nine days has a remarkably small RMS of , and exhibits no significant curvature, which severely constrains the amplitude of any long-term variability to . The light curve during any individual night exhibits significant variability that is not seen in a comparison star of similar brightness. The photometry from several individual nights shows significant curvature over the span of hours.
These properties indicate that the period of Sedna is , and cannot be larger than . A sinusoidal model fit to Sedna yields a best-fit period of and semi-amplitude , with additional acceptable fits with flanking periods separated by , as well as another class of fits with , although these later fits appear less viable based on visual inspection. We note that, if the variability is due to an aspherical shape such as a triaxial ellipsoid, the true rotation period is twice the fitted period. There also exist fits at the diurnal aliases of the primary period with that are marginally acceptable at the level. Fits with or are ruled out at the level. Thus we conclude that the rotation period of Sedna is most likely , although other periods cannot be completely excluded. Additional observations should be pursued to distinguish between the various viable fits found here, and so firmly identify the true rotation period of Sedna. The best-fit rotation period of makes Sedna entirely typical of the bulk of solar system objects, including main-belt asteroids (Pravec & Harris, 2000; Harris, 2002), as well as the dozen KBOs with measured rotation rates (Sheppard & Jewitt, 2002).
We conclude that there is no real evidence that the period of Sedna is extraordinarily long () or even unusual. Therefore there is no compelling reason to invoke a massive companion to spin down Sedna’s rotation period.
References
- Alard (2000) Alard, C. 2000, A&AS, 144, 363
- Alard & Lupton (1998) Alard, C., & Lupton, R. H. 1998, ApJ, 503, 325
- Bowell et al. (1989) Bowell, E., Hapke, B., Domingue, D., Lumme, K., Peltoniemi, J., & Harris, A. W. 1989, Asteroids II, 524
- Brown et al. (2004a) Brown, M. E., Trujillo, C., & Rabinowitz, D. 2004, ApJ, 617, 645
- Brown et al. (2004b) Brown, M. E., Trujillo, C. A., Rabinowitz, D., Stansberry, J., Bertoldi, F., & Koresko, C. D. 2004, DPS, 36,
- Cumming (2004) Cumming, A. 2004, MNRAS, 354, 1165
- Gladman et al. (2002) Gladman, B., Holman, M., Grav, T., Kavelaars, J., Nicholson, P., Aksnes, K., & Petit, J.-M. 2002, Icarus, 157, 269
- Harris (2002) Harris, A. W. 2002, Icarus, 156, 184
- Kenyon & Bromley (2004) Kenyon, S. J., & Bromley, B. C. 2004, Nature, 432, 5
- Lomb (1976) Lomb, N. R. 1976, Ap&SS, 39, 447
- McLeod et al. (2000) McLeod, B. A., Conroy, M., Gauron, T. M., Geary, J. C., & Ordway, M. P. 2000, Further Developments in Scientific Optical Imaging, 11
- Morbidelli & Levison (2004) Morbidelli, A., & Levison, H. F. 2004, AJ, 128, 2564
- Pravec & Harris (2000) Pravec, P., & Harris, A. W. 2000, Icarus, 148, 12
- Scargle (1982) Scargle, J. D. 1982, ApJ, 263, 835
- Sheppard & Jewitt (2002) Sheppard, S. S., & Jewitt, D. C. 2002, AJ, 124, 1757
- Stern (2005) Stern, S. A. 2005, AJ, 129, 526
- Stetson (1987) Stetson, P. B. 1987, PASP, 99 191
- Stetson (1992) Stetson, P. B. 1992, in ASP Conf. Ser. 25, Astrophysical Data Analysis Software and Systems I, ed. D. M. Worrall, C. Bimesderfer, & J. Barnes (San Francisco: ASP), 297
| Date | HJD-2450000. | aaNote that the photometry has an arbitrary zero point which differs for the data taken during UT 2004 Oct 8-9, UT 2004 Oct 16, and UT 2005 Jan 7-15. | Phase Angle (∘) | |
|---|---|---|---|---|
| UT 2004 Oct 8 | 3286.83028 | -0.001 | 0.005 | 0.3759 |
| 3286.84411 | -0.004 | 0.006 | 0.3758 | |
| 3286.84823 | -0.013 | 0.006 | 0.3757 | |
| 3286.85249 | -0.001 | 0.007 | 0.3757 | |
| 3286.85723 | -0.001 | 0.007 | 0.3757 | |
| 3286.86124 | 0.005 | 0.009 | 0.3757 | |
| 3286.86525 | -0.010 | 0.007 | 0.3756 | |
| 3286.86923 | -0.006 | 0.005 | 0.3756 | |
| 3286.87324 | 0.001 | 0.007 | 0.3756 | |
| 3286.87721 | -0.017 | 0.007 | 0.3755 | |
| 3286.88508 | -0.008 | 0.007 | 0.3755 | |
| 3286.88937 | -0.019 | 0.008 | 0.3754 | |
| 3286.89847 | -0.026 | 0.007 | 0.3754 | |
| 3286.90247 | -0.013 | 0.008 | 0.3753 | |
| 3286.90671 | -0.009 | 0.007 | 0.3753 | |
| 3286.91076 | -0.007 | 0.007 | 0.3752 | |
| 3286.91472 | -0.007 | 0.007 | 0.3752 | |
| 3286.91867 | -0.016 | 0.007 | 0.3752 | |
| 3286.92265 | -0.008 | 0.007 | 0.3751 | |
| 3286.92768 | -0.012 | 0.007 | 0.3751 | |
| 3286.93158 | -0.008 | 0.006 | 0.3750 | |
| 3286.93554 | -0.005 | 0.006 | 0.3750 | |
| 3286.93950 | -0.004 | 0.007 | 0.3749 | |
| 3286.94340 | -0.007 | 0.009 | 0.3749 | |
| 3286.94738 | -0.002 | 0.010 | 0.3749 | |
| 3286.95137 | -0.014 | 0.007 | 0.3748 | |
| 3286.95530 | 0.016 | 0.009 | 0.3748 | |
| 3286.95929 | -0.006 | 0.008 | 0.3748 | |
| 3286.97152 | -0.006 | 0.007 | 0.3747 | |
| 3286.97705 | 0.001 | 0.007 | 0.3746 | |
| 3286.98105 | 0.007 | 0.008 | 0.3746 | |
| UT 2004 Oct 9 | 3287.79633 | -0.011 | 0.011 | 0.3676 |
| 3287.80032 | -0.016 | 0.011 | 0.3676 | |
| 3287.80436 | -0.010 | 0.009 | 0.3676 | |
| 3287.80875 | -0.003 | 0.011 | 0.3675 | |
| 3287.81288 | -0.029 | 0.009 | 0.3675 | |
| 3287.81709 | 0.006 | 0.009 | 0.3674 | |
| 3287.82135 | 0.012 | 0.010 | 0.3674 | |
| 3287.82553 | 0.000 | 0.010 | 0.3674 | |
| 3287.83422 | 0.009 | 0.009 | 0.3673 | |
| 3287.83827 | 0.037 | 0.010 | 0.3672 | |
| 3287.84231 | 0.011 | 0.009 | 0.3672 | |
| 3287.84635 | 0.010 | 0.008 | 0.3672 | |
| 3287.85118 | 0.000 | 0.007 | 0.3671 | |
| 3287.85518 | 0.014 | 0.008 | 0.3671 | |
| 3287.85914 | 0.013 | 0.008 | 0.3671 | |
| 3287.86317 | 0.012 | 0.009 | 0.3670 | |
| 3287.86728 | 0.007 | 0.009 | 0.3670 | |
| 3287.87132 | -0.001 | 0.009 | 0.3670 | |
| 3287.87678 | 0.022 | 0.009 | 0.3669 | |
| 3287.88130 | 0.020 | 0.008 | 0.3669 | |
| 3287.88542 | 0.012 | 0.009 | 0.3669 | |
| 3287.88954 | -0.007 | 0.008 | 0.3668 | |
| 3287.89360 | -0.005 | 0.011 | 0.3668 | |
| 3287.89764 | 0.008 | 0.009 | 0.3668 | |
| 3287.90167 | 0.019 | 0.009 | 0.3667 | |
| 3287.90569 | 0.020 | 0.010 | 0.3667 | |
| 3287.90969 | 0.001 | 0.009 | 0.3667 | |
| 3287.95197 | 0.015 | 0.009 | 0.3662 | |
| 3287.95628 | 0.014 | 0.008 | 0.3662 | |
| 3287.96039 | 0.017 | 0.009 | 0.3662 | |
| 3287.96446 | 0.024 | 0.009 | 0.3661 | |
| 3287.96847 | 0.026 | 0.010 | 0.3661 | |
| 3287.97248 | 0.013 | 0.010 | 0.3661 | |
| 3287.97643 | 0.011 | 0.008 | 0.3660 | |
| 3287.98805 | 0.001 | 0.008 | 0.3659 | |
| 3287.99222 | 0.025 | 0.009 | 0.3659 | |
| 3287.99626 | 0.010 | 0.009 | 0.3659 | |
| 3288.00030 | 0.020 | 0.008 | 0.3659 | |
| 3288.00428 | 0.008 | 0.010 | 0.3658 | |
| 3288.00826 | 0.008 | 0.010 | 0.3658 | |
| 3288.01231 | 0.013 | 0.011 | 0.3658 | |
| UT 2004 Oct 16 | 3294.92551 | -0.010 | 0.012 | 0.3049 |
| 3294.93194 | 0.013 | 0.021 | 0.3048 | |
| 3294.93511 | -0.001 | 0.013 | 0.3048 | |
| 3294.93771 | 0.023 | 0.014 | 0.3048 | |
| 3294.94036 | 0.019 | 0.014 | 0.3048 | |
| 3294.94297 | 0.015 | 0.013 | 0.3047 | |
| 3294.94560 | 0.018 | 0.012 | 0.3047 | |
| 3294.94859 | -0.007 | 0.013 | 0.3047 | |
| 3294.95159 | -0.002 | 0.011 | 0.3047 | |
| 3294.95417 | 0.003 | 0.012 | 0.3046 | |
| 3294.95682 | 0.004 | 0.014 | 0.3046 | |
| 3294.95942 | 0.014 | 0.011 | 0.3046 | |
| 3294.96230 | 0.000 | 0.012 | 0.3045 | |
| 3294.96511 | -0.023 | 0.014 | 0.3045 | |
| 3294.96771 | -0.008 | 0.012 | 0.3045 | |
| 3294.97066 | -0.003 | 0.010 | 0.3045 | |
| 3294.97333 | -0.001 | 0.012 | 0.3044 | |
| 3294.97592 | -0.002 | 0.015 | 0.3044 | |
| 3294.97858 | -0.013 | 0.014 | 0.3044 | |
| 3294.98151 | 0.001 | 0.009 | 0.3044 | |
| 3294.98411 | -0.005 | 0.009 | 0.3043 | |
| 3294.98672 | -0.004 | 0.010 | 0.3043 | |
| 3294.98936 | -0.016 | 0.016 | 0.3043 | |
| 3294.99201 | -0.016 | 0.012 | 0.3043 | |
| 3294.99467 | 0.005 | 0.015 | 0.3042 | |
| UT 2005 Jan 7 | 3377.72877 | -0.019 | 0.014 | 0.5415 |
| 3377.73359 | -0.012 | 0.010 | 0.5415 | |
| 3377.73765 | -0.021 | 0.011 | 0.5415 | |
| UT 2005 Jan 8 | 3378.60779 | -0.001 | 0.008 | 0.5463 |
| 3378.61168 | 0.008 | 0.012 | 0.5463 | |
| 3378.61564 | 0.010 | 0.013 | 0.5463 | |
| 3378.61955 | 0.015 | 0.012 | 0.5464 | |
| 3378.62348 | 0.038 | 0.009 | 0.5464 | |
| 3378.62764 | 0.011 | 0.010 | 0.5464 | |
| 3378.63155 | 0.010 | 0.010 | 0.5464 | |
| 3378.63556 | 0.012 | 0.011 | 0.5464 | |
| 3378.63979 | 0.002 | 0.011 | 0.5465 | |
| 3378.64371 | 0.020 | 0.010 | 0.5465 | |
| 3378.64770 | 0.014 | 0.011 | 0.5465 | |
| 3378.65161 | 0.017 | 0.010 | 0.5465 | |
| 3378.65551 | 0.008 | 0.012 | 0.5466 | |
| 3378.65941 | -0.002 | 0.013 | 0.5466 | |
| 3378.66333 | 0.013 | 0.014 | 0.5466 | |
| 3378.66742 | 0.014 | 0.013 | 0.5466 | |
| 3378.67147 | -0.007 | 0.012 | 0.5466 | |
| 3378.67559 | -0.007 | 0.013 | 0.5467 | |
| 3378.67951 | 0.006 | 0.010 | 0.5467 | |
| 3378.68344 | 0.005 | 0.013 | 0.5467 | |
| 3378.68732 | 0.008 | 0.011 | 0.5467 | |
| 3378.69146 | -0.006 | 0.014 | 0.5468 | |
| 3378.69543 | 0.003 | 0.012 | 0.5468 | |
| 3378.69936 | -0.004 | 0.012 | 0.5468 | |
| 3378.70325 | -0.016 | 0.011 | 0.5468 | |
| UT 2005 Jan 9 | 3379.60272 | 0.021 | 0.020 | 0.5517 |
| 3379.60662 | 0.013 | 0.025 | 0.5517 | |
| 3379.67326 | 0.015 | 0.010 | 0.5520 | |
| 3379.67991 | 0.006 | 0.011 | 0.5521 | |
| 3379.68560 | -0.010 | 0.009 | 0.5521 | |
| 3379.69299 | 0.001 | 0.012 | 0.5522 | |
| 3379.69874 | -0.001 | 0.008 | 0.5522 | |
| 3379.75010 | -0.019 | 0.009 | 0.5525 | |
| 3379.75624 | -0.020 | 0.009 | 0.5525 | |
| 3379.76249 | -0.007 | 0.010 | 0.5526 | |
| 3379.76823 | -0.013 | 0.009 | 0.5526 | |
| 3379.77411 | -0.014 | 0.009 | 0.5526 | |
| 3379.77987 | -0.003 | 0.010 | 0.5527 | |
| UT 2005 Jan 11 | 3381.75575 | -0.015 | 0.024 | 0.5629 |
| 3381.75992 | 0.010 | 0.026 | 0.5629 | |
| 3381.76399 | -0.013 | 0.022 | 0.5629 | |
| UT 2005 Jan 15 | 3385.80239 | -0.019 | 0.013 | 0.5817 |
| 3385.80874 | -0.032 | 0.011 | 0.5817 |