The X-Ray Position and Optical Counterpart of the Accretion-Powered Millisecond Pulsar XTE J1814338
Abstract
We report the precise optical and X-ray localization of the 3.2 ms accretion-powered X-ray pulsar XTE J1814338 with data from the Chandra X-Ray Observatory as well as optical observations conducted during the 2003 June discovery outburst. Optical imaging of the field during the outburst of this soft X-ray transient reveals an star at the X-ray position. This star is absent () from an archival 1989 image of the field and brightened during the 2003 outburst, and we therefore identify it as the optical counterpart of XTE J1814338. The best source position derived from optical astrometry is R.A. = 04, Dec.= 33∘46′223 (J2000). The featureless X-ray spectrum of the pulsar in outburst is best fit by an absorbed power-law (with photon index ) plus blackbody (with keV) model, where the blackbody component contributes approximately 10% of the source flux. The optical broad-band spectrum shows evidence for an excess of infrared emission with respect to an X-ray heated accretion disk model, suggesting a significant contribution from the secondary or from a synchrotron-emitting region. A follow-up observation performed when XTE J1814338 was in quiescence reveals no counterpart to a limiting magnitude of . This suggests that the secondary is an M3 V or later-type star, and therefore very unlikely to be responsible for the soft excess, making synchroton emission a more reasonable candidate.
Subject headings:
binaries: close—stars: neutron—pulsars: individual (XTE J1814338)—X-rays: binaries1. Introduction
It has long been believed that millisecond radio pulsars are the spun-up products of sustained mass transfer onto neutron stars in low-mass X-ray binaries (e.g., Bhattacharya & van den Heuvel, 1991). Their presumed immediate progenitors, accretion-powered millisecond X-ray pulsars, proved elusive for many years, but six such systems are now known: SAX J1808.43658 (Wijnands & van der Klis, 1998; Chakrabarty & Morgan, 1998); XTE J1751305 (Markwardt et al., 2002); XTE J0929314 (Galloway et al., 2002); XTE J1807294 (Markwardt, Smith, & Swank, 2003); XTE J1814314 (Markwardt & Swank, 2003; Strohmayer et al., 2003); and IGR J00291+5934 (Galloway et al., 2005). In addition, 13 accreting neutron stars also show millisecond oscillations during thermonuclear X-ray bursts (see Strohmayer & Bildsten, 2005, for a review). These systems are now understood as nuclear-powered millisecond pulsars, with the burst oscillations tracing the pulsar spin (Strohmayer & Markwardt, 2002; Chakrabarty et al., 2003).
The soft X-ray transient XTE J1814314 ( = 3587, = 76) was discovered in outburst on 2003 June 5 during scans of the central Galactic plane with the Rossi X-Ray Timing Explorer (RXTE; Markwardt & Swank, 2003). The outburst lasted for approximately 55 days, and had a peak 2–10 keV flux of around 13 mCrab. RXTE observations also established the source as a 314 Hz (3.2 ms) accretion-powered X-ray pulsar (Markwardt & Swank, 2003) in a 4.3 hour binary with a main sequence companion of at least 0.17 (using the mass function of in Markwardt, Strohmayer, & Swank, 2003, assuming a neutron star mass of ). Over two dozen thermonuclear X-ray bursts with millisecond oscillations at the spin frequency were detected from XTE J1814338 during the 2003 June outburst (Strohmayer et al., 2003). These burst oscillations had the particularly interesting characteristic of containing significant harmonic content, which allowed Bhattacharyya et al. (2005) to constrain the neutron star as well as orbital parameters. One of these bursts showed evidence for photospheric radius expansion, allowing Strohmayer et al. (2003) to infer a source distance of kpc.111This distance estimate should be viewed with some caution, since the burst it is based on has some features which suggest it may not have been Eddington-limited. If the burst was not actually Eddington limited, , and the distance to XTE J1814338 may be less than kpc. We therefore consider 8.0 kpc to be an upper limit for the source distance.
We obtained a brief observation of the source on 2003 June 20 with the Chandra X-Ray Observatory for the purpose of measuring its position, and we used this position to identify the optical counterpart (Krauss et al., 2003). Subsequent optical spectroscopy revealed strong emission lines of H and He including double-peaked H emission, indicative of an interacting binary (Steeghs, 2003). In this paper, we present a detailed report on our Chandra and optical observations of XTE J1814338. In Section 2, we present X-ray and optical imaging and the precise localization and flux measurements of the optical counterpart. We analyze the X-ray spectrum in Section 3, and in Section 4 we discuss the implications of the current data in our understanding of the physical parameters of XTE J1814338.
2. X-Ray and Optical Imaging
We observed XTE J1814338 with Chandra for 9.7 ks on 2003 June 20 using the High Energy Transmission Grating Spectrometer (HETGS) with the spectroscopic array of the Advanced CCD Imaging Spectrometer (ACIS-S). The HETG is comprised of two sets of transmission gratings: the Medium Energy Gratings (MEGs), with a range of 2.5–31 Å (0.4–5.0 keV), and the High Energy Gratings (HEGs), with a range of 1.2–15 Å (0.8–10 keV). The HETGS spectra are imaged by ACIS-S, an array of six CCD detectors. The HETG/ACIS-S combination provides both an undispersed (zeroth-order) image as well as dispersed spectra from the gratings. The spatially overlapping spectral orders are sorted using the intrinsic energy resolution of the ACIS-S CCDs. The first-order MEG (HEG) spectrum has a spectral resolution of (0.012) Å FWHM.
All data processing was done with the CIAO analysis package222http://cxc.harvard.edu/ciao/ (version 2.3). We summed the dispersed first-order events in 500 s time bins to create an X-ray lightcurve, which we searched for signs of orbital modulation. We note that the observation spanned only 60% of the 4.3 hour orbital period, but did cover the time period during which the neutron star was behind the secondary. The data were consistent with a constant count rate of , and we did not detect any evidence of an X-ray eclipse.
We corrected the observation aspect to be consistent with the calibration available as of 2004 March 22. No sources other than XTE J1814338 were detected in the field. Due to the high source count rate, the zeroth order image is over 75% piled up, which suppresses counts in the image core and results in a characteristic “doughnut” shaped point spread function (see, e.g., Davis, 2001). However, this did not affect our ability to use the zeroth-order image to obtain a precise positional measurement with the CIAO tool wavdetect. In order to account for the pileup, we used large wavelet scales (8 and 12 pixels), which are not sensitive to the core of the point spread function. The best-fit X-ray position of XTE J1814338 was R.A. = 02, Dec. = 33∘46′223 (equinox J2000.0) with a 90% confidence radius of 06.
The precise X-ray source position facilitated the identification of an optical counterpart. We obtained images (Harris broadband filter set, which closely approximates Johnson-Cousins) of the XTE J1814338 field on 2003 June 6 and images on 2003 June 7 using the LDSS2 camera on the 6.5-m Magellan/Clay telescope at the Las Campanas Observatory in Chile (field of view of with a scale of /pixel; the seeing on both nights was approximately ). All frames were de-biased and flat-fielded using the IRAF package. An astrometric solution was derived using the USNO-B1.0 catalog (Monet et al., 2003), giving a standard deviation of 035. Using this solution, we find that there is one optical source within the Chandra error circle. This source is not present in a 1989 Digitized Sky Survey333http://archive.stsci.edu/dss/index.html image to a limiting magnitude of : we therefore identify this source as the optical counterpart. Further refinement of the optical position is described below. Flux calibration for the first night was done using the photometric standard star Mark A (Landolt, 1992), and calibration for the second night was made by fitting several in-field stars to the previous night’s measurements; these values are shown in Table 1. Note that these fluxes replace the incorrectly calibrated values reported in Krauss et al. (2003). The optical counterpart brightened slightly over the course of the two days, paralleling the increase in X-ray flux over the same time period as measured by RXTE.
| Observation time (UT) | |||||
|---|---|---|---|---|---|
| 2003 June 6aaCalibration errors are 0.06 magnitudes; relative uncertainty between these two nights is 0.01 magnitudes. | 10:25 | 18.96 | 18.59 | 18.26 | |
| 2003 June 7aaCalibration errors are 0.06 magnitudes; relative uncertainty between these two nights is 0.01 magnitudes. | 09:57 | 18.71 | 18.05 | ||
| 2003 June 21bbCalibration errors are 0.02 magnitudes. | 03:32 | 18.77 | 18.48 | 18.33 | 17.47 |
| 05:06 | 18.64 | 18.39 | 18.16 | 17.37 | |
| 05:13 | 18.62 | 18.34 | 18.21 | 17.42 | |
| 06:26 | 18.61 | 18.33 | 18.16 | 17.35 | |
| 2003 June 24bbCalibration errors are 0.02 magnitudes. | 06:39 | 18.75 | 18.48 | 18.29 | 17.38 |
| 2004 March 15 | 07:47 | ccXTE J1814338 was not detected; this value is the limiting magnitude. | |||
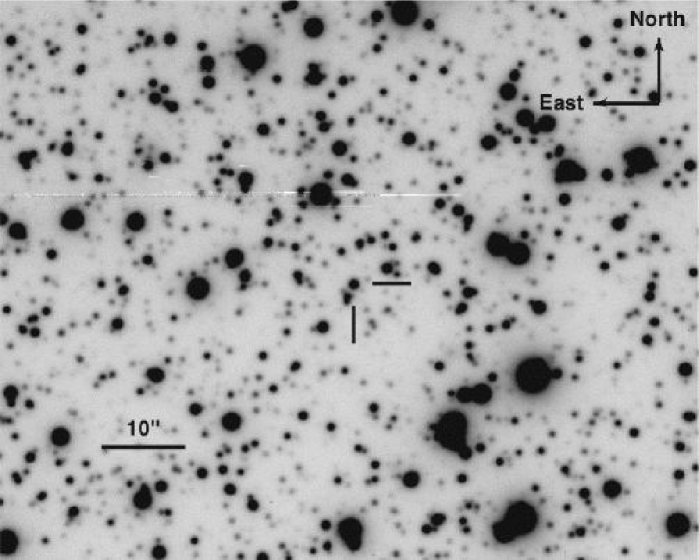
On 2003 June 21 and 24 we obtained additional images (Johnson-Cousins filter set), again with the 6.5-m Magellan/Clay telescope, this time using the MagIC camera (field of view of with a scale of /pixel; the seeing on both nights was approximately —see Figure 1). Again, the frames were de-biased and flat-fielded with the IRAF package. We derived astrometric solutions using 75 sources from the 2MASS catalog (Cutri et al., 2001) and 49 sources from the USNO-B1.0 catalog. The fit using the 2MASS sources is significantly better than the one using the USNO-B1.0 sources, and yields rms residuals of around 007 in each coordinate. From this, we derive an optical position of R.A.04, Dec. = 33223 (equinox J2000.0) with a 90% confidence radius of 02 (the uncertainty is based on the astrometric accuracy of 2MASS, see e.g. Cutri et al., 2001). This position is 025 from the Chandra-derived X-ray position, well within the 06 Chandra error circle. This coincidence, the optical source’s long-term as well as night-to-night variability, its blue color, and the emission lines seen by Steeghs (2003) argue strongly that it is the counterpart of XTE J1814338.
The MagIC images were flux calibrated using the standard star Mark A2 (Landolt, 1992), and the magnitudes of the counterpart are presented in Table 1. The counterpart on these later dates is on average a bit brighter than in the earlier observations, again agreeing with the observed X-ray flux of XTE J1814338, which brightened from around 10 mCrab to around 12 mCrab before the second set of optical measurements were performed. See Figure 2 for a plot of all optical data.
Finally, on 2004 March 15, while the source was in quiescence, we obtained an -band image of the XTE J1814338 field with the ESO Multi-Mode Instrument on the 3.5-m New Technology Telescope at the La Silla Observatory in Chile (field of view of with a scale of /pixel; the seeing was approximately ). The counterpart was not detected in this observation with a limiting magnitude of .

3. X-ray Spectroscopy
We extracted separate X-ray spectra for the MEG and HEG data, co-added the 1 orders, and constructed the corresponding response files (ARFs and RMFs). We used the contamarf444Information about contamarf can be found at http://space.mit.edu/CXC/analysis/ACIS_Contam/ACIS_Contam.html tool to correct the ARF for a decrease in low-energy sensitivity due to contamination on the ACIS CCDs (see, e.g., Marshall et al., 2003). The count rate in the first-order MEG (HEG) spectrum was 2.9 (1.5) cts s-1. To improve statistics, we grouped the spectra such that there was a minimum of 100 counts per bin and assumed Poisson errors. Background spectra were created using the script tg_bkg and subtracted prior to fitting. All fitting was performed using the XSPEC version 11.2 spectral analysis package.
Since the zeroth-order image is severely piled up, all spectral analysis was done on the dispersed first-order spectra, which are not affected by pileup. We fit the MEG and HEG spectra simultaneously over the total energy range 0.5–10 keV, including a normalization factor which was allowed to vary between the two instruments. We found the spectra to be best fit by an absorbed power-law plus blackbody model, where the equivalent hydrogen column density () is fixed to the Galactic value of cm-2 (Dickey & Lockman, 1990). We note, however, that the flux in the blackbody component is only about 10% of that in the power-law component. We also fit an absorbed power-law with allowed to vary, but the value did not deviate significantly from the Galactic value, justifying fits where this parameter is frozen. The results of spectral fitting are summarized in Table 2. Given that the fitted absorption is consistent with a column equal to the integrated Galactic value, it is likely that XTE J1814338 lies at least 500 pc out of the Galactic plane. At the Galactic latitude of = 76, this implies a distance of 3.8 kpc.
| Power-law | Blackbody | |||||||
|---|---|---|---|---|---|---|---|---|
| ( cm2) | bbThe amplitude of the power-law is the flux at 1 keV in units of photons keV-1 cm-2 s-1. | FluxccFluxes are for the energy range 0.5–10 keV and are in units of 10-10 erg cm-2 s-1. | kTin (keV) | ddBlackbody radius assuming a distance to XTE J1814338 of 8 kpc. | FluxccFluxes are for the energy range 0.5–10 keV and are in units of 10-10 erg cm-2 s-1. | (dof) | ||
| 3.1 | 1.41 (405) | |||||||
| 1.63 (fixed) | 3.1 | 1.41 (406) | ||||||
| 1.63 (fixed) | 2.6 | 0.3 | 1.29 (404) | |||||
No significant spectral features (lines or edges) were observed. To quantify this, we searched the spectral residuals for Gaussian features of FWHM equal to 800 km s-1, to match the velocity seen in the H emission (Steeghs, 2003). The 3 upper limits are approximately 0.05 Å at 15 Å and 0.02 Å at 2.5 Å. To date, high-resolution X-ray spectroscopy has been obtained for four MSPs: XTE J1751305 (Miller et al., 2003), XTE J0929314 (Juett, Galloway, & Chakrabarty, 2003), XTE J1807294 (Campana et al., 2003), and XTE J1814338. None have shown significant intrinsic spectral features, and the continua are generally well-fit by an absorbed power-law plus blackbody.
4. Discussion
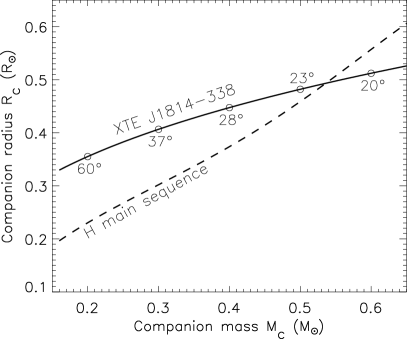
We have identified the optical counterpart of XTE J1814334. The combined optical and X-ray observations allow us to place several constraints on the system parameters. The mass-radius relation for a low-mass Roche-lobe–filling companion in a 4.27 hr binary is (see, e.g., Frank, King, & Raine, 2002). Given the measured neutron star orbital parameters (Markwardt, Strohmayer, & Swank, 2003), the lack of an X-ray eclipse thus restricts the binary inclination (defined as the angle between the line of sight and the orbital angular momentum vector) to () for a Roche-lobe–filling companion. In Figure 3, we compare the companion’s mass-radius relation with the theoretical relation for low-mass hydrogen main sequence stars (Tout et al., 1996). An ordinary hydrogen-rich companion is consistent with the required relation for a mass and (), although this value has a small a priori probability of 7% for an isotropic sample of binary inclinations. We note, however, that bloating of a hydrogen-rich companion owing to X-ray heating could allow a somewhat less massive companion to fill its Roche lobe (Tout et al., 1989), permitting a slightly larger inclination angle with a higher a priori probability. A hydrogen main sequence companion is also consistent with the observed H and He lines in the optical spectra (Steeghs, 2003), whereas a white dwarf companion can be excluded as too small to fill its Roche lobe for any plausible donor mass.
We can check the consistency of our above methods using the brightness of the optical counterpart. Shahbaz & Kuulkers (1998) found that the magnitude of the optical outburst and the orbital period of soft X-ray transients are strongly correlated. Using the relation they derive gives for XTE J1814338, and, since the counterpart in outburst is , a quiescent magnitude of . Assuming due to Galactic dust along the line of sight (Schlegel, Finkbeiner & Davis, 1998), and a minimum distance of 6.4 kpc (corresponding to the lower limit of the distance estimate derived from the radius expansion burst, see Strohmayer et al., 2003), we estimate a limit on the absolute magnitude of a main-sequence companion of . We used the empirical mass-luminosity relation presented in Delfosse et al. (2000) to determine a minimum companion mass of (corresponding to and ). This companion mass is significantly lower than the value derived from the period-density relationship, and would imply that the companion star is significantly bloated due to X-ray heating. However, we note that increasing the assumed distance to XTE J1814338 will increase the minimum companion mass and decrease the maximum inclination angle.
It is also instructive to consider what we can infer about the system given the magnitude limit of the companion in quiescence. We again assume , and infer a value of (given ; see, e.g., Cardelli, Clayton, & Mathis, 1989). We use the upper limit on the distance derived from the radius expansion burst of 9.6 kpc to give an absolute magnitude of . This corresponds to a main-sequence spectral type of later than M1 V and a mass of (corresponding to and ). Using the harmonic properties of the burst oscillations, Bhattacharyya et al. (2005) were able to derive 90% confidence intervals of (). This range is in agreement with our determination of the inclination angle from the magnitude limit of the optical counterpart () and lack of X-ray eclipse (). However, their lower limit of is a bit higher than the value we calculate given the mass-radius relation for an ordinary main-sequence companion of , again suggesting that the companion may be bloated as a result of X-ray heating.
We would expect the optical emission from XTE J1814338 to originate from the combination of an X-ray–heated accretion disk and companion. A simple X-ray–heated accretion disk model (Vrtilek et al., 1990; Chakrabarty, 1998; Wang et al., 2001) is able to account for the observed magnitudes for a wide range of plausible parameters, although the lack of data at bluer wavelengths precludes a well-constrained fit. However, this model is unable to account for the -band data, which are systematically brighter than predicted. (For a plot of the optical data with a representative X-ray–heated accretion disk model, see Figure 2.) Although we do not have infrared data for XTE J1814338, the sharp increase in flux in the -band data suggests an IR excess with respect to the X-ray–heated disk model, similar to what was seen in the accretion-powered millisecond pulsar SAX J1808.4–3658 (Wang et al., 2001). First, let us consider the possibility that this emission arises from the companion: if we take its -band magnitude to be (the limiting magnitude for its non-detection in quiescence), and assume it to be an M-dwarf (in agreement with previous mass estimates), this corresponds to an -band magnitude of (again assuming to obtain ; see, e.g., Cardelli, Clayton, & Mathis, 1989). Although the companion could brighten due to X-ray heating during the outburst, in order for it to account for the excess flux, it would have to brighten to , corresponding to a more than 30-fold increase in flux from quiescence. We consider this to be highly unlikely. Furthermore, if the secondary were substantially heated, its surface brightness would be highly anisotropic, and we would expect to see -band variability at the timescale of the orbital period. The 4.3-hour orbit is well-sampled on 21 June 2003, but we note that there is actually less variability at longer wavelengths (the percent RMS in , , , and is 11%, 9%, 6% and 4%, respectively.) An alternative possibility is that the -band excess could originate from synchrotron emission related to the outburst (see, e.g., Fender, 2001). Future observations of XTE J1814338 in outburst spanning a large spectral range, including measurements in the visible as well as at IR and radio wavelengths, would further our understanding of the geometry and emission mechanisms of XTE J1814338.
References
- Arons & King (1993) Arons, J., & King, I. R. 1993, ApJ, 413, L121
- Bhattacharya & van den Heuvel (1991) Bhattacharya, D., & van den Heuvel, E. P. J. 1991, Phys. Rep., 203, 1
- Bhattacharyya et al. (2005) Bhattacharyya, S., Strohmayer, T. E., Miller, M. C., & Markwardt, C. B. 2005, ApJ, 619, 483
- Campana et al. (2003) Campana, S., Ravasio, G. L., Israel, G. L., Mangano, V., & Belloni, T. 2003, ApJ, 594, L39
- Cardelli, Clayton, & Mathis (1989) Cardelli, J. A., Clayton, G. C., &Mathis, J. S. 1989, ApJ, 345, 245
- Chakrabarty (1998) Chakrabarty, D. 1998, ApJ, 492, 342
- Chakrabarty & Morgan (1998) Chakrabarty, D., & Morgan, E. H. 1998, Nature, 394, 346
- Chakrabarty et al. (2003) Chakrabarty, D., Morgan, E. H., Muno, M. P., Galloway, D. K., Wijnands, R., van der Klis, M., & Markwardt, C. B. 2003, Nature, 424, 42
- Cunningham (1976) Cunningham, C. 1976, ApJ, 208, 534
- Cutri et al. (2001) Cutri et al. 2001, Explanatory Supplement to the 2MASS Second Incremental Data Release
- de Jong, van Paradijs, & Augusteijn (1996) de Jong, J. A., van Paradijs, J., & Augusteijn, T. 1996, A&A, 314, 484
- Davis (2001) Davis, J. E. 2001, ApJ, 562, 575
- Delfosse et al. (2000) Delfosse, X., Forveille, T., Ségransan, D., Beuzit, J.-L., Udry, S., Perrier, C., & Mayor, M. 2000, å, 364, 217
- Dickey & Lockman (1990) Dickey, J. M., & Lockman, F. J. 1990, ARA&A, 28, 215
- Eggleton (1983) Eggleton, P. P. 1983, ApJ, 268, 368
- Fender (2001) Fender, R. 2001, Ap&SS, 276, 69
- Frank, King, & Raine (2002) Frank, J., King, A., & Raine, D. 2002 Accretion Power in Astrophysics, (3d ed., Cambridge: Cambridge Univ. Press)
- Galloway et al. (2002) Galloway, D. K., Chakrabarty, D., Morgan, E. H., & Remillard, R. A. 2002, ApJ, 576, L137
- Galloway et al. (2005) Galloway, D. K., Markwardt, C. B., Morgan, E. H., Chakrabarty, D., Strohmayer, T. E. 2005, ApJsubmitted (astro-ph/0501064)
- Juett, Galloway, & Chakrabarty (2003) Juett, A. M., Galloway, D. K., & Chakrabarty, D. 2003, ApJ, 587, 754
- Kallman, Raymond, & Vrtilek (1991) Kallman, T. R., Raymond, J. C., & Vrtilek, S. D. 1991, ApJ, 370, 717
- Krauss et al. (2003) Krauss, M. I., Dullighan, A., Chakrabarty, D., van Kerkwijk, M. H., & Markwardt, C. B. 2003, IAU Circ. 8154
- Kuulkers et al. (2003) Kuulkers, E., den Hartog, P. R., in ’t Zand, J. J. M., Verbunt, F. W. M., Harris, W. E., & Cocchi, M. 2003, A&A, 399, 663
- Landolt (1992) Landolt, A. U. 1992, AJ, 104, 340
- Markwardt et al. (2002) Markwardt, C. B., Swank, J. H., Strohmayer, T. E., in ’t Zand, J. J. M., & Marshall, F. E. 2002, ApJ, 575, L21
- Markwardt, Smith, & Swank (2003) Markwardt, C. B., Smith, E., & Swank, J. H. 2003, IAU Circ. 8080
- Markwardt & Swank (2003) Markwardt, C. B., & Swank, J. H. 2003, IAU Circ. 8144
- Markwardt, Strohmayer, & Swank (2003) Markwardt, C. B., Strohmayer, T. E., & Swank, J. H. 2003, Astronomer’s Telegram 164
- Marshall et al. (2003) Marshall, H. L., Tennant, A., Grant, C. E., Hitchcock, A. P., O’Dell, S., & Plucinsky, P. P. 2003, in X-Ray and Gamma-Ray Instrumentation for Astronomy XIII, ed. K. A. Flanagan & O. H. Siegmund, SPIE Conf. Proc., 5165, 497
- Miller et al. (2003) Miller, J. M. et al. 2003, ApJ, 583, L99
- Monet et al. (2003) Monet, D. G. et al. 2003, AJ, 125, 984
- Muno et al. (2002) Muno, M. P., Chakrabarty, D., Galloway, D. K., & Psaltis, D. 2002, ApJ, 580, 1048
- Schlegel, Finkbeiner & Davis (1998) Schlegel, D. J., Finkbeiner, D. P., & Davis, M. 1998, ApJ, 500, 525
- Steeghs (2003) Steeghs, D. 2003, IAU Circ. 8155
- Strohmayer & Markwardt (2002) Strohmayer, T. E., & Markwardt, C. B. 2002, ApJ, 577, 337
- Strohmayer et al. (2003) Strohmayer, T. E., Markwardt, C. B., Swank, J. H., & in ’t Zand, J. 2003, ApJ, 596, L67
- Strohmayer & Bildsten (2005) Strohmayer, T. E., & Bildsten, L. 2005, in Compact Stellar X-Ray Sources, ed. W. H. G. Lewin & M. van der Klis (Cambridge: Cambridge U. Press), in press (astro-ph/0301544)
- Tout et al. (1989) Tout, C. A., Eggleton, P. P., Fabian, A. C., & Pringle, J. E. 1989, MNRAS, 238, 427
- Tout et al. (1996) Tout, C. A., Pols, O. R., Eggleton, P. P., & Han, Z. 1996, MNRAS, 281, 257
- Shahbaz & Kuulkers (1998) Shahbaz, T., & Kuulkers, E. 1998, MNRAS, 295, L1
- Vrtilek et al. (1990) Vrtilek, S. D., Raymond, J. C., Garcia, M. R., Verbunt, F., & Hasinger, G. 1990, A&A, 235, 162
- Wang et al. (2001) Wang, Z. et al. 2001, ApJ, 563, L61
- Wijnands & van der Klis (1998) Wijnands, R., & van der Klis, M. 1998, Nature, 394, 344