The Spitzer c2d Survey of Large, Nearby, Interstellar Clouds. I. Chamaeleon II Observed with MIPS
Abstract
We present maps of over 1.5 square degrees in Chamaeleon (Cha) II at 24, 70, and 160 µm observed with the Spitzer Space Telescope Multiband Imaging Photometer for Spitzer (MIPS) and a 1.2 square degree millimeter map from SIMBA on the Swedish-ESO Submillimetre Telescope (SEST). The c2d Spitzer Legacy Team’s data reduction pipeline is described in detail. Over 1500 24 µm sources and 41 70 µm sources were detected by MIPS with fluxes greater than 10-. More than 40 potential YSOs are identified with a MIPS and 2MASS color-color diagram and by their spectral indices, including two previously unknown sources with 24 µm excesses. Our new SIMBA millimeter map of Cha II shows that only a small fraction of the gas is in compact structures with high column densities. The extended emission seen by MIPS is compared with previous CO observations. Some selected interesting sources, including two detected at 1 mm, associated with Cha II are discussed in detail and their SEDs presented. The classification of these sources using MIPS data is found to be consistent with previous studies.
1 Introduction
The Chamaeleon (Cha) II molecular cloud is one of five clouds that were mapped with the Spitzer Space Telescope (SST) as part of the “From Molecular Cores to Planet-forming Disks” Legacy project (Evans et al., 2003). The main goal of the “Cores to Disks” (c2d) Legacy project is to study the evolution of star and planet formation from cold molecular cores to protoplanetary disks in a range of environments. The project makes use of all of the instruments on the SST (the Multiband Imaging Photometer for Spitzer (MIPS), the InfraRed Array Camera (IRAC), and the InfraRed Spectrograph (IRS)) to observe nearby molecular clouds, isolated regions of star formation, and young stellar objects (YSOs), defined broadly in this work as sources with infrared excesses. One goal of the c2d project is to survey the YSO population of the five large molecular clouds for new candidate protostars as well as substellar objects down to 0.001 L⊙. This work describes MIPS observations of one of the molecular clouds mapped by c2d, Cha II, and is the first of a series of papers that present initial results from the c2d observations. We also present a new millimeter map of Cha II from SIMBA on the Swedish-ESO Submillimetre Telescope (SEST). The IRAC observations of Cha II will be described by Porras et al. (2005, in preparation). Later papers will follow that combine the data from all of the SST observations as well as complementary observations at other wavelengths and include further analysis of the YSOs and cloud environments.
Chamaeleon is a star forming region in the Southern sky that includes at least half a dozen distinct clouds (Boulanger et al., 1998). Cha II ( = 13h, = 77∘; J2000), at a distance of 178 18 pc (Whittet et al., 1997), is known to harbor dense molecular cores (Mizuno et al., 1999), T Tauri stars, and YSOs (Schwartz, 1977; Whittet et al., 1991; Hughes & Hartigan, 1992; Prusti et al., 1992; Vuong, Cambrésy, & Epchtein, 2001). Pointed ROSAT observations revealed many X-ray sources in Cha II including weak-line and classical T Tauri stars (Alcalá et al., 2000). In addition to low-mass young stars, one intermediate mass Ae star, DK Cha (IRAS 12496-7650), and the well-studied Herbig-Haro object HH 54 (e.g., Knee 1992; Liseau et al. 1996; Neufeld, Melnick, & Harwit 1998) are also associated with Cha II. Persi et al. (2003) studied a portion of Cha II (28′ 26′) near the Class I source IRAS 12553-7651 (ISO-ChaII-28) in the mid-infrared (6.75 and 14.3 µm) with ISOCAM on the ISO satellite as well as with near-infrared images and found 4 new candiate YSOs (see their Table 4) in the observed region. Our MIPS survey of Cha II covers more area (about 7 times) at longer wavelengths (24, 70, and 160 µm) than the ISO observations with greater sensitivity (1- 0.15 mJy at 24 µm vs. 1.3 mJy at 14 µm).
The five clouds in the c2d survey were chosen to span a range of star formation conditions. Cha II is one of the most quiescent of the clouds, with only a few known very young (Class I) objects. Most of the more than 30 previously identified YSOs in Cha II are T Tauri stars. Cha II is a typical site of low-mass star formation compared with other regions, with a star formation efficiency (1%; Mizuno et al. 1999) similar to that of Taurus (2%; Mizuno et al. 1995) and the Ophiuchus-north region (0.3%; l = 355 – 12∘, b = 15 – 23∘; Tachihara, Mizuno & Fukui 2000). Boulanger et al. (1998) studied Cha II with CO and IRAS and reported that the ratio between the mass needed to gravitationally bind the cloud and the gas mass is 7.8, indicating that Cha II is not gravitationally bound. They suggest that Cha II may be two independent clouds not bound together, because the CO spectrum has two lines. Mizuno et al. (1999) mapped Cha II in C18O and combined their work with previous infrared and optical studies of the cloud. They report two velocity components in the C18O for the southeastern part of the cloud and suggest that Cha II and Cha III might be superimposed along the line of sight. Therefore, it is unclear if Cha II itself is bound. Mizuno et al. (1999) also compared their Cha II results with similar previous work on other molecular clouds, such as Taurus (Onishi et al., 1996) and the Ophiuchus-north region (Tachihara, Mizuno & Fukui, 2000) (see Mizuno et al. (1999) Table 2). The mean molecular column density ((H2)) of Cha II, cm-2, is slightly smaller than that of Ophiuchus-north, cm-2, or Taurus, cm-2 (Mizuno et al. 1999 Table 2). Mizuno et al. (1999) also found a half-power Gaussian linewidth, , of 0.78 km s-1 in Cha II, which is similar to Ophiuchus-north ( = 0.7 km s-1) but greater than Taurus ( = 0.49 km s-1). Mizuno et al. (1999) report that the young stars in Cha II are not densely clustered, but in sparse groups. There is a group of T Tauri stars in the southern tip of the cloud, and other known T Tauri stars are scattered along the eastern edge and to the east of the cloud (Mizuno et al., 1999).
2 Observations
2.1 MIPS Observations
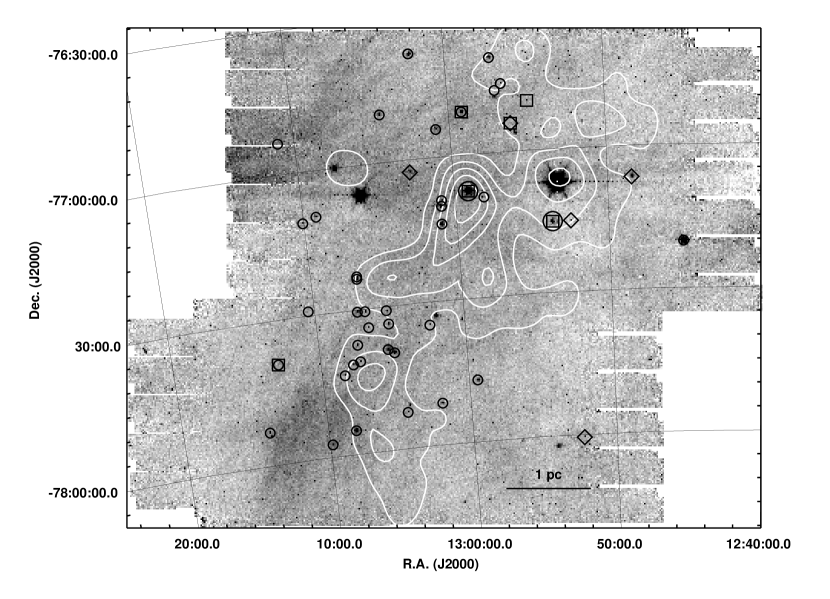
The general Spitzer mapping strategy of Cha II was consistent with that of the other four molecular clouds in the c2d Legacy program (Evans et al., 2003). All of the area in the Cha II molecular cloud with an AV greater than 2 magnitudes (Cambrésy, 1999) was mapped with the Multiband Imaging Photometer for Spitzer (MIPS; Rieke et al. 2004) on 06 April 2004 (PID: 176, AOR keys: 0005741056, 0005744640, 0005744896, 0005745152). A total area of over 1.5 square degrees was mapped in MIPS fast-scan mode. The fast-scan mode observes in all MIPS wavelength bands (24, 70, and 160 µm) simultaneously. The pixel size is 2.5″ at 24 µm, 10″ at 70 µm, and 16″ 18″ at 160 µm. A more detailed desciption of the MIPS instrument can be found in Rieke et al. (2004) or in Chapter 8 of the Spitzer Observer’s Manual (2004). Cha II was covered by two Spitzer astronomical observation requests (AORs), 1∘ long in the scan direction by 11 scan legs (0.7∘) and 14 scan legs (0.9∘) wide. The scan legs were offset from each other by 240″. Figure 1 shows the 24 µm map of Cha II; the scan direction is approximately East-West. In fast-scan mode, MIPS integrates for 3 seconds per pointing on the sky. Any individual position on the sky is observed 5 times at 24 and 70 µm for an integration time of 15 seconds per position on the sky. However, the effective 70 µm field of view (FOV) is only half that of the 24 µm array (about 5′ 5′), because only one half of the 70 µm array returns useable data. The 160 µm coverage in fast-scan mode is not complete by design. The 160 µm array has a FOV of only 0.5′ 5′ and is further reduced by a dead read-out (Rieke et al., 2004). The integration time at any position on the sky at 160 µm is either 0 or 3 seconds in fast-scan mode. The integration times are higher in all bands in regions where the scan legs or AORs overlap.
The entire cloud was observed twice. The second observation, or epoch, began about 6 hours after the first. The AORs were designed with a 3 to 6 hour separation of epochs to enable the detection and removal of asteroids at 24 µm. The two epochs were offset from one another on the sky by about half an array (125″) in the cross scan direction. The offset was designed to fill in the gaps left by the side of the 70 µm array that does not return usable data. This observation strategy results in approximately the same coverage at 24 and 70 µm but less total (2-epoch) integration time at 70 µm (15 seconds) than at 24 µm (30 seconds). Additionally, the second epoch was shifted by 80″ in the scan direction to partially fill the gaps in the 160 µm coverage area. The 160 µm coverage is still not complete with two observations, but the gaps are minimized.
2.2 SIMBA Observations
Millimeter continuum observations were made 10 – 15 November 2001 with the 37-channel bolometer array SIMBA (SEST Imaging Bolometer Array) at the SEST on La Silla, Chile. We observed two regions which cover the areas of highest optical extinction towards the Cha II complex. The northern region has an approximate extent of , and the southern one has an extent of roughly for a total coverage of over 1.2 square degrees. The area mapped by SIMBA is slightly smaller than and fits within the MIPS observation area. SIMBA is sensitive between about and , with an effective frequency of or an effective wavelength of .
In total, 46 maps were taken in the fast scanning mapping mode with a scanning speed of . Each of the maps consists of 89 subscans in azimuth with a length of 1400″, with 16″ of spacing in elevation between subscans (and thus a total map extent of 1408″ in elevation). The pointing uncertainties are of order 7″ to 16″, as determined from (and corrected on the basis of) offsets between the SIMBA and MIPS positions of IRAS 12496-7650, while the SEST has a HPBW of 24″ at . The zenith opacity, which was determined by skydips performed at least every second hour for most of the data (and at least every fifth hour in some cases), ranged from to . Maps of Uranus and Mars were used for calibration purposes. The derived calibration factor of is in very good agreement with the factor of determined by the telescope crew for this observing period. Based on frequent observations of Carinæ, we estimate the relative calibration uncertainty to be within 15%.
3 Data Reduction
3.1 MIPS Data
MIPS images were processed by the Spitzer Science Center (SSC) using the standard pipeline (version S9.5) to produce Basic Calibrated Data (BCD) images (Gordon et al. 2005a; Masci et al. 2005; MIPS Data Handbook 2004). The BCD images were then further corrected for some instrumental signatures as described below. Other instrumental signatures, e.g., dark latents, column and row pulldown effects, and streaks extending from bright objects, have not been corrected. Bright latent images occur at roughly 60″ intervals in the scan direction after a bright object. No attempt was made to explicitly remove cosmic rays or bright latent images from the BCD images. We used either the redundancy and outlier rejection in mosaicking, or inspection, to avoid mis-identifying these as point sources. Some of the bright latent images can be seen to the East and West of the bright sources in the 24 µm map of Cha II (Fig. 1). Complete details of the c2d processing are available from the SSC in the documentation at http://ssc.spitzer.caltech.edu/legacy/ (Evans et al., 2004).
3.1.1 24 Micron Fast-scan Map Data
With the 24 m array, a “jailbar” pattern results from bright sources or from cosmic ray hits. The jailbars are time-dependent variations in the relative gains between readouts in the array. We applied a multiplicative correction to each BCD frame for any detectable fixed-amplitude jailbar pattern across the array, bringing lower columns up to the level of the highest columns. For some data, we corrected the jailbarring in two sections, rows above and rows below a bright object. A few frames had a more complex jailbar pattern and these were dropped from further analysis. Also, “first frame” corrections were applied. Scale factors were applied to the first four frames in a map to bring them up to the median of subsequent frames. Finally, frames in each scan leg were median-combined to create “self-flats”. Each frame was divided by the self-flat for that scan leg. This procedure corrected for residual jailbarring and a 1 to 2% gradient along the column direction. Uncertainties resulting from these corrections to the pixel values are estimated to be typically 0.2 %, and the resulting uncertainties in point-source fluxes 0.03 mJy. This uncertainty is small compared to other sources of uncertainties.
3.1.2 70 and 160 Micron Fast-scan Map Data
The 70 and 160 µm data contain several instrumental signatures. The SSC provided two types of BCD images: normally processed (unfiltered), and those with a time-median filter applied that removes most of the background signal (filtered). Following the current recommendation of the SSC, we used the 70 µm filtered data to obtain point-source fluxes. However, only the unfiltered data preserve extended emission.
We are interested ultimately in fluxes for both point sources and extended emission. In this paper, we present preliminary maps made from unfiltered 70 and 160 µm data. The 70 µm map includes approximate corrections for instrumental effects as described below. The flux calibration for extended emission in the 70 and 160 µm data is uncertain at the present time. The corrections applied at 70 µm may not lead to properly calibrated data. The maps should be seen as only illustrating rough levels of extended emission.
First, after stimulator (stim) flashes in 70 µm data, there was a “stim latent” signal present in subsequent BCD frames. The first frame after the stim flash was most affected; 4 frames after the stim flash could have some residual effect. We applied a column-by-column subtractive correction based on the level after the latents decayed. Second, the unfiltered data had striped patterns approximately along the column direction due to suspected response variations (of order several 10%). We created an “illumination correction” made from the data themselves by median-combining frames in each scan leg. However, the corrected data are of uneven quality. Surface brightness uncertainties introduced by these corrections are difficult to estimate without better understanding of the instrument. However the amplitude of the illumination corrections, several 10%, may be a rough estimate.
No changes were made to 160 µm unfiltered BCD data as the steps needed for extended-source calibration are still in a preliminary stage.
3.1.3 Image Mosaicking
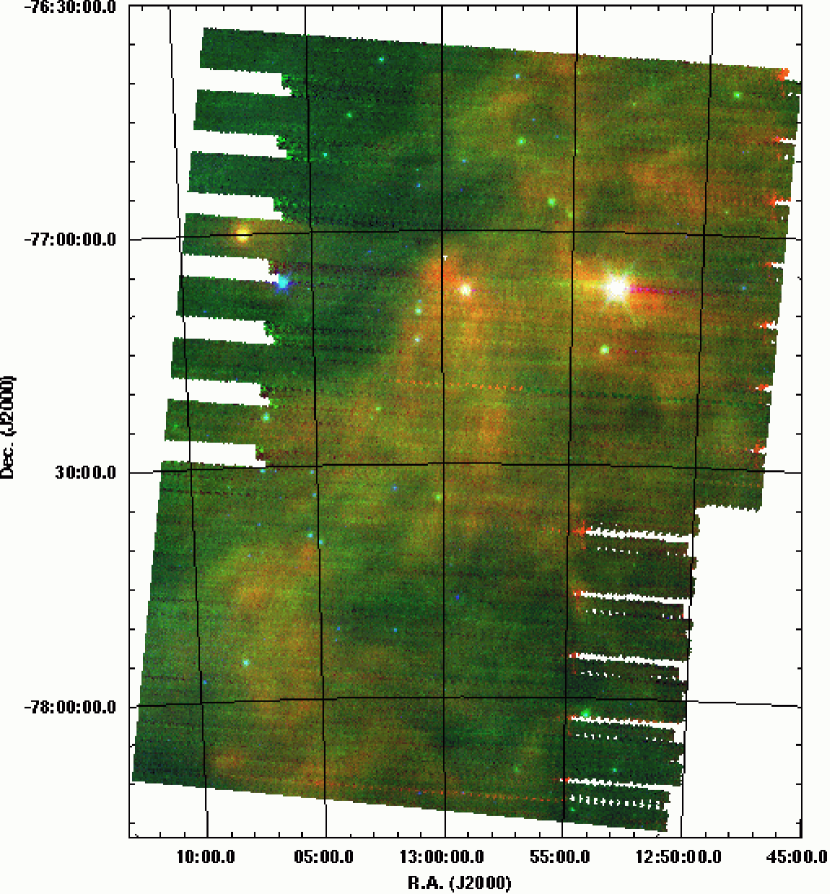
The mosaic images produced for each wavelength are important both for the overview they provide of the mapped area, especially of the diffuse extended emission, and because our source extraction process begins by searching for sources in the mosaics. A three-color (24, 70, & 160 µm) mosaicked image of Cha II is shown in Figure 2. This map shows the unfiltered 70 and 160 µm data to display the extended emission in Cha II. The primary tool for mosaicking is the Spitzer Science Center’s “MOPEX” code (Makovoz, 2004). This code includes a continuously evolving set of modules that correct for some problems in the BCD and attempt to piece many BCD images together into large mosaics. Optional modules exist to filter out radiation hits (outlier rejection) and to correct for small positional errors in the FITS headers (position refinement).
For the 24 µm data, we have used MOPEX with the outlier rejection and position refinement modules turned on with nominal parameters. In order to detect asteroids, we have divided the total data set into two separate groups of BCD images, according to the two epochs in which our data were acquired, and processed each independently. The actual process of identifying asteroids and combining the two epochs into a single, higher reliability source list is described later in section 3.1.5. In total, we construct mosaics for each epoch separately plus a combined mosaic in which the highest signal-to-noise ratio is obtained.
As part of its standard processing, MOPEX makes use of mask files to avoid including BCD pixels in the final mosaic that have been identified as having some problem. For our mosaics, we have used a combination of the masks created in the initial c2d processing together with the outlier masks constructed during the outlier-rejection processing by MOPEX. The masks created by the c2d team effectively combine the bad pixel masks (“pmask”) and the bad detection masks (“dmask”) of the SSC.
The geometry of the mosaics constructed with MOPEX for this paper was such that we kept a 1:1 pixel size ratio between the basic instrument pixel size and mosaic pixel size, and we assembled the BCD images in a coordinate system essentially fixed with respect to the average instrument rotation projected on the sky. The former minimizes file sizes and processing time. The latter simplifies the process of point source extraction from the mosaics since the instrumental PSF will have the same rotational orientation for any mosaic.
3.1.4 Source Extraction
The process of source extraction involves finding likely compact objects in the data and characterizing them by flux, position, and some estimate of the way in which they might differ from a “perfect” point-like object. The details of our point source extractor will be described in a future paper (Harvey et al. 2005, in preparation), but we summarize the main points here.
The source extraction tool, c2dphot, is based on the venerable “DoPHOT” code described by Schechter, Mateo, & Saha (1993). Our version includes the following important modifications to DoPHOT: (1) utilizes a digitized point source profile, rather than analytic, to best match the real Spitzer data; (2) accepts floating point input FITS images and computes output fluxes based on the Spitzer surface brightness units in the BCD images; (3) accepts input masks to avoid using pixels that have been declared bad for whatever reason; (4) includes a multiframe mode that fits fluxes and positions from the entire stack of BCD frames relevant to any input source position using the un-smoothed instrumental PSF rather than that produced by the mosaicking process. The most significant unchanged aspect of c2dphot/DoPHOT is the basic source extraction process. In particular, c2dphot starts at an upper flux level, finds and characterizes sources above that level, and subtracts them from the image. It then works its way down in flux, typically by a factor of 2 step each time, doing the same thing until it reaches the lower flux limit input by the user. If c2dphot finds an object that is better fit by a two-axis ellipsoid than the numerical point source profile, it will classify the object as extended and produce estimates of the source size and tilt of the ellipse.
Like any source extractor, there are many tunable parameters in c2dphot to enable it to deal with a variety of problems or characteristics in the data. We discuss the most important here and how we have tuned them for the sources found in this analysis. The most sensitive parameters for both accurate source extraction and photometry are the sizes of the search box, fitting box, and aperture photometry boxes. For these data, we used search and aperture boxes of 7 pixels and a fitting box of 5 pixels, based on a number of tests on simulated data sets as well as a variety of real data from Spitzer. Other tunable parameters include thresholds for deciding whether a source is extended, whether an initial detection is better fitted by a tilted plane, and whether a source is so small that it is more likely to be a previously undetected radiation hit. These have all been tuned to levels that appear appropriate from careful visual inspections of subsets of the data.
The details of the c2dphot source extraction processing for the 24 µm data involve running the source extractor first on the mosaic image produced by MOPEX. Then the multi-frame option is run with the output list from the previous processing given as an input list for flux, position, and shape refinement, but no new source searching. As mentioned above, this procedure insures that the source characteristics are derived from the least-processed form of the data, the BCD products. For MIPS 70 µm data we have extracted sources from the mosaics made with the filtered BCD images with c2dphot.
The calibration of source fluxes is done in the following way. For all objects for which a reliable aperture flux could be determined and which were well fitted by the nominal point source profile, the ratio of the aperture flux to model flux was averaged. The fact that this ratio is not unity is expected since the model fluxes are essentially the product of a single number, the fitted peak value, multiplied by the PSF area. Small errors and uncertainties in the PSF area will then lead to errors in the total model flux. We then assume that this average ratio of aperture flux to model flux applies for all point sources and multiply by an additional correction factor of about a factor of two at 24 µm for the aperture used in c2dphot relative to that for the absolute calibration used by the SSC (essentially a traditional “aperture correction”). This correction introduces absolute flux uncertainties of up to 10%.
Relative flux and position uncertainties in c2dphot are calculated in a standard way from a numerical estimate of the Hessian matrix (Press et al. 1997, Sivia 1996). In particular, the matrix of partial gradients of chi-squared is calculated numerically for variations in the four model parameters (for point sources). This is done by fixing each parameter at levels slightly offset above and below the best fit parameter and calculating the change in chi-squared for all combinations of offset parameters. The diagonal elements of the square root of the inverse of this matrix then give an error estimate, at least in the case where the errors are reasonably behaved. A random check of the off-diagonal elements has shown that the only significant correlation between error estimates is that expected between the derived sky level of the fit and the peak star amplitude. For extended extractions a similar procedure is part of DoPHOT and c2dphot using analytic, rather than numerical estimates of the derivatives.
The absolute uncertainty in the fluxes is at least 5% at 24, 10% at 70, and 20% at 160 µm as estimated by the MIPS instrument team (Gordon et al., 2005b). However, considering uncertainties introduced by the “aperture correction” in c2dphot, we estimate the total uncertainty in these data to be closer to 10% at 24 and 20% at 70 and 160 µm.
3.1.5 Bandmerging
The 24 and 70 m bands were processed differently in the bandmerging stage of the c2d pipeline because the 70 m band has only one effective epoch of observations. Our observations were planned so that our second epoch would fill in the gaps in the coverage at 70 m caused by the unusable half of the array.
The final list of sources and fluxes was produced in three steps. First, the source extractions for 24 m in the two epochs are compared. A source detection in one epoch that has only a single match within 20 in the other epoch and no other matches in its own epoch is considered a “good” source and the two detections are averaged. Detections that do not have any match within 20 in either epoch or detections with more than one match in an epoch are suspect sources and these are checked to ensure no valid sources are missed. The candidate sources are then filtered to include only those sources with fluxes greater than or equal to 10 times the flux uncertainty (10-). Asteroids, which are bright at 24 m, shift positions between the two epochs. As a result, they are excluded in this step because an asteroid detected in one epoch will not have a corresponding detection within 20 in the second epoch. As expected, due to Cha II’s ecliptic latitude of 65∘, no asteroids were detected at 24 µm in the data. Asteroids are not bright enough at 70 µm to be detected.
In step two, the filtered source extractions for 24 m are compared with the source extractions made from the combined-epochs images. A good source detection has only a single match within 20 in both the filtered list and the combined epochs list. For these sources, the position and flux information from the combined epochs detection is substituted as the best value for the source. As in step 1, sources not detected within 20 in both the filtered list and the combined-epochs list or sources containing multiple detections within 20 in either list are examined and saved if merited. The final list of good sources at 24 m is again filtered to only include those with fluxes greater than or equal to 10-. Because we only have one epoch of observations at 70 m, only the sigma clipping was performed in this step for the 70 m data.
The 24 and 70 m bands were merged in step three. The source extraction program produced many artificial detections near the ends of the MIPS scan legs at 70 µm. Most of these false detections were eliminated from the source list by the 10- cut and by removing sources with aperture fluxes less than or equal to zero. The final 70 µm source list was then bandmerged with the 24 µm source list.
3.2 SIMBA Data
The SIMBA 1 mm mosaics were reduced and combined using the MOPSIC111MOPSIC is a software package for infrared, millimeter, and radio data reduction and analysis developed and constantly upgraded by R. Zylka. software package. The noise in the maps forces us to subtract correlated skynoise and baselines of order 2, which both filter out emission on large scales. The correlated skynoise was evaluated as a weighted mean of the channels spaced by more than 50″ from the channel to be corrected. Thus the response to extended sources (i.e., with a diameter larger than the “correlation” radius of 50″) is damped by the skynoise filter. Such sources are not quantitatively preserved. Compact (i.e., diameter less than 50″) and unresolved sources (i.e., diameter less than a beam) are not significantly affected by the filter. In total, 7 noisy maps and several subscans with spikes and drifts were not included in the mosaic in order to improve the noise level and to minimize artifacts. The final on-source integration time is therefore .
We apply a reduction scheme with three iteration steps, which reduces the filtering of extended emission by skynoise subtraction. After the first step, regions with significant emission are identified and included in a source model. In the second step, the source model is first subtracted from the deconvolved raw data before skynoise and baseline removal, and then again added to the data before coadding. This yields a map in which the extended emission is better preserved from spatial filtering by the skynoise filter, while the impact of baseline removal is not mitigated. The improved map is then used to obtain an improved source model, which then is used in a third and final iteration step to derive the final map. We correct for pointing uncertainties by shifting maps by the offset between the SIMBA and MIPS positions of IRAS 12496-7650 observed for the respective epoch (i.e., by 7″ to 16″).
4 Results
4.1 MIPS Source Counts
1532 sources at 24 µm and 41 sources at 70 µm were identified with fluxes greater than 10-. Normal source extraction techniques were not possible on the 160 µm data because the emission is so extended and the coverage was incomplete. However, several bright peaks are seen in the map, and 160 µm aperture fluxes are presented for two sources discussed in Section 5. In the mosaics, the median background and rms noise values in the off-cloud regions where structured dust emission is low are 16 and 0.1 MJy ster-1 at 24 µm, 6 and 0.8 MJy ster-1 at 70 µm, and 30 and 4.5 MJy ster-1 at 160 µm.
To determine approximate completeness limits, we plot two parameters versus source magnitude: cumulative source counts and extracted uncertainty. Figure 3 shows the cumulative source counts for 24 and 70 µm in Cha II. The 24 µm counts include all sources extracted from the mosaic with no sigma cut (2481 sources). The 70 µm cumulative source counts only include greater than 10- sources verified by eye to be real (41 sources) since the source extraction produced many artificial detections at the end of the scan legs in this band. The 24 and 70 µm magnitudes were calculated using zero point fluxes derived from a blackbody corresponding to Vega (Table 1). The source counts flatten at the faintest magnitudes, indicating completeness to about 10 mag (0.7 mJy) at 24 µm and 3 mag (50 mJy) at 70 µm. Plots of magnitude uncertainty versus magnitude for Cha II, Figure 3, show that the uncertainty reaches 0.1 magnitude at close to the same values as the turnover in source counts, 10 mag at 24 µm and 3 mag at 70 µm. Experience with other large surveys suggests that 0.1 magnitude uncertainty is usually about where the 90% completeness level lies. The 24 µm flux limit of 0.7 mJy is consistent with the 3- sensitivity (0.83 mJy for 24 seconds integration) predicted for the c2d program by Evans et al. (2003). However, the 70 µm limit of 50 mJy is much higher than the 10- sensitivity predicted prior to launch (17 mJy in 24 seconds; Evans et al. 2003) partially due to the loss of half of the array and resultant cut in the integration time. The observed completeness limits are about 5 and 6 times the SSC’s expected post-launch 1- sensitivities with low background and appropriate integration times at 24 and 70 µm respectively (Spitzer Observer’s Manual 2004).
Figure 4 shows the 24 µm source counts per square degree versus flux ( vs. ) for the total 1532 sources in the complete mosaic of Cha II. The sample is flux limited as shown in Figure 4 by the steep drop in for mJy. The complete field can be divided into two regions: on-cloud and off-cloud. The on-cloud field is defined by an area that encloses the Cambrésy (1999) AV = 1 contour and includes 825 24 µm sources. The remainder of the field is considered off-cloud. Figure 4 compares of the total field (on-cloud and off-cloud samples) with galaxy counts from the SWIRE Spitzer Legacy project (Lonsdale et al. 2003; Marleau et al. 2004) and model star counts for the position of Cha II at 25 µm from Wainscoat et al. (1992). The Wainscoat star counts were computed using a C-version of the model provided by J. Carpenter (2001, private communication). This version of the model allows for the inclusion of extinction in calculating the source counts. The AV was set to 2 magnitudes as an approximate average between off-cloud, where AV 1, and on-cloud regions, where AV = 1 to 6 with a few patches of AV 6 (Fig. 1).
For mJy, the Cha II source counts are consistent with the SWIRE galaxy counts. For fluxes greater than about 20 mJy, the Cha II and model star counts exceed the galaxy counts. Therefore, most of the bright 24 µm sources are likely associated with the Cha II cloud or are Galactic, while most of the fainter sources are probably galaxies. The Wainscoat et al. (1992) model star counts also exceed the Cha II source counts for mJy. Even though the total source and model counts are small in these flux bins, we assume not all of the Cha II sources are background stars. The discrepancy between the Wainscoat model and the data appears real and indicates that the model overestimates the star counts toward Cha II. Increasing the AV in the Wainscoat model reduces the inconsistency. However, an AV of 20 magnitudes is needed for the model counts to be approximately equal to the total source counts for bright sources. This large extinction is only seen for a few isolated positions in the cloud so is not the best choice for the model. For 24 µm fluxes greater than 70 mJy, there is an excess of on-cloud sources over off-cloud sources (21 on-cloud vs. 7 off-cloud). Although this excess is statistically small, the numbers are representative of the locations of previously known YSOs in Cha II. There are a small number of T Tauri-type stars associated with Cha II in the off-cloud (A 1) area. Figure 1 shows the Spitzer 24 µm map of Cha II with AV contours and known and candidate YSOs marked. This figure shows that most of the YSOs in Cha II are on the eastern edge of the cloud rather than in areas of high extinction.
4.2 MIPS–2MASS Color-Magnitude Diagrams
The 24 µm source list was bandmerged with the 2MASS catalog (Cutri et al., 2003) for matches within 20. We identified 626 sources as having both a 24 µm and Ks (2.159 µm) detection. The magnitude limit of the 2MASS catalog is K 15 mag. These sources are plotted in a Ks magnitude versus (K[24]) color diagram in Figure 5. The diagonal cutoff at lower left of the figure indicates the 24 µm flux limit of around 0.7 mJy. Two large clusters are seen in the plot. The first clump at (K[24]) = 0 contains main sequence stars. The second cluster at Ks 13 mag and (K[24]) 4 mag probably consists mainly of galaxies. Using data from the SWIRE extragalactic survey with Spitzer (Lonsdale et al. 2003; Surace et al. 2004), we predict where galaxies are likely to fall in the Ks versus (K[24]) color-magnitude space. Most of the SWIRE galaxies fall between (K[24]) = 4.5 and 8.5 mag with Ks 13 mag, indicated by a box in Figure 5. A few SWIRE objects trail out between (K[24]) = 3 and 4.5 magnitudes, all of those with Ks 12 mag, indicating that some of the sources in the plot that are faint at Ks, but with (K[24]) 4.5 might also be galaxies. However, 5 of the 11 sources with 11 Ks 13 and (K[24]) 5.5 mag were identified as YSO candidates by Vuong, Cambrésy, & Epchtein (2001) or Persi et al. (2003). Therefore, that region of color-magnitude space is ambiguous.
Reddened sources with relatively bright Ks magnitudes between the star and galaxy clusters in the Ks vs. (K[24]) plot (Fig. 5) are potential YSOs associated with Cha II. Class II sources fall in the middle of the plot with bright Ks magnitudes and red (K[24]) colors. The Class I sources IRAS 12553-7651 (ISO-ChaII-28, Persi et al. 2003) and IRAS 12500-7658 (Chen et al., 1997) are outliers with the reddest (K[24]) colors. In order to find potential YSOs, we identified sources with K 13 mag and (K[24]) 1 mag. These criteria eliminate galaxies and stars, but also generally exclude Class III sources, which have similar colors to stars. Forty-nine sources fit these criteria and were cross-checked with known YSOs from the literature. Forty were previously identified as YSOs or YSO candidates (Gauvin & Strom 1992; Prusti et al. 1992; Chen et al. 1997; Vuong, Cambrésy, & Epchtein 2001; Persi et al. 2003). Five of the sources have SEDs consistent with highly extincted background stars. Two sources are possible YSOs but are very faint at Ks ( 12 mag) and cannot be distinguished from galaxies with these data. However, the SEDs of 2 sources (2MASS 12560549-7654106 and 2MASS 13125238-7739182) indicate they have a 24 µm excess and are likely stars with disks. These sources are described further in Section 5. The 40 previously identified and 4 new YSO candidates selected from the color-magnitude diagram are listed in Table 2. This list of YSO candidates includes 6 identified by Persi et al. (2003, Table 3 & 4) with ISO, including one of their new candidate YSOs ISO-ChaII-13. Our YSO criteria were unable to identify the Class III sources from Persi et al. (2003), and we did not detect the 3 other new candidates from their Table 4 with MIPS. Table 2 also includes 9 low mass T Tauri or young brown dwarf candidates identified by Vuong, Cambrésy, & Epchtein (2001).
Despite the improved sensitivity of MIPS over previous infrared instruments, the small number of new YSO candidates found with MIPS and 2MASS data in Figure 5 indicates that previous studies (e.g., Schwartz 1977; Gauvin & Strom 1992; Prusti et al. 1992; Persi et al. 2003) achieved a nearly complete census of the YSOs in Cha II. However, a later paper will combine the MIPS and IRAC data of Cha II. The IRAC data may allow the identification of more new low luminosity YSOs among the sources that cannot be distinguished from galaxies with MIPS and 2MASS data alone.
Figure 6 plots (HKs) versus (K[24]). In this color-color space, the SWIRE (Lonsdale et al. 2003; Surace et al. 2004) galaxies fill nearly the same area as the data with (K[24]) 3 mag. Therefore, it is very difficult to use this color-color space to identify potential YSOs. A future paper on IRAC observations of Cha II by the c2d team (Porras et al. 2005, in preparation) explores different color-color spaces including the IRAC bands for identifying YSOs.
A MIPS 24 and 70 µm color-magnitude diagram is shown in Figure 7. Thirty-eight Cha II sources with detections at both 24 and 70 µm are distributed in two clumps on the color-magnitude plot, the first with [24] 5 mag and the second with [24] 6 mag. Known Class I and II sources from Persi et al. (2003) as well as some other interesting objects are labeled on the plot. The Class II sources fall within the main cluster of sources near ([24][70]) = 2 mag. Three Class 0/I sources, IRAS 13036-7644 (in an isolated core to the East of the main cloud, BHR86; Bourke et al. 1995; Mardones et al. 1997), IRAS 12553 (Persi et al. 2003) and IRAS 12500 (Chen et al., 1997), fall to the right of the group with redder ([24][70]) colors. All of the sources in the second group, with [24] 6 mag, are very faint ( 13 mag) or not detected at Ks. Since the SWIRE galaxies all have similarly faint Ks magnitudes, the second group cannot be distinguished from galaxies. The separation between the groups in Figure 7 also suggests that objects brighter than 6 mag at 24 µm are likely within the Galaxy.
Models of 1 L⊙ Class 0 to Class III protostars from Whitney et al. (2003, see their Fig. 8a) and an evolutionary track of a 1 M⊙ protostar from 4000 to 210,000 years (Class 0 and I stages) (Young & Evans, 2005, their Fig. 20) are also plotted on Figure 7. Each Whitney et al. (2003) line on the plot represents a range of inclination angles for a model of a particular class object observed with a 1000 AU radius aperture. This aperture would be roughly equivalent to a diameter of 4 24-µm pixels or 2 70-µm pixels for the distance of Cha II. Young & Evans (2005) also give evolutionary tracks for 0.3 and 3 M⊙ protostars, but these do not vary significantly from the 1 M⊙ track, except that the 0.3 M⊙ track drops down to [24] 0 mag for ([24][70]) 4 mag. Most of the Cha II sources with bright 24 µm magnitudes have bluer ([24][70]) colors than predicted either by Whitney et al. (2003) or by the evolutionary track of Young & Evans (2005). However, the Young & Evans (2005) evolutionary track and most of the Whitney et al. (2003) models are for younger protostars (Class 0 – I), while Cha II has only a few Class I sources. The Cha II sample is dominated by more evolved Class II objects. The second group of sources, with [24] 6 mag, falls to the right (greater ([24][70]) colors) of the Whitney et al. (2003) prediction for Class III sources, but these sources cannot be distinguished from galaxies with these data alone.
Figure 8 compares the cumulative 24 µm source counts per square degree found in Cha II with the SWIRE survey (Lonsdale et al. 2003; Surace et al. 2004). The histogram is limited to sources with to eliminate background stars. The plot confirms that objects that are bright at 24 µm are not likely to be extragalactic. The Cha II source counts dominate the SWIRE counts for all 24 µm sources brighter than 8 – 9 mag, and essentially no galaxies are expected to be detected with magnitudes less than 7.
4.3 MIPS–2MASS Spectral Index
The spectral index for each source with 24 µm and Ks detections was computed according to the equation:
| (1) |
A histogram of the spectral indices is shown in Figure 9. The figure does not include sources with K 13 mag in order to eliminate as much confusion from galaxies as possible. The figure shows the histograms for on-cloud and off-cloud sources as defined above for the plot of source counts (Fig. 4). Most of the sources (90%) have a spectral index less than 2.5, with an average of 2.8, which is consistent with that of main sequence stars. For clarity, the first bin of the histogram, , is not shown to its full extent. There are 233 on-cloud sources and 194 off-cloud sources in the first bin. Lada (1987) defined a near-infrared spectral index for wavelengths from 2 to 20 µm and used it to define boundaries for the Class system of YSO classification. According to Lada (1987), a spectral index greater than zero is a Class I source, is a Class II, and is a Class III. Forty-nine (10%) of the sources have indicating that these sources are possible Class I – III YSOs according to the Lada (1987) classification. All 49 are the same sources identified as potential YSOs in the Ks vs. (K[24]) plot (Fig. 5) as described above. Two sources have , IRAS 12500 and IRAS 12553, both previously classified as Class I protostars (see Section 5). Both the on-cloud and off-cloud regions contain sources with . This is not surprising since there are known T Tauri stars outside of the AV = 1 contour used to define the on-cloud region (Fig. 1). The spectral indices of the 44 YSO candidates identified in the Ks vs. (K[24]) plot are listed in Table 2. Figure 1 shows the location of the sources in Table 2 with different symbols indicating their spectral index classification.
4.4 MIPS Extended Emission
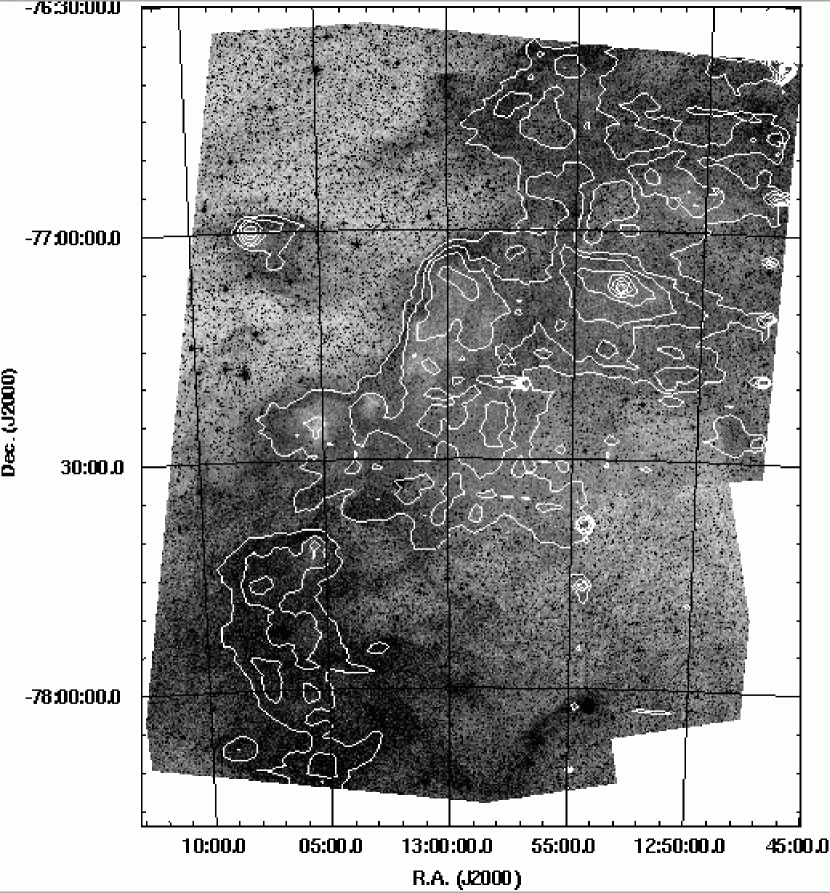
Figure 10 shows the MIPS 160 µm contours of Cha II overlaid on an Digital Sky Survey (DSS) R image of the region. The overall shape of the Cha II cloud is outlined well at both wavelengths. The MIPS 160 µm contours reveal details about the shape of the dense cores surrounding the bright IRAS sources, IRAS 12496-7650 (DK Cha, an Ae star) and IRAS 12553, at the center of the cloud. The small peak to the east of the main Cha II cloud is BHR 86, a dense core known to be harboring protostars (IRAS 13036-7644; Lehtinen & Higdon 2003). The orientation of the MIPS observations allowed BHR 86 to be observed with Cha II. However, BHR 86 was also the focus of targeted observations by the c2d team with IRAC and MIPS and will be discussed in detail in a future paper. The 160 µm contours also show gaps in the extended emission in the northern part of the cloud creating ring-like structures. The most pronounced ring in the northeast, near = 12h 55m, = 76∘ 45′, contains two classical T Tauri stars (SZ 46N and SZ 47; Chen et al. 1997). Therefore, outflows from these objects may have contributed to the formation of the ring structure. Another prominent feature in the extended emission is the gap at = 77∘ 37′ separating Cha II into two regions. A group of T Tauri stars sits on the eastern edge of the cloud near the declination of the gap (see Fig. 1) again suggesting that material may have been blown out of this area by forming stars.
The MIPS 160 µm map of Cha II was also compared to the C18O () contours of Mizuno et al. (1999). The peaks in the 160 µm emission are well matched by the peaks of C18O, especially near IRAS 12496 and IRAS 12553. The C18O map, like the 160 µm emission, shows a gap in the cloud near = 77∘ 37′. There is a hint of the ring-like structures visible in the northern part of the MIPS map in the C18O contours, but they are not easy to distinguish.
4.5 SIMBA Results
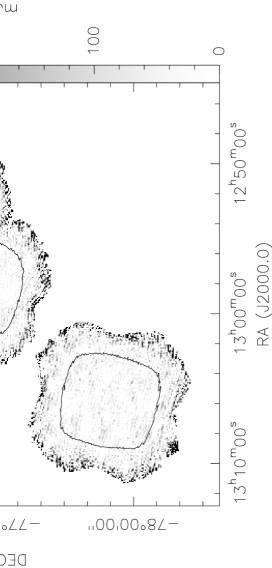
Figure 11 shows the dust continuum emission of the Cha II complex observed by SIMBA. The RMS noise level is in the center of the map, and towards half of the mapped area the noise level is below . Emission at a significant level () is only detected towards the regions associated with IRAS 12496 and IRAS 12553.
We identify the unresolved source at the highest intensity peak in the millimeter dust emission maps () with IRAS 12496; the MIPS data show no other bright nearby sources. The diffuse, second highest peak in the millimeter continuum maps () is near IRAS 12553, but offset from its MIPS position by 18″. This offset appears to be marginally significant when compared to the pointing errors toward IRAS 12496. However, we cannot exclude that the scans towards IRAS 12553 suffer from additional pointing errors. We therefore identify the mm peak with IRAS 12553, as there are no other bright nearby MIPS sources. Table 3 lists the 1 mm fluxes for several MIPS point sources that we discuss in Section 5 below as well as IRAS 12496. The fluxes were derived by integration over an aperture of 80″ diameter; the listed uncertainties reflect the statistical noise. Possible pointing errors will not significantly affect these fluxes, as the aperture is significantly larger than the expected errors. The integrated flux derived for IRAS 12553 is only marginally affected by the uncertain source position and drops by 220 mJy when the aperture is centered on the mm peak. Surprisingly, IRAS 12553 was not detected in the mm observations by Henning et al. (1993). Even when taking the extended emission surrounding IRAS 12553 into account, their chopped observations should have detected a source. No obvious explanation for the differences in the inferred fluxes exists.
Extended emission is found west of IRAS 12496 with a total flux of , and surrounding IRAS 12553 with . Assuming a dust temperature of and a dust opacity of at a wavelength of (Ossenkopf & Henning 1994; we assume a gas-to-dust ratio of 100), we derive a gas mass of for the extended gas associated with IRAS 12496, and a mass of for the gas associated with IRAS 12553. We identify these extended features with the cores 14 (for the region close to IRAS 12496) and 19 (for IRAS 12553) found by Mizuno et al. (1999), for which they quote masses of and , respectively. While for the extended gas towards IRAS 12553 the mass derived from the continuum emission and the mass derived from agree, there is a significant difference between the mass estimates for the extended gas near IRAS 12496. The different mass recovery fractions could be due to the effect of spatial filtering. If the gas near IRAS 12553 is in more compact structures than the gas near IRAS 12496, then a larger fraction of its mass will be recovered; gas significantly more extended than that near IRAS 12553 would be filtered out by the data reduction and would not show up in our maps. The different mass recovery fractions could in principle also be due to differences in the dust temperatures. If one assumes that the dust near IRAS 12496 is cooler than the dust near IRAS 12553, then the difference in their mass recovery fractions is smaller than when assuming a common dust temperature. To give an example, a common mass recovery fraction of 50% is inferred when assuming temperatures of for dust near IRAS 12496 and for dust near IRAS 12553. Our Spitzer images do not allow us to confirm such temperature differences, as the calibration for extended emission is currently uncertain.
The lack of additional detections of compact emission suggests that only a small fraction of the gas in the Cha II complex ( as estimated by Boulanger et al. (1998) from observations) is in compact structures with column densities exceeding 1022 cm-2 (corresponding to 60 mJy beam-1, the typical noise level in our maps). This is in line with Mizuno et al. (1999), who speculate that the low column densities in Cha II are responsible for the observed low star-formation activity.
5 Selected Sources in Cha II
In this section, we highlight a few interesting sources, mainly YSOs, in the Cha II cloud. Most of the sources were originally selected from the MIPS data because they are brighter at 70 µm than 24 µm. 2MASS 12560549-7654106 and 2MASS 13125238-7739182 were selected from Figure 5 as previously unknown YSO candidates as described in Section 4.2. C41 was chosen because it was recently noted in the literature by Barrado y Navascués & Jayawardhana (2004).
We present full SEDs, including c2d data from IRAC (Porras et al. 2005, in preparation), and some basic physical properties of each source. MIPS positions and fluxes for these sources are listed in Table 2 and the positions are also marked as black squares on Figure 1. SEDs including optical, 2MASS (Cutri et al., 2003), IRAC, ISO (Persi et al., 2003), IRAS (IRAS PSC, 1988), MIPS, and millimeter continuum (as described in this work and Henning et al. 1993) data where available are shown in Figure 12, and the fluxes are listed in Table 3. We calculate bolometric luminosities for the sources based on the SEDs shown assuming that the sources are at the distance of Cha II.
The complementary optical data in the R, I, and z bands were obtained using the wide-field imager at the ESO 2.2 m telescope at La Silla, Chile. The data reduction and photometric calibration were performed as described in Alcalá et al. (2004). The photometric calibration for the z-band was performed using A0-type standards observed at an airmass very close to 1. The typical seeing was on the order of 0.9″. The source extraction was performed both using DAOPHOT with PSF methods within the IRAF environment and SExtractor (Bertin & Arnouts 1996) with consistent results. More details on these observations will be published in a paper elsewhere (Alcalá et al. 2005, in preparation).
5.1 IRAS 12500-7658 / SSTc2d J125342.8-771512
IRAS 12500-7658 (Prusti et al., 1992) was previously detected by 2MASS (12534285-7715114) and is also visible with IRAC and MIPS. Our SIMBA 1.2 mm map was not sensitive enough to detect IRAS 12500. However, Henning et al. (1993) detected the source at 1.3 mm and classified it as an embedded object. Chen et al. (1997) found this source has a bolometric temperature, , of 94 K, classifying it as a Class I object according to the scheme of Chen et al. (1995) where Class I objects have 70 K 650 K. This source is an outlier on the 2MASS-MIPS color plots (Fig. 5 & 6), because it has a very red (K[24]) color of 9.6 mag. The only source with a similarly large (K[24]) color is a Class I object (IRAS 12553; see Section 5.3). IRAS 12500 also has a redder ([24][70]) color (3.3 mag) than most of the 24 µm bright sources so that it is closer to Class I objects (IRAS 12553 and IRAS 13036) in the [24] vs. ([24][70]) color-magnitude diagram (Fig. 7) than the bluer Class II objects. Further, IRAS 12500 has a positive (0.79) also indicating it is a Class I object. Therefore, the MIPS data are consistent with previous classifications of IRAS 12500 as a Class I protostar. We calculate a bolometric luminosity, , from the SED in Figure 12 of 0.5 L⊙ for IRAS 12500.
5.2 2MASS 12545753-7649400 / SSTc2d J125457.5-764940
2MASS 12545753-7649400 does not have an IRAS source associated with it, but was detected in all IRAC bands as well as MIPS bands 1 and 2. It has a rising SED as illustrated in Figure 12. However, 2MASS 125457 has a Ks magnitude of 14.2, placing it within the galaxy parameter space on the Ks versus (K[24]) plot (Fig. 5). This source also has a [24] magnitude of 6.8, which is fainter than most YSOs but consistent with galaxies (Fig. 7). Further, it appears slightly elongated in the IRAC images and clearly looks like a galaxy in the I band image. We conclude that this source is a galaxy, but include it here to illustrate the difficulty of distinguishing YSOs from galaxies based solely on rising SEDs in the mid-infrared. Other diagnostics with data from different wavelengths are needed, such as the color-magnitude diagrams presented here, to begin to separate galaxies from YSOs in MIPS data.
5.3 IRAS 12553-7651 / SSTc2d J125906.6-770740
IRAS 12553 (ISO-ChaII-28) is one of the brightest FIR sources in Cha II and was the target of a near-IR and ISOCAM study by Persi et al. (2003). It was also detected by 2MASS (12590656-7707401), IRAS (12553-7651; Gauvin & Strom 1992), and at 1.2 mm with SIMBA (see Section 4.5). Chen et al. (1997) reported this source has = 99 K, classifying it as a Class I object. Persi et al. (2003) also classified this source as a Class I protostar based on its spectral index ( = 1) with = 1.49 L⊙. We find = 1.8 L⊙ for IRAS 12553 from the SED in Figure 12. The MIPS data confirm the previous classifications of IRAS 12553. This source, like IRAS 12500, has a redder ([24][70]) color (3.5 mag) than known Class II sources (see Fig. 7). IRAS 12553 also has a very red (K[24]) color (9.5 mag) in Figure 5. Further, we also find a positive spectral index for this source ( = 0.76) classifying it as a Class I source.
5.4 C41 / SSTc2d J125909.7-765104
C41 was recently proposed to be a classical T Tauri object, with a spectral type of M5.5, near the sub-stellar boundary by Barrado y Navascués & Jayawardhana (2004). They observed broad H emission, a variety of forbidden lines, and Li I absorption toward C41, which was originally identified as a low-mass YSO candidate by Vuong, Cambrésy, & Epchtein (2001). It has been detected by 2MASS (12590984-7651037), IRAC, and MIPS. C41 is also possibly associated with IRAS 12554-7635 (plotted with the SED for C41 in Figure 12), which has a of 81 K (Chen et al., 1997) and was classified by Gauvin & Strom (1992) as a Class I source. However, the IRAS 60 and 100 µm fluxes for IRAS 12554 are significantly larger than the MIPS 70 µm flux of C41 (Fig. 12 and Table 3) and may be confused. Including the IRAS fluxes in the SED, = 0.10 L⊙, and without the IRAS fluxes C41 has an of 0.08 L⊙. C41 has a very red (K[24]) color (7.3 mag) but its color lies between known Class I and Class II sources in Figure 5. In Figure 7, C41 is in the same region as known Class II sources, because its ([24][70]) color is only 2.1 mag.
5.5 2MASS 12560549-7654106 / SSTc2d J125605.5-765411
2MASS 12560549-7654106 was identified by its Ks magnitude (11 mag) and (K[24]) color (2.0 mag) in Figure 5 as a potential YSO candidate. It also has an which suggests it is a Class III source. However, the Ks magnitude of 11 is fainter than that of typical T Tauri stars at the distance of Cha (Ks = 8.5 – 9.5 mag; Gauvin & Strom 1992). 2MASS 125605 could not be found in a search of the literature for known YSOs. It was observed by IRAC, 2MASS, and in the optical, and has an of only 0.05 L⊙. We compared the SED to a stellar model SED for R to 24 µm. The model is of a star extincted by about AV = 6 mag and uses the dust of Weingartner & Draine (2001) with a visual extinction to reddening ratio of = 5.5. The SEDs of 2MASS 125605 and the model are plotted in Figure 12. The error bars on the model include uncertainties in the AV and in the spectral type of the star. The SED of 2MASS 125605 is well matched by the stellar SED between R and 8 µm. However, the 24 µm flux exceeds the stellar model prediction by almost a factor of 4. This possible excess and the star’s projected position on the cloud suggest that 2MASS 125605 may be a previously unknown YSO with a disk in Cha II. Further observations are needed to confirm its age and excess.
5.6 2MASS 13125238-773918 / SSTc2d J131252.3-773918
2MASS 13125238-7739182 was also identified from the 2MASS–MIPS color magnitude plot (Fig. 5) as a potential YSO with (K[24]) = 3.1 mag and Ks = 10.5 mag, but has no previous identification in the literature. This source is also fainter at Ks than typical T Tauri stars (Ks = 8.5 – 9.5 mag; Gauvin & Strom 1992). Its spectral index, , classifies 2MASS 131252 as a Class II object. This source was outside the c2d IRAC observation area in Cha II, so only optical, 2MASS, and MIPS data are available. From its SED, we calculate a low luminosity for 2MASS 131252 of = 0.1 L⊙. We also compared the SED of this source with that of a model of an extincted star. The 24 µm flux of 2MASS 131252 is more than a factor of 10 greater than that expected from a star with AV of about 6 mag. This excess suggests that 2MASS 131252 may be a previously unknown YSO with a disk. As with 2MASS 125605, further observations are needed to confirm this conclusion.
6 Summary
We have presented a map of the Cha II molecular cloud at 24, 70, and 160 µm as observed by the Spitzer Space Telescope instrument MIPS (Fig. 2) and described the c2d Legacy team’s data processing in detail including removal of artifacts, mosaicking, source extraction, and bandmerging. We detected over 1500 sources at 24 µm in an area of a little over 1.5 square degrees.
Bandmerging the source list with 2MASS and the resulting color-magnitude diagram (Fig. 5) allowed for identification of some of the sources. Galaxies are found to be defined mostly by faint Ks magnitudes ( 13 mag). Forty-four sources were found to have Ks 13 mag and (K[24]) 1 mag and identified as potential YSOs. A (HKs) versus (K[24]) color-color diagram (Fig. 6) was found to be ineffective in identifying YSOs because of confusion with galaxies. In a [24] versus ([24][70]) color-magnitude plot (Fig. 7), the data were compared with models of YSOs from Whitney et al. (2003) and Young & Evans (2005) and found to be bluer than predicted by the models. Calculating a spectral index after the method of Lada (1987), revealed that the same sources identified as YSO candidates in the Ks vs. (K[24]) diagram have 2.5, providing more evidence that they are YSOs and confirming their identification in the literature. Of these 44 YSO candidates, 4 have not been previously identified in the literature as YSOs or candidates. The small number of new YSO candidates found with the improved sensitivity of MIPS over previous surveys suggests that most of the YSOs in Cha II are already known. However, future work combining IRAC and MIPS data may reveal more new low luminosity YSOs.
A SIMBA dust continuum emission map of Cha II revealed significant emission towards the regions of IRAS 12496 and IRAS 12553 only. The lack of further detections suggests that only a small fraction of the gas is in compact structures with high column density. The extended emission at 160 µm was found to be similar to IRAS and C18O (Mizuno et al., 1999) maps of Cha II.
The SEDs of several YSOs associated with Cha II are presented including the Class I sources IRAS 12553 and IRAS 12500 (Fig. 12). The SEDs of two new potential YSOs, 2MASS 125605 and 2MASS 131252, were compared with a stellar model and found to have excesses at 24 µm indicating the likely presence of a disk. Follow-up observations are needed to confirm the classification of these previously unknown sources.
Future work will combine the MIPS and SIMBA data sets with optical, near- and mid-infrared, including IRAC, observations of Cha II in order to study star formation in the cloud in greater depth. The combined data sets will also allow for better identification and classification of the protostellar and young stellar populations in Cha II.
7 Acknowledgments
We would like to thank M. Vuong for providing her extinction map of Cha II. Support for this work, part of the Spitzer Legacy Science Program, was provided by NASA through contracts 1224608, 1230782, and 1230779 issued by the Jet Propulsion Laboratory, California Institute of Technology, under NASA contract 1407. KEY was supported by NASA under Grant No. NGT5-50401 issued through the Office of Space Science. Astrochemistry in Leiden is supported by a NWO Spinoza grant and a NOVA grant. This publication makes use of data products from the Two Micron All Sky Survey, which is a joint project of the University of Massachusetts and the Infrared Processing and Analysis Center/California Institute of Technology, funded by NASA and the National Science Foundation.
References
- Alcalá et al. (2000) Alcalá, J. M., Covino, E., Sterzik, M. F., Schmitt, J. H. M. M., Krautter, J., & Neuhäuser, R. 2000, A&A, 355, 629
- Alcalá et al. (2004) Alcalá, J. M., Wachter, S., Covino, E., Sterzik M. F., Durisen R. H., Freyberg M., Hoard D. W., & Cooksey K. 2004, A&A, 416, 677
- Barrado y Navascués & Jayawardhana (2004) Barrado y Navascués, D. & Jayawardhana, R. 2004, ApJ, 615, 280
- Bertin & Arnouts (1996) Bertin E. & Arnouts S. 1996, A&AS, 117, 393
- Boulanger et al. (1998) Boulanger, F., Brofman, L., Dame, T. M., & Thaddeus, P. 1998, A&A, 332, 273
- Bourke et al. (1995) Bourke, T. L., Hyland, A. R., Robinson, G., James, S. D., & Wright, C. M. 1995, MNRAS, 276, 1067
- Cambrésy (1999) Cambrésy, L. 1999, A&A, 345,965
- Chen et al. (1997) Chen, H., Grenfell, T. G., Myers, P. C., Hughes, J. D. 1997, ApJ, 478, 295
- Chen et al. (1995) Chen, H., Myers, P. C., Ladd, E. F., & Wood, D. O. S. 1995, ApJ, 445, 377
- Cutri et al. (2003) Cutri, R. M., et al. 2003, Explanatory Supplement to the 2MASS All Sky Data Release, (Pasadena: IPAC), http://www.ipac.caltech.edu/2mass/releases/allsky/doc/explsup.html
- Evans et al. (2003) Evans, N. J., II, et al. 2003, PASP, 115, 965
- Evans et al. (2004) Evans, N. J., II, et al. 2004, First Delivery of Data from the c2d Legacy Project, (Pasadena: Spitzer Science Center), http://ssc.spitzer.caltech.edu/legacy/
- Gauvin & Strom (1992) Gauvin, L. S. & Strom, K. M. 1992, ApJ, 385, 217
- Gordon et al. (2005a) Gordon, K. D., et al. 2005a, PASP, in press, astro-ph/0502079
- Gordon et al. (2005b) Gordon, K. D., et al. 2005b, astro-ph/0502080
- Henning et al. (1993) Henning, Th., Pfau, W., Zinnecker, H., and Prusti, T. 1993, A&A, 276, 129
- Hughes & Hartigan (1992) Hughes, J. & Hartigan, P. 1992, AJ, 104, 680
- IRAS PSC (1988) IRAS PSC 1988, ed. C. Beichmann et al. (NASA RP-1190; Washington: GPO)
- Knee (1992) Knee, L. B. G. 1992, A&A, 259, 283
- Lada (1987) Lada, C. J. 1987, in IAU Symp. 115, Star Formation Regions, ed. M. Peimbert & J. Jugaku (Dordrecht: Reidel), 1
- Lehtinen & Higdon (2003) Lehtinen, K. & Higdon, J. L. 2003, A&A, 398, 583
- Liseau et al. (1996) Liseau, R. et al. 1996, A&A, 315, L181
- Lonsdale et al. (2003) Lonsdale, C. J. et al. 2003, PASP, 115, 897
- Makovoz (2004) Makovoz, D. 2004, Spitzer Mosaicker Version 1.6, (Pasadena: Spitzer Science Center), http://ssc.spitzer.caltech.edu/postbcd/
- Mardones et al. (1997) Mardondes, D., Myers, P. C., Tafalla, M., Wilner, D. J., Bachiller, R., & Garay, G. 1997, ApJ, 489, 719
- Marleau et al. (2004) Marleau, F. R., et al. 2004, ApJS, 154, 66
- Masci et al. (2005) Masci, F. J., Laher, R., Fang, F., Fowler, J., Lee, W., Stolovy, S., Padgett, D. & Moshir, M. 2005, ASP Conference Series, Astronomical Data Analysis Software and Systems XIV, eds. Shopbell, P. L., Britton, M. C., & Ebert, R. http://xxx.lanl.gov/abs/astro-ph/0411316
- Mizuno et al. (1995) Mizuno, A., Onishi, T., Yonekura, Y., Nagahama, T., Ogawa, H., Fukui, Y. 1995, ApJ, 445, L161
- Mizuno et al. (1999) Mizuno, A., et al. 1999, PASJ, 51, 859
- Neufeld, Melnick, & Harwit (1998) Neufeld, D. A., Melnick, G. J., Harwit, M. 1998, ApJ, 506, L75
- Onishi et al. (1996) Onishi, T., Mizuno, A., Kawamura, A., Ogawa, H., Fukui, Y. 1996, ApJ, 465, 815
- Ossenkopf & Henning (1994) Ossenkopf, V. & Henning, Th. 1994, A&A, 291, 943
- Persi et al. (2003) Persi, P., Marenzi, A. R., Gomez, M. & Olofsson, G. 2003, A&A, 399, 995
- Press et al. (1997) Press, W. H., Teukolsky, S. A., Vetterling, W. T., & Flannery, B. P. 1997, Numerical Recipes in C, (Cambridge:Cambridge U. Press)
- Prusti et al. (1992) Prusti, T, Wittet, D. C. B., Assendorp, R., & Wesselius, P. R. 1992, A&A, 260, 151
- Rieke et al. (2004) Rieke, G. et al. 2004, ApJS, 154, 25
- Schechter, Mateo, & Saha (1993) Schechter, P.L., Mateo, M., & Saha, A. 1993, PASP, 105, 693
- Schwartz (1977) Schwartz, R. D. 1977, ApJS, 35, 161
- Sivia (1996) Sivia, D. S. 1996, Data Analysis: A Bayesian Tutorial, (Oxford: Clarendon Press)
- MIPS Data Handbook (2004) Spitzer Space Telescope Multiband Imaging Photometer for Spitzer (MIPS) Data Handbook Version 1.1, 2004, (Pasadena: Spitzer Science Center), http://ssc.spitzer.caltech.edu/mips/
- Spitzer Observer’s Manual (2004) Spitzer Space Telescope Observers Manual - Version 5.0, 2004, (Pasadena: Spitzer Science Center), http://ssc.spitzer.caltech.edu/documents/
- Surace et al. (2004) Surace, J. A. et al. 2004, The SWIRE ELAIS N1 Image Atlases and Source Catalogs, (Pasadena: Spitzer Science Center), http://ssc.spitzer.caltech.edu/legacy/
- Tachihara, Mizuno & Fukui (2000) Tachihara, K., Mizuno, A., & Fukui, Y. 2000, ApJ, 528, 817
- Vuong, Cambrésy, & Epchtein (2001) Vuong, M. H., Cambrésy, L. & Epchtein, N. 2001, A&A, 379, 208
- Wainscoat et al. (1992) Wainscoat, R. J., Cohen, M., Volk, K., Walker, H. J., & Schwartz, D. E. 1992, ApJS, 83, 111
- Whitney et al. (2003) Whitney, B. A., Wood, K., Bjorkman, J. E., & Cohen, M. 2003, ApJ, 598, 1079
- Whittet et al. (1991) Whittet, D. C. B., Assendorp, R., Prusti, T., Wesselius, P. R., & Roth, M. 1991, A&A, 251, 524
- Whittet et al. (1997) Whittet, D. C. B., Prusti, T., Franco, G. A. P., Gerakines, P. A., Kilkenny, D., Larson, K. A., & Wesselius, P. R. 1997, A&A, 327, 1194
- Weingartner & Draine (2001) Weingartner, J. C. & Draine, B. T. 2001, ApJ, 548, 296
- Young & Evans (2005) Young, C. H. & Evans, N. J., II 2005, ApJ, in press, astro-ph/0503456
- Yun et al. (1999) Yun, J. L., Moreira, M. C., Afonso, J. M., & Clemens, D. P. 1999, ApJ, 118, 990


| (0) | |
|---|---|
| (µm) | (Jy) |
| 24 | 7.24 |
| 70 | 0.81 |
| c2d Name | Other Name(s) | RA (J2000)aaPositions are from the 24 µm map. | Dec (J2000)aaPositions are from the 24 µm map. | 24µm()bb is the flux uncertainty calculated using c2dphot as described in Section 3.1.4. The absolute uncertainty in the flux is closer to 10% at 24 µm and 20% at 70 µm. | 70µm()bb is the flux uncertainty calculated using c2dphot as described in Section 3.1.4. The absolute uncertainty in the flux is closer to 10% at 24 µm and 20% at 70 µm. | Ref.cc1: Gauvin & Strom (1992), 2: Prusti et al. (1992), 3: Vuong, Cambrésy, & Epchtein (2001), 4: This work, 5: Chen et al. (1997), 6: Persi et al. (2003) | |
|---|---|---|---|---|---|---|---|
| (h m s) | (∘ ′ ″) | (mJy) | (mJy) | ||||
| SSTc2d J124505.8-772014 | IRAS12416-7703 | 12 45 07.0 | 77 20 13.8 | 1590(100) | 102(8.3) | 1.29 | 1 |
| SSTc2d J124825.7-770637 | IRAS12448-7650 | 12 48 25.6 | 77 06 36.9 | 331(2.8) | – | 2.18 | 2 |
| SSTc2d J125217.2-780038 | IRASF12486-7744 | 12 52 17.5 | 78 00 37.4 | 29.6(0.23) | – | 2.44 | 2 |
| SSTc2d J125230.6-771513 | IRASF12488-7658/C13 | 12 52 30.5 | 77 15 13.3 | 34.7(0.20) | – | 2.33 | 3 |
| SSTc2d J125342.8-771512 | IRAS12500-7658 | 12 53 42.6 | 77 15 10.3 | 687(4.2) | 1630(100) | 0.79 | 2 |
| SSTc2d J125605.5-765411 | 2MASS12560549-7654106 | 12 56 05.2 | 76 54 10.6 | 1.81(0.09) | – | 2.10 | 4 |
| SSTc2d J125633.6-764545 | Sz46N | 12 56 33.6 | 76 45 45.6 | 57.1(0.28) | – | 1.16 | 5 |
| SSTc2d J125658.7-764707 | Sz47 | 12 56 58.5 | 76 47 07.2 | 1.11(0.07) | – | 1.84 | 5 |
| SSTc2d J125711.7-764011 | IRAS12535-7623/CHIIXR2 | 12 57 11.5 | 76 40 10.5 | 430(3.5) | 147(12) | 0.84 | 2 |
| SSTc2d J125806.8-770909 | ISO-ChaII-13 | 12 58 06.7 | 77 09 09.6 | 8.39(0.14) | – | 0.87 | 6 |
| SSTc2d J125906.6-770740 | IRAS12553-7651/ISO-ChaII-28 | 12 59 06.4 | 77 07 40.0 | 2500(100) | 6720(290) | 0.76 | 6 |
| SSTc2d J125909.7-765104 | C41 | 12 59 10.4 | 76 51 03.1 | 165(1.2) | 123(9.7) | 0.10 | 3 |
| SSTc2d J125926.4-774709 | IRAS12556-7731 | 12 59 26.3 | 77 47 08.8 | 294(1.2) | – | 1.70 | 2 |
| SSTc2d J130053.1-765416 | ISO-ChaII-55/Sz49/CHIIXR9 | 13 00 53.2 | 76 54 14.9 | 132(0.86) | 131(8.8) | 0.47 | 6 |
| SSTc2d J130053.3-770909 | ISO-ChaII-51/Sz48/CHIIXR7 | 13 00 53.4 | 77 09 08.9 | 96.6(0.40) | – | 1.06 | 6 |
| SSTc2d J130055.3-771022 | ISO-ChaII-52/Sz50/CHIIXR8 | 13 00 55.5 | 77 10 20.3 | 416(2.2) | 604(31) | 0.68 | 6 |
| SSTc2d J130059.3-771403 | ISO-ChaII-54/CHIIXR10/C48 | 13 00 59.5 | 77 14 03.1 | 566(3.4) | 288(15) | 0.87 | 6, 3 |
| SSTc2d J130158.9-775122 | Sz51 | 13 01 58.4 | 77 51 19.9 | 123(0.57) | 109(8.4) | 0.99 | 5 |
| SSTc2d J130213.5-763758 | IRAS12584-7621/CM Cha | 13 02 13.9 | 76 37 57.8 | 416(2.1) | 411(22) | 0.81 | 2 |
| SSTc2d J130222.8-773449 | C50 | 13 02 22.8 | 77 34 49.7 | 8.07(0.10) | – | 1.34 | 3 |
| SSTc2d J130247.5-770240 | IRAS12589-7646 | 13 02 47.6 | 77 02 40.1 | 209(2.0) | – | 2.16 | 2 |
| SSTc2d J130423.9-765002 | Hn23 | 13 04 23.6 | 76 50 03.3 | 226(4.1) 3 | 448(24) | 0.96 | 5 |
| SSTc2d J130424.9-775230 | Sz52 | 13 04 24.9 | 77 52 30.6 | 49.0(0.19) | – | 0.89 | 5 |
| SSTc2d J130455.7-773950 | Hn24 | 13 04 55.9 | 77 39 49.5 | 280(1.9) | 243(13) | 0.82 | 5 |
| SSTc2d J130508.5-773343 | Hn25/C53 | 13 05 08.4 | 77 33 42.9 | 79.0(0.90) | – | 0.96 | 5, 3 |
| SSTc2d J130512.7-773052 | Sz53 | 13 05 12.5 | 77 30 52.9 | 91.6(0.66) | – | 0.90 | 5 |
| SSTc2d J130520.6-773902 | Sz54 | 13 05 20.8 | 77 39 00.9 | 299(1.4) | 284(14) | 1.30 | 5 |
| SSTc2d J130630.3-773401 | Sz55 | 13 06 30.4 | 77 34 00.4 | 29.4(0.21) | – | 0.99 | 5 |
| SSTc2d J130638.5-773036 | Sz56 | 13 06 38.7 | 77 30 35.6 | 56.7(0.22) | – | 0.91 | 5 |
| SSTc2d J130656.5-772310 | Sz57/C60 | 13 06 56.5 | 77 23 09.7 | 36.7(0.17) | – | 1.33 | 5, 3 |
| SSTc2d J130657.4-772342 | IRAS13030-7707/C61/Sz58 | 13 06 57.2 | 77 23 39.6 | 386(1.9) | 636(39) | 0.75 | 3 |
| SSTc2d J130709.0-773031 | Sz59 | 13 07 09.1 | 77 30 30.7 | 265(1.5) | – | 1.05 | 5 |
| SSTc2d J130718.0-774053 | C62 | 13 07 18.0 | 77 40 53.2 | 14.3(0.10) | – | 1.02 | 3 |
| SSTc2d J130722.8-773724 | Sz60 | 13 07 22.4 | 77 37 22.6 | 63.8(0.74) | – | 1.19 | 5 |
| SSTc2d J130748.5-774121 | Hn26 | 13 07 48.4 | 77 41 21.7 | 68.1(0.27) | – | 0.98 | 5 |
| SSTc2d J130806.2-775505 | Sz61 | 13 08 06.4 | 77 55 04.9 | 724(4.2) | 572(27) | 0.79 | 5 |
| SSTc2d J130827.2-774323 | C66 | 13 08 27.2 | 77 43 23.5 | 5.85(0.09) | – | 1.13 | 3 |
| SSTc2d J130910.3-770944 | IRASF13052-7653/CHIIXR60 | 13 09 09.9 | 77 09 43.8 | 122(1.6) | – | 0.89 | 2 |
| SSTc2d J130950.3-775724 | Sz62 | 13 09 50.3 | 77 57 24.3 | 130(0.88) | – | 1.06 | 5 |
| SSTc2d J131004.3-771045 | Sz63 | 13 10 04.2 | 77 10 44.9 | 42.1(1.1) | – | 1.04 | 5 |
| SSTc2d J131025.3-772909 | 2MASS13102531-7729085 | 13 10 25.3 | 77 29 08.6 | 3.84(0.10) | – | 1.13 | 4 |
| SSTc2d J131103.3-765333 | 2MASS13110329-7653330 | 13 11 03.3 | 76 53 33.1 | 1.56(0.11) | – | 1.71 | 4 |
| SSTc2d J131252.3-773918 | 2MASS13125238-7739182 | 13 12 52.3 | 77 39 18.1 | 7.89(0.08) | – | 1.68 | 4 |
| SSTc2d J131403.5-775308 | Sz64 | 13 14 03.6 | 77 53 07.9 | 37.2(0.18) | – | 0.91 | 5 |
| Name(s) | Flux()aaFor the IRAC and MIPS 24 and 70µm data, is the flux uncertainty calculated using c2dphot as described in Section 3.1.4. The absolute uncertainty in the flux is closer to 10% at 24 µm and 20% at 70 µm. The 160 µm reflects a flux uncertainty of 20%. The 1.2 mm reflects the statistical noise. | Ref.bb1: This work, 2: Cutri et al. (2003), 3: IRAS PSC (1988), 4: Henning et al. (1993), 5: Persi et al. (2003) | |
|---|---|---|---|
| (µm) | (mJy) | ||
| IRAS 12496-7650/DK ChaccIRAS 12496 is saturated at 24 and 160 µm. | 70 | 36100(1200) | 1 |
| 1200 | 1470(120)dd1.2 mm fluxes are aperture fluxes with a 80″ diameter aperture. | 1 | |
| IRAS 12500-7658 | 0.643 | 0.0099(0.0009) | 1 |
| 0.805 | 0.061(0.002) | 1 | |
| 0.965 | 0.11(0.006) | 1 | |
| 1.25 | 0.869(0.06) | 2 | |
| 1.6 | 3.56(0.14) | 2 | |
| 2.2 | 9.19(0.20) | 2 | |
| 3.6 | 20.0(0.19) | 1 | |
| 4.5 | 25.6(0.21) | 1 | |
| 5.8 | 35.6(0.23) | 1 | |
| 8 | 51.0(0.29) | 1 | |
| 12 | 110(22) | 3 | |
| 24 | 687(4.2) | 1 | |
| 25 | 900(180) | 3 | |
| 60 | 3630(730) | 3 | |
| 70 | 1630(100) | 1 | |
| 100 | 5060(1100) | 3 | |
| 160ee160 µm fluxes are aperture fluxes with a 40″ diameter aperture. | 11800(2400) | 1 | |
| 1200dd1.2 mm fluxes are aperture fluxes with a 80″ diameter aperture. | 260ff2- upper limit. | 1 | |
| 1300 | 59.7(15) | 4 | |
| 2MASS 12545753-7649400 | 0.643 | .0896(0.005) | 1 |
| 0.805 | 0.309(0.01) | 1 | |
| 0.965 | 1.67(0.15) | 1 | |
| 1.25 | 0.407(0.05) | 2 | |
| 1.6 | 1.04(0.11) | 2 | |
| 2.2 | 1.37(0.12) | 2 | |
| 3.6 | 0.92(0.07) | 1 | |
| 4.5 | 0.76(0.05) | 1 | |
| 5.8 | 1.14(0.07) | 1 | |
| 8 | 7.37(0.27) | 1 | |
| 24 | 14.5(0.18) | 1 | |
| 70 | 302(16) | 1 | |
| 2MASS 12560549-7654106 | 0.643 | 1.27(0.011) | 1 |
| 0.805 | 3.89(0.033) | 1 | |
| 0.965 | 6.34(0.11) | 1 | |
| 1.25 | 16.3(0.31) | 2 | |
| 1.6 | 27.7(0.51) | 2 | |
| 2.2 | 25.4(0.40) | 2 | |
| 3.6 | 14.2(0.12) | 1 | |
| 4.5 | 9.54(0.09) | 1 | |
| 5.8 | 6.50(0.06) | 1 | |
| 8 | 3.31(0.04) | 1 | |
| 24 | 1.81(0.09) | 1 | |
| IRAS 12553-7651/ISO-ChaII-28 | 1.25 | 0.29 | 2 |
| 1.6 | 2.83(0.11) | 2 | |
| 2.2 | 36.2(0.70) | 2 | |
| 3.6 | 219(3.2) | 1 | |
| 4.5 | 342(9.3) | 1 | |
| 5.8 | 667(5.8) | 1 | |
| 6.7 | 793(26) | 5 | |
| 8 | 514(10) | 1 | |
| 12 | 700(70) | 3 | |
| 14.3 | 1190(25) | 5 | |
| 24 | 2500(100) | 1 | |
| 25 | 4430(220) | 3 | |
| 60 | 10600(530) | 3 | |
| 70 | 6720(280) | 1 | |
| 100 | 18100(5400) | 3 | |
| 160ee160 µm fluxes are aperture fluxes with a 40″ diameter aperture. | 27200(2700) | 1 | |
| 1200dd1.2 mm fluxes are aperture fluxes with a 80″ diameter aperture. | 1910(130) | 1 | |
| C41 | 0.643 | 0.121(0.002) | 1 |
| 0.805 | 0.40(0.007) | 1 | |
| 0.965 | 0.69(0.012) | 1 | |
| 1.25 | 2.66(0.12) | 2 | |
| 1.6 | 9.64 | 2 | |
| 2.2 | 19.0 | 2 | |
| 3.6 | 22.3(0.32) | 1 | |
| 5.8 | 31.7(0.22) | 1 | |
| 12 | 90(18) | 3 | |
| 24 | 165(1.2) | 1 | |
| 25 | 160(32) | 3 | |
| 60 | 360(72) | 3 | |
| 70 | 123(9.7) | 1 | |
| 100 | 3030(610) | 3 | |
| 2MASS 13125238-7739182 | 0.643 | 2.21(0.019) | 1 |
| 0.805 | 9.08(0.24) | 1 | |
| 0.965 | 15.1(0.54) | 1 | |
| 1.25 | 40.3(0.85) | 2 | |
| 1.6 | 46.6(1.1) | 2 | |
| 2.2 | 40.4(0.78) | 2 | |
| 24 | 7.89(0.08) | 1 |