The dark halo of the main lens galaxy in QSO 0957+561
Abstract
We present an analysis of infrared/optical/ultraviolet spectra of the two images
of the first gravitationally lensed quasar Q0957+561A, B. The Hubble Space
Telescope observations of Q0957+561A and Q0957+561B are separated in time by the
known time delay in this system, so we can directly deduce the flux ratios. These
flux ratios of images lead to important information on the dark halo of the main
lens galaxy (a giant elliptical at redshift = 0.36). Our measurements for the
continuum are in good agreement with extinction in the elliptical galaxy and a
small fraction of mass in collapsed objects (no need for gravitational
microlensing). From the continuum and emission line ratios, we also show evidence
in favour of the existence of a network of compact dusty clouds.
This is a preprint of an Article accepted for publication in MNRAS Letters
2005 Royal Astronomical Society
keywords:
Gravitational lensing – dark matter – dust, extinction – galaxies: haloes – galaxies: elliptical and lenticular, cD – quasars: individual: QSO 0957+5611 Introduction
The populations of galaxy dark haloes may include collapsed objects (black holes, brown dwarfs, etc.) as well as non-collapsed structures and elementary particles (e.g., Jetzer 1999). While some experiments suggest that the Milky Way dark halo is not dominated by collapsed objects with stellar or substellar mass (Alcock et al. 1998, 2000; Lasserre et al. 2000; Alcock et al. 2001), the populations of relatively far galaxies are still largely unknown. Therefore, extragalactic studies are crucial to reveal the nature of dark matter.
The double (gravitationally lensed) quasar Q0957+561A, B (at redshift = 1.41) was discovered 25 years ago in a radio survey (Walsh, Carswell & Weymann 1979). At optical wavelengths, the main lens galaxy in the system (at redshift = 0.36) appears as an extended source close to the image B. This giant elliptical galaxy is part of a cluster of galaxies that also contributes to the lensing (Stockton 1980; Garrett, Walsh & Carswell 1992). The angular separation between the B image and the centre of the galaxy is only of 1 arcsec, whereas the angular separation between the A image and the galaxy is about five times larger (Bernstein et al. 1997). This translates in that the light rays associated with the images A and B are characterized by two different impact parameters, 18 kpc and 3–4 kpc, respectively, so the two beams are embedded in the galaxy halo and might unveil the structure of the dark matter in the cD galaxy. The beams may be affected by gravitational microlensing by stars and/or collapsed dark objects (Chang & Refsdal 1979), and/or extinction by clouds of gas and dust. Hence, the spectra and/or light curves of the quasar images could reveal the dark content of the galaxy. We consider the concordance model of the Universe (70% of the cosmos is thought to be dark energy, = 0.7, and 30% matter, = 0.3), and is the normalized Hubble constant (0.5 1).
When multiwavelength observations of the two images are separated in time by the known time delay in the system (e.g., Serra–Ricart et al. 1999), one obtains the flux ratios in a proper way (Schild & Smith 1991). The standard gravitational scenario predicts the existence of an achromatic and stationary flux ratio of images, i.e., the macrolens flux ratio (Schneider, Ehlers & Falco 1992), but the observations of multiple quasars often disagree with this standard prediction (e.g., Nadeau et al. 1991; Jaunsen & Hjorth 1997; Burud et al. 2000). Flux ratio anomalies are thus basic tools to investigate lens galaxy haloes. In this paper (Section 2) we describe the relevant Hubble Space Telescope (HST) spectra for the two components Q0957+561A, B. In Section 3, we measure and interprete a large collection of infrared/optical/ultraviolet flux ratios. Finally, Section 4 summarizes our main conclusions.
2 HST spectra
Spectra of Q0957+561A and Q0957+561B were obtained in 1999 April 15 and 2000 June 2–3, respectively, with the Space Telescope Imaging Spectrograph (STIS) on board the HST. The spectra of each image cover a wide range of wavelengths, from the near–infrared (NIR) to the ultraviolet (UV), since the G230L, G430L and G750L gratings were used in the experiment. The central wavelengths of these gratings are 0.24 m (G230L), 0.43 m (G430L) and 0.77 m (G750L). A 52 0.2 arcsec2 slit was also used in each observation.
The final data (flux vs. wavelength) are calibrated with the last version of the CALSTIS pipeline software, so the corrections for time–dependent sensitivity of the MAMA detectors (which is relevant for the G230L observations) as well as for charge–transfer efficiency of the CCD detector (relevant for the G430L and G750L observations) are incorporated. We also note that the HST–STIS data of the two images do not incorporate any correction for cross–contamination of the spectra and contamination by the lens galaxy. However, the cross–contamination of the spectra and the contamination by the galaxy light at the bluest wavelengths are expected to be negligible. The possible contamination of Q0957+561B (due to its proximity to the galaxy) only must be checked at the reddest wavelengths. In the next section, using complementary photometric observations, we test the HST–STIS continuum flux ratios at 0.54–0.65 m.
3 Flux ratios
3.1 Continuum emission
We firstly focus on the continuum in the wavelength range 0.22-1 m. The data cover the interval 0.09 0.41 m in the rest frame of the emitted radiation, i.e., blue/UV emission. This emitted radiation comes to the lens galaxy at 0.16 0.74 m (optical/UV). We average the continuum flux over independent intervals of 100 Å (0.01 m) avoiding the prominent emission/absorption lines and bad pixels, and then infer 32 flux ratios . The ratios appear in Figure 1 (blue, green and red circles). For comparison to previous work, two additional black open circles are depicted in Fig. 1. These two optical continuum flux ratios (black open circles) present no contamination by the lens galaxy light, since the contamination in image B was accurately subtracted (Goicoechea et al. 2005; see also Ovaldsen et al. 2003; Ullán et al. 2003). The corresponding frames in the and bands were obtained with the Nordic Optical Telescope in 2000 February/March and 2001 April. In Fig. 1 there is an apparent agreement between the old results and the new measurements, so the previous data validate all the HST–STIS flux ratios at 1.5 ( = 1/, in m). However, as the contamination could be important at redder wavelengths (e.g., see the frames in the and bands at http://cfa-www.harvard.edu/glensdata/Individual/Q0957.html), the ratios at 1.5 are not considered from here on. Using the results at 1.5, we reach two conclusions: (a) the optical/UV ratios are not achromatic and (b) there is a correlation between and , including a bump close to = 3.5, that resembles extinction laws for galaxies in the Local Group (Gordon et al. 2003).
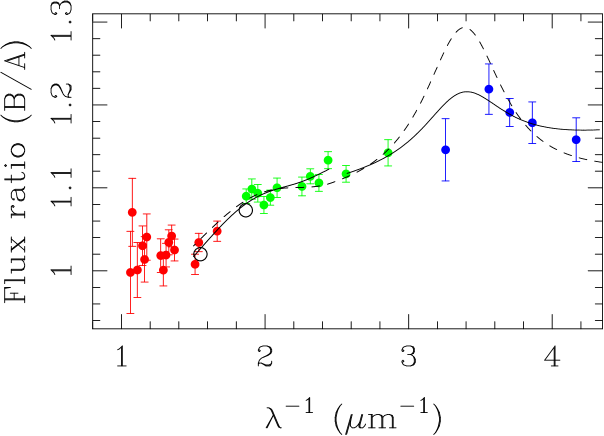
Are our results consistent with only extinction and no gravitational microlensing (i.e., no gravitational effects due to collapsed objects in the lens galaxy)?. Radio signals come from regions much larger than the optical/UV continuum source, so microlensing is not expected to affect those signals. The extinction by dust is also irrelevant for radio fluxes. The flux ratio at radio wavelengths is thus assumed to be a ratio free of perturbations caused by microlensing and extinction, and we take = 0.75 (radio ratio) as the macrolens ratio (e.g., Garrett et al. 1994). We then fit the 20 data at 1.5 to the Milky Way (MW)–like extinction law (Cardelli, Clayton & Mathis 1989; Falco et al. 1999), varying the possible redshift of the dust system: = 0 (MW), 0.36 (lens galaxy), 1.125 (Lyman limit system), 1.4 (damped Ly system and quasar’s host galaxy). Details on the two Lyman systems can be found in Michalitsianos et al. (1997). The best fit is plotted in Fig. 1 (dashed line) and it corresponds to a dust system in the lens galaxy. There is no surprise: the observed bump is placed at 0.21 m, i.e., a wavelength close to the centre of the well-known extinction feature for local galaxies (2175 Å). As our best solution does not accurately trace the observed trend ( = 1.8), we use a more general extinction model. At wavelengths larger than 3000 Å, the extinction curves for lines of sight in the Local Group (MW and Magellanic Clouds) are well described by a MW-like extinction law, whereas at wavelengths shorter than 3000 Å, the extinction curves follow a model including a linear background term, a Drude profile and a far-UV curvature term (Gordon et al. 2003). Therefore, we fit our 13 measurements at 0.3 m to a MW model, and derive a differential extinction = 67.5 5.0 mmag and a ratio of total to selective extinction in the optical band = 4.4 0.5 (95% confidence intervals). We also fit the ratios at 0.3 m to a background + Drude model (we do not need to include the far-UV curvature), setting the Drude parameters to = 4.6 and = 1. The two new fits are depicted in Fig. 1 (solid lines). They are characterized by values of 0.7–0.8, which suggests a slight overestimation of errors. We conclude that extinction by dust is a sufficient mechanism for originating the optical/UV continuum flux ratios and no microlensing is needed. This lack of microlensing signal seems to be in agreement with a small fraction of mass in collapsed (luminous and/or dark) structures, since the absence of microlensing signatures would be unlikely for a halo with a significant fraction of mass in collapsed objects (Goicoechea et al. 2005). Previous studies in the time domain (Refsdal et al. 2000; Wambsganss et al. 2000; Gil–Merino et al. 2001) also ruled out an important population of collapsed objects with substellar mass (for a radial size of the continuum emission region 10-3 pc).
3.2 Emission lines
| Lines | (Å) | (Å) | (Å) | |
|---|---|---|---|---|
| Ly | 2760–2880 | 3020–3100 | 2930–2950 | 13 |
| N v | 2760–2880 | 3020–3100 | 2980–3000 | 13 |
| C iv | 3500–3640 | 3860–3960 | 3680–3780 | 36 |
| C iii | 4350–4500 | 4700–4850 | 4550–4650 | 37 |
| Mg ii | 6500–6660 | 6820–7000 | 6720–6800 | 17 |
and are two continuum zones close to the lines, which are used to deduce quadratic fits. From the subtraction of these fits, we infer the emission line profiles in Figure 2. The lines are integrated over the intervals that include 13–37 channels.

The HST–STIS spectra also contain several emission lines at different wavelengths. Together with the well-known Ly and N v (blended) ultraviolet lines (Gondhalekar & Wilson 1980), and C iii and Mg ii optical lines (Wills & Wills 1980), we clearly detect emission from C iv (around 3730 Å). As far as we know, the C iv lines are detected for the first time in this system. Only the reddest emission (Mg ii) was properly analyzed in a previous work and a flux ratio (Mg ii) = 0.75 0.02 was reported (Schild & Smith 1991). In this paper, we estimate a whole set of emission line ratios, covering optical/UV wavelengths and different degrees of ionization. Details on the analysis of the spectral lines are given in Table 1. To obtain each emission line profile we subtract a quadratic interpolation of the continuum, using two continuum zones close to the line, i.e., a zone to the left ( in Table 1) and a zone to the right ( in Table 1). In the four panels of Figure 2 we show the profiles of the emission lines. After that subtraction, we integrate the resulting peak of flux over the interval (see Table 1). In Table 1 we also show the number of channels corresponding to the integration interval (). Due to the absorption features along the left wings of the Ly emission lines, we only integrate the right wings of these lines. To avoid the possible contamination by the N v emission, a small interval of 20 Å is considered. The weak emission from N v is also integrated over a 20 Å interval. This small zone around 2990 Å is not influenced by the strong Ly emission or the absorption at 3015 Å. The carbon emission lines (C iv and C iii) are integrated over broader intervals of 100 Å, whereas the right wings of the Mg ii emission lines are the main contributions to their fluxes. For these lines (Mg ii) we must avoid the strong absorption features around 6700 Å.
Our determinations of are: Mg ii (2798) = 0.64 0.04, C iii (1909) = 0.78 0.03, C iv (1549) = 0.77 0.02, N v (1240) = 0.67 0.07 and Ly (1216) = 0.87 0.03. Three important conclusions arise from these results. First, we do not obtain any fair correlation between the values and the wavelength/degree of ionization. Second, the average of the five measurements is 0.75, i.e., totally consistent with the macrolens ratio. Third, for each pair of lines, there are several individual channels (at some wavelengths within the integration interval) leading to flux ratios in disagreement with the macrolens ratio. Therefore, it is not surprising to infer an anomalous flux ratio from a relatively small collection of channels. For example, due to the resolution of the gratings and the presence of prominent absorption features and blending, the Mg ii, N v and Ly lines are studied through 13–17 channels. However, we use 36–37 channels for the C iii and C iv lines (see Table 1). We interpret the continuum/emission lines results in the following way: while the broad–line emission region (BLER) does not experience differential extinction as a whole, the continuum source and some substructures of the BLER do suffer it. Thus, a network of compact dusty clouds in the lens galaxy seems to be involved. The long–timescale evolution of in the optical filter agrees with our interpretation (Oscoz et al. 2002). The lack of microlensing in the continuum ratios suggests that no stars are present within the dusty regions crossing the A and B images. Hence, the clouds do not seem to be associated to stars and the network is probably embedded in the elliptical galaxy dark halo.
Spectroscopy and multiband photometry of lensed quasars are throwing light on the differential extinction and microlensing of the continuum and emission line regions. Apart from our conclusions on the CER and BLER of QSO 0957+561 (there is differential extinction of the CER and some substructures of the BLER, but no gravitational microlensing) there are other very recent results on the subject. For example, Wucknitz et al. (2003) analyzed data of QSO HE 05123329. Assuming that the emission line flux ratios are only affected by differential extinction, the authors properly corrected the continuum flux ratios and found evidence for a microlensed CER. Wayth, O’Dowd & Webster (2005) also reported flux ratios of QSO 2237+0305. After applying corrections for differential extinction, they argued that both the CER and BLER must be microlensed. We note that the four images of the system cross the bulge of a face–on Sab spiral galaxy. Finally, from data of QSO SBS 0909+532, Mediavilla et al. (2005) found differential extinction of both the CER and BLER as well as achromatic microlensing of the CER.
4 Conclusions
We conclude that spectroscopic observations of the first gravitationally lensed quasar provide valuable information on the structure of the main lens (cD) galaxy at = 0.36. The data support the existence of a dark halo that mainly consists of non-collapsed material, rather than a granular dark halo harbouring a significant population of collapsed objects. The dark halo probably includes compact dusty clouds of gas with projected (into the source plane) radial sizes verifying the constraint . For example, a typical radius pc is in agreement with measurements of and of quasars (e.g., Yonehara 2001; Kaspi et al. 2000). The clouds must also be sufficiently diffuse that they do not appreciably gravitationally microlens the quasar light (e.g., Kerins, Binney & Silk 2002). In this paper we consider a network of clouds of similar composition. However, a more complicated scenario incorporating different kinds of dust cannot be ruled out (e.g., McGough et al. 2005). Previous spectroscopic studies of the internal region of the cD galaxy suggested the possible existence of a central massive dark object (Mediavilla et al. 2000), so that the new results from HST–STIS spectra of the quasar images (crossing the galaxy halo) complement the previous information on the galaxy nucleus.
Acknowledgments
We thank P. Goudfrooij for helpful comments on the CALSTIS pipeline software. Based on observations made with the NASA/ESA Hubble Space Telescope, obtained from the data archive at the Space Telescope Science Institute. STScI is operated by the Association of Universities for Research in Astronomy, Inc. under NASA contract NAS 5-26555. This work was supported by Universidad de Cantabria funds and the MCyT grant AYA2004-08243-C03-02.
References
- [] Alcock, C., et al., 1998, ApJ, 499, L9
- [] Alcock, C., et al., 2000, ApJ, 542, 281
- [] Alcock, C., et al., 2001, ApJ, 550, L169
- [] Bernstein, G., Fischer, P., Tyson, J. A., Rhee, G., 1997, ApJ, 483, L79
- [] Burud, I., et al., 2000, ApJ, 544, 117
- [] Cardelli, J. A., Clayton, G. C., Mathis, J. S., 1989, ApJ, 345, 245
- [] Chang, K., Refsdal, S., 1979, Nature, 282, 561
- [] Falco, E. E., et al., 1999, ApJ, 523, 617
- [] Garrett, M. A., Walsh, D., Carswell, R. F., 1992, MNRAS, 254, 27P
- [] Garrett, M. A., Calder, R. J., Porcas, R. W., King, L. J., Walsh, D., Wilkinson, P. N., 1994, MNRAS, 270, 457
- [] Gil-Merino, R., Goicoechea, L.J., Serra-Ricart, M., Oscoz, A., Alcalde, D., Mediavilla, E., 2001, MNRAS, 322, 397
- [] Goicoechea, L. J., Gil-Merino, R., Ullán, A., Serra-Ricart, M., Muñoz, J. A., Mediavilla, E., González-Cadelo, J., Oscoz, A., 2005, ApJ, 619, 19
- [] Gondhalekar, P. M., Wilson R., 1980, Nature, 285, 461
- [] Gordon, K. D., Clayton, G. C., Misselt, K. A., Landolt, A. U., Wolff, M. J., 2003, ApJ, 594, 279
- [] Jetzer, P., 1999, in Piran, T., Ruffini, R., eds, Recent Developments in Theoretical and Experimental General Relativity, Gravitation, and Relativistic Field Theories. World Scientific Publishers, Singapore, p. 1543
- [] Jaunsen, A. O., Hjorth, J., 1997, A&A, 317, L39
- [] Kaspi, S., Smith, P. S., Netzer, H., Maoz, D., Jannuzi, B. T., Giveon, U., 2000, ApJ, 533, 631
- [] Kerins, E., Binney, J., Silk, J., 2002, MNRAS, 332, L29
- [] Lasserre, T., et al., 2000, A&A, 355, L39
- [] McGough, C., Clayton, G. C., Gordon, K. D., Wolff, M. J., 2005, ApJ, in press (preprint at http://arxiv.org/abs/astro-ph/0501489)
- [] Mediavilla, E., Serra-Ricart, M., Oscoz, A., Goicoechea, L., Buitrago, J., 2000, ApJ, 531, 635
- [] Mediavilla, E., Muñoz, J. A., Kochanek, C. S., Falco, E. E., Arribas, S., Motta, V., 2005, ApJ, 619, 749
- [] Michalitsianos, A. G., et al., 1997, ApJ, 474, 598
- [] Nadeau, D., Yee, H. K. C., Forrest, W. J., Garnett, J. D., Ninkov, Z., Pipher, J. L., 1991, ApJ, 376, 430
- [] Oscoz, A., Alcalde, D., Serra-Ricart, M., Mediavilla, E., Muñoz, J. A., 2002, ApJ, 573, L1
- [] Ovaldsen, J. E., Teuber, J., Stabell, R., Evans, A. K. D., 2003, MNRAS, 345, 795
- [] Refsdal, S., Stabell, R., Pelt, J., Schild, R., 2000, A&A, 360, 10
- [] Schild, R. E., Smith, R. C., 1991, AJ, 101, 813
- [] Schneider, P., Ehlers, J., Falco, E. E., 1992, Gravitational Lenses. Springer, Berlin
- [] Serra-Ricart, M., Oscoz, A., Sanchis, T., Mediavilla, E., Goicoechea, L. J., Licandro, J., Alcalde, D., Gil-Merino, R., 1999, ApJ, 526, 40
- [] Stockton, A., 1980, ApJ, 242, L141
- [] Ullán, A., et al., 2003, MNRAS, 346, 415
- [] Walsh, D., Carswell, R. F., Weymann, R. J., 1979, Nature, 279, 381
- [] Wambsganss, J., Schmidt, R. W., Colley, W., Kundić, T., Turner, E. L., 2000, A&A, 362, L37
- [] Wayth, R. B., O’Dowd, M., Webster, R. L., 2005, MNRAS, in press (preprint at http://arxiv.org/abs/astro-ph/0502396)
- [] Wills, B. J., Wills, D., 1980, ApJ, 238, 1
- [] Wucknitz, O., Wisotzki, L., López, S., Gregg, M. D., 2003, A&A, 405, 445
- [] Yonehara, A., 2001, ApJ, 548, L127