INTEGRAL spectroscopy of the accreting millisecond pulsar XTE J1807–294 in outburst
The fourth transient accreting millisecond pulsar XTE J1807–294 was observed during its February/March 2003 outburst by INTEGRAL, partly simultaneously with the XMM-Newton and RXTE satellites. We present here the first study of the 0.5–200 keV broad-band spectra of the source. On February 28, the source spectrum was consistent with thermal Comptonization by electrons of temperature keV, considerably larger than the value ( keV) previously derived from the low energy XMM-Newton data alone. The source is detected by INTEGRAL up to 200 keV with a luminosity in the energy band (0.1–200) keV of erg s-1 (assuming a distance of 8 kpc). 22 days later the luminosity dropped to erg s-1. A re-analysis of XMM-Newton data yields the orbital Doppler variations of the pulse period and refines the previous ephemeris. For this source having shortest orbital period of any known binary radio or X-ray millisecond pulsar, we constrain the companion mass M⊙, assuming minimum mass transfer driven by gravitational radiation. Only evolved dwarfs with a C/O composition are consistent with the Roche lobe and gravitational radiation constraints, while He dwarfs require an unlikely low inclination.
Key Words.:
accretion, accretion disks – binaries: close – stars: individual (XTE J1807–294) – stars: neutron1 Introduction
Neutron stars (NS) in low-mass X-ray binaries (LMXB) are spun up by accretion to millisecond periods. The end point of their evolution is expected to be a millisecond pulsar (MSP), i.e. a rapidly spinning NS with a rather weak, G, surface magnetic field (for a review see Bhattacharya & van den Heuvel 1991). Although evidences for rapidly spinning neutron stars in LMXBs were obtained from the burst oscillations that were seen during type I X-ray bursts in several systems (see Strohmayer 2001) and from the discovery of kHz QPOs (see van der Klis 2000, for a review), the detection of millisecond pulsations in the persistent emission remained elusive for many years until the discovery of the first accreting millisecond pulsar by Wijnands & van der Klis (1998). Since that time, a total of six accreting MSPs have been detected (see review by Wijnands 2005). The last one, IGR J00291+5934, was discovered very recently with INTEGRAL (Eckert et al. 2004) and turned out to be the fastest rotating object among these six with the frequency of 599 Hz (Markwardt et al. 2004). Other pulsars’ spin frequencies are between 180 and 435 Hz. All of the accreting MSPs are X–ray transients. The accreting MSPs spend most of the time in a quiescent state, with X–ray luminosities of order of erg s-1 and sometimes go into outbursts reaching luminosities of erg s-1. The millisecond pulsar XTE J1807–294 was discovered in outburst on February 2003 with the Rossi X–ray Timing Explorer (RXTE) during the monitoring observations of the Galactic center region (Markwardt et al. 2003). It has a pulse period of 5.25 ms. The orbital period of 40 min is the shortest one of any known binary radio or X-ray millisecond pulsar. An XMM-Newton Target of Opportunity observation have been used to derive the low energy spectrum and the source pulse profile (Campana et al. 2003; Kirsch et al. 2004). In this paper, we analyze the INTEGRAL hard X-ray spectra of this source obtained simultaneously with XMM-Newton and RXTE during the February/March 2003 outburst.
2 Observations and data analysis
2.1 INTEGRAL
The pulsar was observed by INTEGRAL (Winkler et al. 2003) twice. The first observation was obtained during a Target of Opportunity (ToO) pointing of the Galactic center region, performed from February 28 to March 1, 2003 (satellite revolution 46) which was contemporaneous with the RXTE observation of the pulsar. The second observation during a Galactic Center Deep Exposure (GCDE) observation was contemporaneous with both the XMM-Newton and RXTE observations on March 20–22, 2003 (satellite revolutions 52/53). Hereafter we call the two datasets rev-46 and rev-52, respectively.
We observed XTE J1807–294 with one of the main gamma-ray instruments, IBIS/ISGRI (Ubertini et al. 2003; Lebrun et al. 2003), on-board the spacecraft. The effective exposure time is 157 ks and 263 ks for rev-46 and rev-52, respectively. The data were extracted for all pointings with a source position offset . Data reduction was performed using the standard Offline Science Analysis (OSA) version 3.0 distributed by the INTEGRAL Science Data Center (Courvoisier et al. 2003). The algorithms used in the analysis are described in Goldwurm et al. (2003).
2.2 XMM-Newton
XTE J1807–294 was observed with XMM-Newton (Jansen et al. 2001) on March 22, 2003 for about 17 ks with the first results reported in Campana et al. (2003) and Kirsch et al. (2004). The data, simultaneous with the rev-52 INTEGRAL dataset, were retrieved from the XMM-Newton database and re-analyzed to produce a 0.5–10 keV spectrum contemporary with the INTEGRAL observations. We used the data from the EPIC-pn camera (Strüder et al. 2001) operating in Timing mode, the MOS1 camera operating in Small Window mode and MOS2 in Prime Full Window mode (Turner et al. 2001). The total amount of good exposure time selected was 14 ks and 9 ks for MOS2 and the other instruments, respectively. The Observation Data Files (ODFs) were processed to produce calibrated event lists using the XMM-Newton Science Analysis System (SAS version 5.4.1). The XMM-Newton data reduction and analysis was similar to the procedure described in Campana et al. (2003) with a special care taken to select the events and eliminate pile-up.
2.3 RXTE
We used publicly available data from the proportional counter array (PCA) and the High Energy X-ray Timing Experiment (HEXTE) on board of RXTE. XTE J1807–294 was monitored from February 28 to June 16, 2003. We analyzed only the data contemporary with INTEGRAL for February 28 to March 1 and also with XMM-Newton on March 20–22. The effective exposure time for the first observation was 15.2 ks and for the later observation 23 ks. We carried out a spectral analysis, using standard-2 data (with 16 s time resolution) for the PCA and standard cluster-A data for HEXTE. To improve the signal-to-noise for the PCA we extracted only the data from the top layers of PCU2 and PCU3. The data were extracted for the Good Time Intervals defined by standard criteria. The PCA response matrix was created by FTOOLS version 5.3 for 129 energy channels to cover the energy range from 2–60 keV. For HEXTE we used the standard 64 energy channel response matrix for the 15–250 keV energy range.
3 Results
3.1 IBIS/ISGRI image and light curves
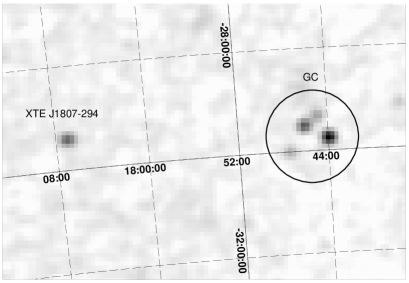
Fig. 1 shows a significance map of the Galactic center region in the 20–40 keV energy range. Single pointings were deconvolved and analyzed separately, and then combined in mosaic images. In the FOV of the image, XTE J1807–294 is clearly detected at a significance level of . In the 40–80 keV energy band the source was detected at , and at higher energies, 80–120 keV, at and from 120–200 keV the detection significance dropped below . The source was observed at the position and , with a positional error of at 90% confidence (Gros et al. 2003). This is fully consistent with the position given by Markwardt et al. (2003). It is located away from the Galactic center.

The INTEGRAL 20–100 keV high-energy light curve has been extracted from the images using all available pointings (all GCDE observation with the source in the FOV from) and is shown in Fig. 2, averaged over 1-day intervals. A clear exponential decay with a time-scale of days is seen over the 60 days of the INTEGRAL observations. The corresponding RXTE/PCA outburst light curve in the 2–20 keV range is also shown in Fig. 2. The first five points are taken from Markwardt et al. (2003), where the source was observed with a peak 2–20 keV flux of erg s-1 cm-2. The light curve shows also some short flares during the decay around March 9, 15, 30 and April 5 (see Zhang et al. 2005). The RXTE decay time-scale, d, is fully consistent with the INTEGRAL value at higher energy. The equality of the RXTE and INTEGRAL timescale shows that the spectrum did not change much during the outburst. After 50 days the decay became slower with a time-scale of days. The XTE J1807–294 outburst lasted much longer than that for other accretion powered MSPs such as SAX J1808.4–3658 (with d) and XTE J1751–305 (with d). XTE J1807–294 is up to now the only MSP which shows a decay of the outburst profile without a distinct knee as seen in the other five MSPs (see Wijnands 2005).
Using the rev-46 dataset with the highest S/N, detailed light curves in different energy bands have been produced, which are shown in Fig. 3. The count rates, averaged over ks intervals, have been converted to flux values using a Comptonization model (see Section 3.2). The hardness ratio as a function of time indicates that no significant spectral variability was detected. The hardness ratio between the highest energy band and the lowest energy band was found to be consistent with constant . Pulsations with a period of 5.25 ms were also marginally detected in the the 20-50 keV IBIS ISGRI energy band. The pulse fraction was 8%. These results will be reported in Finger et al. (2005).

3.2 Spectral analysis
The spectral analysis was done using XSPEC version 11.3 (Arnaud 1996), combining INTEGRAL/ISGRI data with available simultaneous lower energy RXTE and XMM-Newton data. A constant factor was included in the fit to take into account the uncertainty in the cross-calibration of the instruments. A systematic error of 2% was applied to IBIS/ISGRI spectra which corresponds to the current uncertainty in the response matrix and 1% for all the XMM-Newton and RXTE instruments. All spectral uncertainties in the results are given at a 90% confidence level for a single parameter (). The distance, , to the source is not known. As it might be related to the Galactic center, it is not unreasonable to assume 8 kpc.
3.2.1 The rev-46 spectrum
In the rev-46 dataset, the joint INTEGRAL/RXTE (2.5-200 keV) spectrum was first fitted with a simple model consisting of a photoelectrically-absorbed power-law (pl). Given that we were not able to constrain the value (as the RXTE/PCA bandpass starts above 2.5 keV) we fixed it to the value found from XMM-Newton lower energy data (see Section 3.2.2 below). A simple pl model is found inadequate with /dof=273/65. An addition of a cut-off above 60 keV significantly improves the fit to /dof=97/64 (probability of chance improvement of 10-14). The best fit is found for a photon index of 1.8 and a cut-off energy at 80 keV. However, the model does not describe the spectrum below 15 keV well, which requires a more complex description.
We then substituted this phenomenological model with a more physical thermal Comptonization model. The emission from the accretion shock onto the NS is well described by thermal Comptonization of the black body seed photons from the star (see Gierliński, Done, & Barret 2002; Poutanen & Gierliński 2003; Gierliński & Poutanen 2005). We model the shock emission by the compps model111compps is available on the WWW at ftp://ftp.astro.su.se/pub/juri/XSPEC/COMPPS (Poutanen & Svensson 1996). In this model, the exact numerical solution of the Comptonization problem in different geometries is obtained by considering successive scattering orders. We approximate the accretion shock geometry by a plane-parallel slab at the NS surface. The main model parameters are the Thomson optical depth across the slab, the electron temperature , and the soft seed photon temperature . The emitted spectrum depends also on the angle between the normal and the line of sight which does not coincide with the inclination of system because of the light bending. The seed photons are injected from the bottom of the slab. A fraction of these photons reaches the observer directly, while the remaining part is scattered in the hot gas. Thus, the total spectrum contains unscattered black body photons and a hard Comptonized tail. The best fit with /dof=36/62 is then obtained for 0.8 keV, keV, , and (see Table 1). The model also allows to determine the apparent area of the seed photons, which turns out to be km2 in the best fit. It corresponds to a hot spot radius of km in this outburst phase.
No additional thermal-like component (either blackbody or disk blackbody) was required by the fit, very likely because the bulk of its emission occurs below 3 keV, outside the covered energy range. Neither iron line emission nor a reflection component were significantly detected.
The best fit parameters of the model together with its errors are reported in Table 1. The unabsorbed spectrum and the residuals of the data to the model are shown in Fig. 4.
| Dataset | rev-46 | rev-52 |
|---|---|---|
| Models | compps | compps+diskbb |
| (f) | ||
| (keV) | - | |
| (km) | - | |
| (keV) | ||
| (keV) | ||
| (km2) | ||
| ( erg s-1) |
a Assuming a distance of 8 kpc.
3.2.2 The rev-52 spectrum
The INTEGRAL rev-52 dataset was obtained 22 days later than rev-46, this time also simultaneously with the XMM-Newton ToO observation. We were therefore able to construct a combined spectrum covering the 0.5–200 keV range. The thermal emission from the accretion disk can contribute at low energies in the XMM-Newton range. The presence of the emission from the accretion disk is supported by the decrease of the pulse fraction below 2 keV (Campana et al. 2003; Kirsch et al. 2004). We model this emission with diskbb, a multi-temperature disk model of Mitsuda et al. (1984). It is characterized by the inner disk temperature and normalization which can be transformed to the inner disk radius . The spectrum was then fitted with this component combined with a simple pl, everything photoelectrically absorbed. The model gives a good fit with /dof=237/200. The absorption is determined to be , comparable to that found by Campana et al. (2003), and the best pl index is . However, the inner disk radius, , is then around 2 km, which is not consistent with the disk size, assuming a 10 km NS radius. To have a direct comparison with the results of the rev-46 data we replaced the pl component with compps in a slab geometry assuming a black body seed photon spectrum.
The results of the diskbb + compps fit are reported in Table 1, while the spectrum and the residuals are shown in Fig. 5. With a typical plasma temperature of keV, the joint INTEGRAL/XMM-Newton/RXTE fit is at variance with the parameters derived from the low energy XMM-Newton data only which gave 10 keV (see Campana et al. 2003), confirming the importance of high energy observations. Comparison with the rev-46 results shows that the decay of the outburst is marked by a constant seed photon temperature, a significant increase of plasma temperatures correlated with a significant decrease of the scattering opacity. The fit required a inner disk radius, 13 km, this time fully compatible with the radius of a NS. The apparent area of the seed photons is , which is also what expected from a hot spot on a NS surface. The hard component contributes 83 per cent of the unabsorbed flux in the 0.1-200 keV energy range. Also in this case reflection was not significantly detected.


4 Companion star and the system geometry
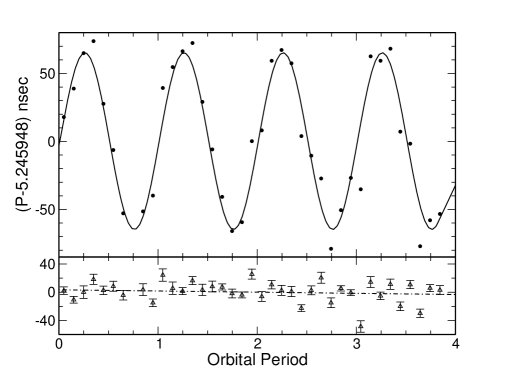
The orbital elements of XTE J1807–294 have been derived from a re-analysis of the XMM-Newton temporal data, using a Doppler pulse-variation procedure instead of the complex 2D-parameter search made by Campana et al. (2003) and Kirsch et al. (2004). The barycentric photon arrival times were grouped into 240 s intervals and the best period was determined using the Z-statistic (Buccheri et al. 1983). The resulting 39 best period values clearly show a sinusoidal modulation expected for a circular orbit (see Fig. 6). A sine-fit to the modulation yields a mean pulsation period of 0.005245948(4) s, a projected orbital radius of lt-s and a barycentric positive-crossing time (mean longitude ) of JD, where the errors are given in parentheses. The poorly constrained orbital period was assumed here to be 40.0741 min (Markwardt et al. 2004). The spin period and orbit projected radius values are consistent with the previous determinations by Campana et al. (2003) (once corrected for typing errors) and Kirsch et al. (2004), but with more reliable uncertainties. However, the epoch of mean longitude differs very significantly, by more than 0.005 d, most probably due to the inaccuracy of the complex method used by these authors. The introduction of an eccentricity does not improve the fit. A small linear slope is visible in the residuals (see Fig. 6), but not significant. However phase deviations (rms of ns) are also seen (Fig. 6), corresponding to highly erratic period variations. Such a behavior was already noted by Markwardt (2004) who reported apparent spin-up and spin-down rate of s s-1 on longer timescale. The instability of the period may therefore be also present on very short timescale ( min) which is a strong indication that we do not see the real clock, but rather a moving spot at the surface of the neutron star.
With a mass function of M⊙, the minimum companion mass obtained for inclination of is and 0.0084 M⊙ for and 2.0 M⊙, respectively.
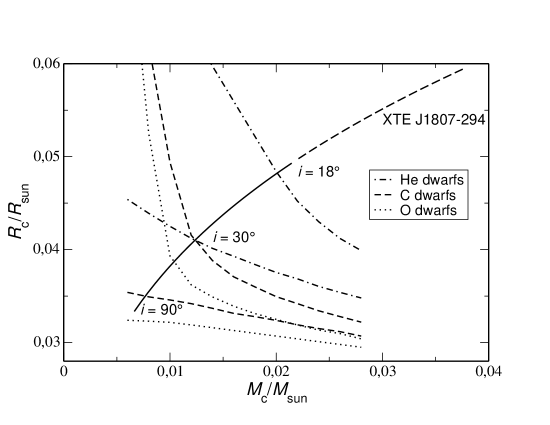
The assumption of a Roche lobe filling companion (Paczyński 1971), implies the mass-radius relation shown in Fig. 7 (thick line). In the very low-mass regime, recent models of low-mass degenerate dwarfs have been produced incorporating the effect of different compositions and temperatures (Deloye & Bildsten 2003). The corresponding versus relations are also shown in Fig. 7. For a mean inclination of , only low temperature C dwarfs and O dwarfs are allowed, clearly excluding He dwarfs which will require very low inclinations . This strongly constrains the evolution of the system.
An interesting constraint is given by the minimum accretion rate driven by gravitational radiation in a close binary (see Verbunt & van der Heuvel 1995, for a review). The outburst main peak was observed on February 21, 2003 (52691 MJD), and follows the outburst shape (see Fig. 2), we extimated a total flux to be erg cm-2. Following Bildsten & Chakrabarty (2001) we can constrain the source distance as a function of inclination angle and companion mass through the mass function and mass loss rate due to gravitational rediation. From randomly selected orbits, the probability of having an inclination is 1-cos, so that a maximum mass at a confidence level 95% can be derived for with value . Note that for this source the recurrence time of the outburst is unknown. Assuming a recurrence time of 5 years, the source is calculated to be at 8 kpc with an inclination angle of (). At a mean inclination angle of (), the source must be located at 3 kpc. With a recurence time of 39 years, the source is located at 8 kpc with an inclination angle of . This calculation predicts that a He dwarf companion star is favorable for a low inclination angle and the system located at 8 kpc. A high inclination implies that the system be located at 3 kpc with an C/O dwarf companion star. A solution of this problem can be given if a future outburst is observed, giving a recurrence time of outburst.
The mass transfer driven by gravitational radiation implies an inclination , assuming a source distance of 8 kpc and NS masses between 1.0 and 2.0 M⊙, giving only a long recurence time of the outburst. On the other hand, there were no X-ray eclipses or dips detected in the EPIC-pn light curves. We therefore put an upper limit on the binary inclination of for a Roche lobe-filling companion. A very low inclination is also possible, since that would imply a high companion mass and thus a large mass transfer rate. There is also no evidence for an X-ray modulation at the binary period, which might have implied propagation through a scattering atmosphere in a near edge-on geometry (Bildsten & Chakrabarty 2001). If the source is most likely at an inclination of , we get the inner disk radius (see Table 1) in the range 20–40 km.
5 Conclusions
We have found that the spectrum of XTE J1807–294 is well described by a combination of thermal Comptonization and disk black body. The electron temperature of 40 keV is considerably larger than previously determined from lower energy observations (Campana et al. 2003). The hard spectral component contributes most of the observed flux (83 per cent), even though a soft component (disk black body) is required by the data. If the accretion disk is truncated at the magnetosphere radius, where the material can accrete along the magnetic field towards the pole of a NS, the matter over the pole is heated by a shock to a temperature of 40 keV. The hot spot at the surface with temperature 0.8 keV gives rise to the seed photons for Comptonization in the hot plasma. Since the hard X-ray emission is pulsed (see e.g. Gierliński & Poutanen 2005), a fraction of it must originate from the regions confined by the magnetic field. The most obvious source of hard X-rays is the place where material collimated by the magnetic fields impacts the surface.
If we consider the inclination of the system to be , this allows us to determine the inner disk radius which lies in the range 20–40 km (for the distance of 8 kpc). Many characteristics of the source are similar to those observed in other MSPs, SAX J1808.4–3658 (Gierliński et al. 2002; Poutanen & Gierliński 2003) and XTE J1751–305 (Gierliński & Poutanen 2005).
Acknowledgements.
MF and AM acknowledges CNES and the CNRS “GdR Phenomenes Cosmiques de Haute Energie” for financial support. JP is supported by the Academy of Finland and the NORDITA Nordic project on High Energy Astrophysics.References
- Arnaud (1996) Arnaud, K. A. 1996, in Astronomical Data Analysis Software and Systems V, ed. G. H. Jacoby, & J. Barnes, ASP Conf. Series 101 (San Francisco: ASP), 17
- Bhattacharya & van den Heuvel (1991) Bhattacharya, D., & van den Heuvel, E. P. J. 1991, Phys. Rep., 203, 1
- Bildsten & Chakrabarty (2001) Bildsten, L., & Chakrabarty, D. 2001, ApJ, 557, 292
- Buccheri et al. (1983) Buccheri, R., Bennett, K., Bignami, G. F., et al. 1983, A&A, 128, 245
- Campana et al. (2003) Campana, S., Ravasio, M., Israel, G. L., et al. 2003, ApJ, 954, L39
- Courvoisier et al. (2003) Courvoisier, T. J.-L., Walter, R., Beckmann, V., et al. 2003, A&A, 411, L57
- Deloye & Bildsten (2003) Deloye, C. J., & Bildsten, L. ApJ, 2003, ApJ, 598, 1217
- Eckert et al. (2004) Eckert, D., Walter, R., Kretschmar, P., et al. 2004, Astr. Tel., 352
- Finger et al. (2005) Finger, M. H., Falanga, M., Markwardt, C. B., & Wilson, C. A. 2005, ApJ, to be submitted
- Gierliński & Poutanen (2005) Gierliński, M., & Poutanen, J. 2005, MNRAS, submitted [astro-ph/0411716]
- Gierliński et al. (2002) Gierliński, M., Done, C., Barret, D., 2002, MNRAS, 331, 141
- Goldwurm et al. (2003) Goldwurm, A., David, P., Foschini, L., et al. 2003, A&A, 411, L223
- Gros et al. (2003) Gros, A., Goldwurm, A., Cadolle-Bel, M., et al. 2003, A&A, 411, L179
- Jansen et al. (2001) Jansen, A., Lumb, D., Altieri B., et al. 2001, A&A, 365, L1
- Kirsch et al. (2004) Kirsch, M. G. F., Mukerjee, K. Breitfellner, M. G., et al. 2004, A&A, 423, L9
- Lebrun et al. (2003) Lebrun F., Leray J.-P., Lavocate, Ph., et al. 2003, A&A, 411, L141
- Lund et al. (2003) Lund, N., Budtz-Joergensen, C., Westgaard, N. J., et al. 2003, A&A, 411, L231
- Markwardt (2004) Markwardt, C. B. 2004, in X-Ray Timing 2003: Rossi and Beyond, ed. P. Kaaret, F. K. Lamb, & J. H. Swank (Melville, NY: AIP), 209
- Markwardt et al. (2002) Markwardt, C. B., Swank, J. H., Strohmayer, T. E., in ’t Zand, J. J. M., & Marshall, F. E. 2002, ApJ, 575, L21
- Markwardt & Swank (2003) Markwardt, C. B., & Swank, J. H. 2003, IAU Circ. 8144
- Markwardt et al. (2003) Markwardt, C. B., Juda, M., & Swank, J. H. 2003, IAU Circ. 8095
- Markwardt et al. (2004) Markwardt, C. B., Swank, J. H., & Strohmayer, T. E. 2004, Astr. Tel., 353
- Mitsuda et al. (1984) Mitsuda, K., Inoue, H., Koyama, K., et al. 1984, PASJ, 36, 741
- Poutanen & Gierliński (2003) Poutanen, J., & Gierliński, M. 2003, MNRAS, 343, 1301
- Poutanen & Svensson (1996) Poutanen, J., & Svensson, R. 1996, ApJ, 470, 249
- Paczyński (1971) Paczyński, B. 1971, ARA&A, 9, 183
- Strohmayer (2001) Strohmayer, T. E. 2001, Adv. Space Res., 28, 511
- Strüder et al. (2001) Strüder, L., Briel, U., Dennerl, K., et al. 2001, A&A, 365, L18
- Turner et al. (2001) Turner, M. J. L., Abbey, A., Arnaud, M., et al. 2001, A&A, 365, L27
- Ubertini et al. (2003) Ubertini, P., Lebrun, F., Di Cocco, G., et al. 2003, A&A, 411, L131
- van der Klis (2000) van der Klis, M. 2000, ARA&A, 38, 717
- Verbunt & van der Heuvel (1995) Verbunt, F., & van den Heuvel, E. P. J. 1995, in X-ray binaries, ed. W. H. G. Lewin, J. van Paradijs, E. P. J. van den Heuvel (Cambridge: Cambridge University Press), 457
- Winkler et al. (2003) Winkler, C., Courvoisier, T. J.-L., Di Cocco, G., et al. 2003, A&A, 411, L1
- Wijnands & van der Klis (1998) Wijnands, R., & van der Klis, M. 1998, Nature, 394, 344
- Wijnands (2005) Wijnands, R. 2005, in Pulsars New Research (New York: Nova Science Publishers), in press [astro-ph/0501264]
- Zhang et al. (2005) Zhang, F., Qu, J., L., & LI, X. D. 2005, ApJ, submitted