2 Nicolaus Copernicus Astronomical Center, Bartycka 18, 00-716 Warsaw, Poland
INTEGRAL observations of OAO 1657415: gamma-ray tomography of a B supergiant
OAO 1657415 is an accreting pulsar in an eclipsing binary system. We analyzed the INTEGRAL core program observations of this object and obtained the eclipse light curve in the soft gamma-ray band between 15 and 40 keV. We note that the gamma rays from the pulsar allow to probe the density profile of the outer layers of the B supergiant companion. We find that the density profile of the outer layer can be described by a power law with the index . We also note that the fit hints toward smaller inclinations of the system within the allowed range (Chakrabarty et al. 1993).
Key Words.:
pulsars: individual; gamma rays1 Introduction
The accreting pulsar OAO 1657415 has been discovered with the Copernicus satellite by Polidan et al. (1978). White & Pravdo (1979) found the s pulsations from the source. The pulsar spin has been measured by a number of observatories and the spin history shows large spin-up and spin-down episodes on a timescale between a few months and a year (Chakrabarty et al. 1993; Bildsten et al. 1997). The companion has initially been identified as V861 Sco, yet this identification has been proved to be incorrect (White & Pravdo 1979; Armstrong et al. 1980; Byrne et al. 1981). The pulsar has been found to be a member of rare class of eclipsing objects with an orbital period of 10.4 d (Chakrabarty et al. 1993), and the optical companion identification was made possible only recently by the excellent X-Ray counterpart location provided by Chandra (Chakrabarty et al. 2002). This identification lead to estimate of the distance at kpc, much lower than the kpc lower limit inferred previously with the assumption that the neutron star is rotating at the equilibrium period. The low energy X-ray spectrum of OAO 1657415 is very absorbed, cm-2 (Polidan et al. 1978; Kamata et al. 1990), because the source lies at a low galactic latitude, and Ginga observations found a soft excess below keV (Kamata et al. 1990; White & Pravdo 1979), while Kamata et al. (1990) found a fluorescence line a keV. The hard X-ray spectrum can be modeled by a power law steepening at energies above keV, with a hint of a cyclotron line at keV (Orlandini et al. 1999).
2 Data acquisition and processing
INTEGRAL is a Gamma-ray satellite equipped with three high energy scientific instruments: SPI – gamma spectrometer, IBIS – gamma imager and JEM-X – X-ray monitor (Winkler et al. 2003). ISGRI is the low energy detector on board the IBIS/INTEGRAL telescope – it is a position sensitive meter by meter detector made of CdTe (Ubertini et al. 2003). It works in the energy range keV. ISGRI consists of about 16 384 single detector pixels. The coded mask aperture is placed about 3 meters above the ISGRI detector. The mask is made of the Tungsten segments: about 1 by 1 cm and 1.6 cm thick, in 95 by 95 segments system (half open), with the basic pattern of 53 by 53. This coded aperture mask telescope collects gamma rays with angular resolution better than 12 arcmin and with energy resolution about 10% at 100 keV with about 2500 cm2 collecting area.
All the analyzed data come from ISGRI/IBIS detection layer. We have selected the data intervals from the Galactic Plane Scan in the INTEGRAL core programme for which OAO 1657415 was in the fully coded field of view, i.e. less than from the axis.
This condition was satisfied by the observations from the the following INTEGRAL revolutions: 44-47, 49-56, 58-61, 63 (Spring 2003), and 100, 101, 103, 116, 118, 119 (Autumn 2003) The total time of data acquisition was ks. The data has been processed using standard INTEGRAL software provided by ISDC (http://isdc.unige.ch) in version 3.0 with normal configuration for the ISGRI pipeline. A preliminary analysis of the data has been presented in Denis et al. (2004).
Since we have used the data segments corresponding to different locations on the detector we had to model the off axis response of the IBIS/ISGRI detector. We have used the Crab observations during the INTEGRAL revolution 170 as our reference. We used two models of the detector angular response function: a wide area ( 13∘ square around telescope axis) global fit with a paraboloid summed with a two-dimensional Gaussian, and local flat surface triangulation. Both gave similar results.
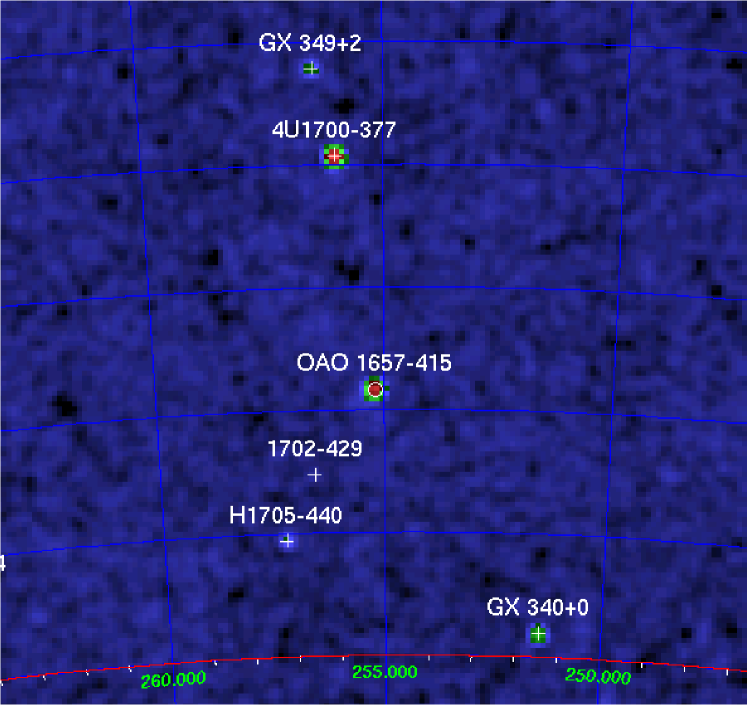
We have analyzed 480 science windows (INTEGRAL science window is a single exposure lasting of 20 minutes) and the typical detection significance was 25 sigma. We have also detected the pulsations with the period of 37.16 s. We present the skymap of OAO 1657415 region in Figure 1. The source is detected at the level of 122 in the 1540 keV energy band for a total exposure of 24.5 ks (Denis et al. 2004).
3 Eclipse modeling
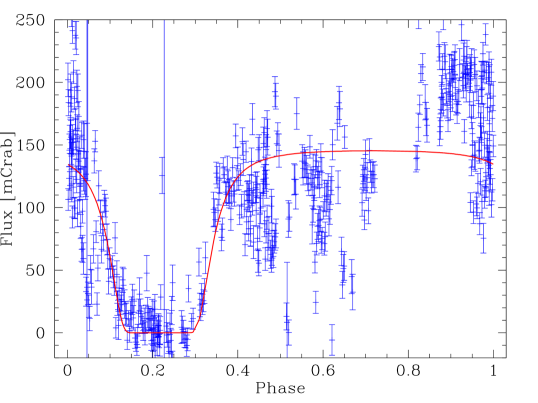
The brightness of the source varies from 200-300 mCrab to nearly 0 between different observations. We have folded the observations with the orbital period of the pulsar of days discovered by Chakrabarty et al. (1993). This revealed a beautiful eclipse profile, as can be seen in Figure 2. Epoch of the eclipse centre is JD 2 452 705.9.
The eclipse in the lightcurve is clearly visible. What is interesting is that the eclipse ingress and regress are gradual, and last almost a day, with the totality, ingress and regress, of almost two days. A pulsar is essentially a point source in comparison with the B supergiant companion with a radius of . Such a gradual eclipse is expected when the sizes of the sources are comparable, or if the eclipsing object is diffuse and has a low optical thickness to the gamma rays of the eclipsed source. In the case of OAO 1657415 light curve we have to consider this latter case.
To model the eclipse we have assumed that the density profile of the B supergiant companion can be described as a power law:
| (1) |
For a given orbital phase and assumed inclination we can calculate the the column density through the eclipsing star by integrating the density profile:
| (2) |
where is the projection of distance between the pulsar and the companion along the line of sight, and is the projection of this distance on the plane perpendicular to the line of sight. At the energies keV the main opacity through the star is due to electron scattering. We treat the radiative transfer approximately and we model the eclipsed flux from the pulsar as
| (3) |
where is the flux from the pulsar, is the center of the eclipse and is the Thompson cross section. Altough the source is intrinsically variable (20-40%), we put constant because the modeled eclipse light curve is a superposition of many data sets covering randomly the whole range of the orbital phase. Such an approach should not have an important impact on the fitted values of the eclipse parameters (, , , and ), but can increase the incertitude on . In the model we use the orbital elements inferred earlier from the BATSE data (Chakrabarty et al. 1993). The model has five free parameters: , , , , and .
The data analysis yielded the statistical errors. We estimate the additional systematic errors by requiring that the data in the total eclipse part (phases from 0.13 to 0.30) are consistent with zero flux. To this goal we add in quadrature a systematic error mCrab. This is a minimal value which leads in this phase interval where the flux is zero during the total eclipse.
To find the best fit model we use the minimalization. We have scanned the parameter space, with the restriction , as inferred from the timing analysis by Chakrabarty et al. (1993). A best fit model light curve is presented as the solid line in Figure 2. The model curve correspond to the model with the following parameters: , mCrab, , , and , where is in units of cm-3.
In order to find the confidence regions on the parameters we assume that the probability density in the parameter space is proportional to where are the parameters. Such probability density is normalized. We marginalize over the remaining parameters to find the probability distributions for each parameter, or two dimensional maps of probability density. The best fit values with the confidence contours obtained using the above procedure are , , the center of the eclipse is . The formal best fit value for the flux is mCrab, and for the inclination . The best fit values of the parameters corresponds to the peak of the probability distribution and the describe the region containing 68% probability around this peak. The formal error on inferred value of the inclination angle reflects the fact that we considered only the angles above and the best fit corresponded to the lowest angle considered.
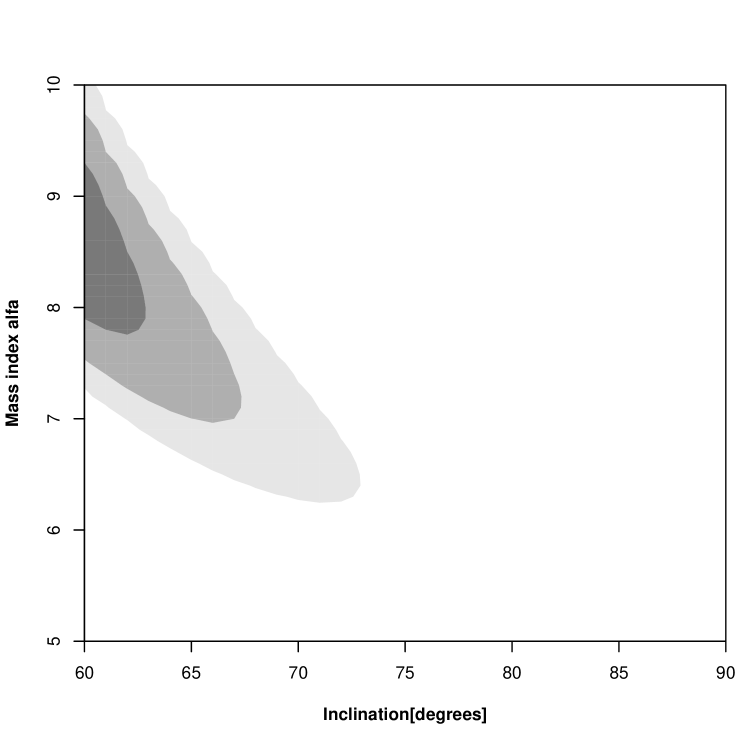
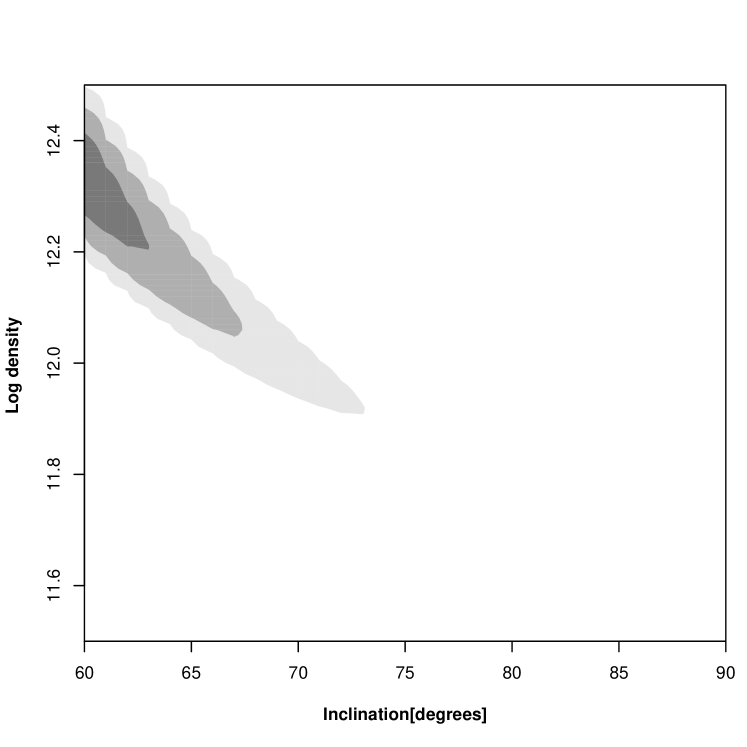
The relatively large uncertainties in determination of the mass index and the fiducial density are due to the fact that these quantities are correlated. In Figures 3 and 4 present the regions containing , , and percent of the probability in the space spanned by the index and the inclination angle (Figure 3), and by the density and the inclination angle (Figure 4). Both the mass index and the density are anticorrelated with the inclination angle of the binary. The increase of the density parameter is due to the fact that as we decrease the inclination angle the eclipse probes farther radii from the stellar center, while is defined as density at a constant radius of . The index increases since at higher inclinations the neutron star is eclipsed along a chord line and the density difference leading to the observed eclipse corresponds to smaller difference of the radii from the stellar center. Therefore also the index is correlated with the density parameter .
4 Summary and discussion
The INTEGRAL observations of the eclipse are the first result where a stars outer layers can be probed directly by the external gamma ray source. The mass enclosed in the region that we probe can be estimated by integrating equation 1 starting from the point where the eclipse becomes total. The result depends on the assumed inclination and varies from for to for . The thickness of the layer that is probed with this method also depends on the assumed inclination. Assuming that the width of the total eclipse is we estimate that with the inclination of we probe down to the radius of from the center, while at the assumed inclination we see the structure above .
The outer layer of the star is the location of the acceleration of the wind. Our results can be used along with the continuity equation to estimate the wind velocity profile: . This estimate uses an assumption that we already see the accelerating layer. In reality the wind may be taking off in the upper portion of the atmosphere which is already optically thin to gamma rays.
Finally we note that the flux outside the eclipse seems to increase by a factor of before entering the eclipse, i.e. between the phase 0.4-0.6 and 0.8-1.0. While the data looks particularly noisy it seems interesting to investigate the possibility that the variation of the flux is due to the structure of the outgoing wind. The accreting neutron star may leave a hollow trace in the wind and such a trace could correspond to decrease of density during a particular phase, when the pulsar is viewed through hole in the wind material.
Summarizing, we have presented the first well observed case of a gamma-ray eclipse. We show that the eclipse lightcurve allows to study the structure of the outer layers of the companion. INTEGRAL is particularly well prepared for such studies as it allows long duration monitoring of sources.
Acknowledgements.
INTEGRAL is an ESA project with instruments and science data center funded by the ESA members (especially the PI countries: Denmark, France, Germany, Italy, Switzerland, Spain), Czech Republic, and Poland, and with the participation of Russia and USA. This research was supported by the KBN grants 2 P03D 001 25 and PBZ-KBN-054/P03/2001.References
- Armstrong et al. (1980) Armstrong, J. T., Johnston, M. D., Bradt, H. V., et al. 1980, ApJ, 236, L131
- Bildsten et al. (1997) Bildsten, L., Chakrabarty, D., Chiu, J., et al. 1997, ApJS, 113, 367
- Byrne et al. (1981) Byrne, P. F., Levine, A. M., Bautz, M., et al. 1981, ApJ, 246, 951
- Chakrabarty et al. (1993) Chakrabarty, D., Grunsfeld, J. M., Prince, T. A., et al. 1993, ApJ, 403, L33
- Chakrabarty et al. (2002) Chakrabarty, D., Wang, Z., Juett, A. M., Lee, J. C., & Roche, P. 2002, ApJ, 573, 789
- Denis et al. (2004) Denis, M., Bulik, T., Marcinkowski, R., et al. 2004, in Proceedings of the 5th INTEGRAL Workshop on The INTEGRAL Universe, 453–457
- Kamata et al. (1990) Kamata, Y., Koyama, K., Tawara, Y., et al. 1990, PASJ, 42, 785
- Orlandini et al. (1999) Orlandini, M., dal Fiume, D., del Sordo, S., et al. 1999, A&A, 349, L9
- Polidan et al. (1978) Polidan, R. S., Pollard, G. S. G., Sanford, P. W., & Locke, M. C. 1978, Nature, 275, 296
- Ubertini et al. (2003) Ubertini, P., Lebrun, F., Di Cocco, G., et al. 2003, A&A, 411, L131
- White & Pravdo (1979) White, N. E. & Pravdo, S. H. 1979, ApJ, 233, L121
- Winkler et al. (2003) Winkler, C., Courvoisier, T. J.-L., Di Cocco, G., et al. 2003, A&A, 411, L1