The Connection between Ultraviolet and X-ray Outflows in AGN: the case of PDS 456
Abstract
High-velocity outflows from AGN are a well-known phenomena in terms of the Broad Absorption Lines seen in the UV/optical. More recently, similar, possibly related, outflows have been reported in the X-ray. The most extreme example is seen in the nearby, luminous QSO PDS 456, which displays a massive, high velocity (50000 km s-1), high-ionization X-ray outflow of yr-1. Here we present the UV spectrum of PDS 456 as observed by the Hubble Space Telescope. We find the UV spectrum is also extreme, displaying very broad emission-lines, with C iv blueshifted by 5000 km s-1 and a broad Ly absorption trough blueshifted by 14000–24000 km s-1. No strong, broad high-ionization absorption features are seen. We interpret the combined UV and X-ray spectrum of PDS 456 as the signature of a decelerating, cooling outflow, which may be driven by radiation and/or magnetic field. This outflow may be the source of some of the broad emission and absorption-line gas.
keywords:
galaxies: active – UV: galaxies – galaxies: individual: PDS 4561 Introduction
If we are to understand the nature of Active Galactic Nuclei (AGN), it is crucial to fully explore the available range of parameter space and in particular study objects which display the most extreme behaviour. One such object is the nearby quasar PDS 456, which was discovered by Torres et al. (1997). They suggested it was intrinsically more luminous than 3C 273, traditionally taken to be the most luminous object in the “local Universe” (). Our follow-up observations confirmed that PDS 456 is more luminous than 3C 273 in the optical, with (Simpson et al. 1999). The reason PDS 456 was not discovered sooner is due to its sky location, near the Galactic bulge, resulting in Galactic extinction of E(BV) = 0.48.
Unlike 3C 273, VLA radio data show PDS 456 to be radio-quiet with a typical optical-to-radio luminosity ratio for that class (Simpson et al. 1999), suggesting its high luminosity is not due to Doppler boosting of the continuum. In the near-infrared and optical PDS 456 is effectively a “twin” of 3C 273 in terms of its continuum shape, and displays a rich emission-line spectrum in which the Balmer and Paschen lines have very broad wings (FWZI km s-1) and the Fe ii lines are strong. The [O iii] 5007 line is very weak (EW Å, compared to a typical value of 24 Å; Miller et al. 1992). Simpson et al. derive a redshift from the narrow [Fe ii] m line of .
Using ASCA and RXTE data, Reeves et al. (2000) showed that PDS 456 has a steep hard X-ray spectrum (photon index ), with an unusually strong absorption edge at keV (in the rest-frame). A higher-quality observation obtained with XMM-Newton confirms the rich, absorption-dominated X-ray spectrum (Reeves et al. 2002; Reeves, O’Brien & Ward 2003). To fit these data requires the presence of a large column ( cm-2) of highly ionized material (log ). This material is outflowing at km s-1, which translates to a mass of yr-1 for a conservative covering factor of 0.1 steradian. Similar, but less extreme, high-velocity outflows have also been observed in other AGN, (Chartas et al. 2002; Chartas, Brandt & Gallagher 2003; Pounds et al. 2003a,b; Dasgupta et al. 2005). An alternative viewpoint has been expressed that some of the absorption could be due to local hot gas (e.g. McKernan, Yaqoob & Reynolds 2004). While this may explain a modest column of soft X-ray absorbing gas, such a model does not provide a good fit to the strong Fe K-band features seen in PDS 456 and has no explanation in terms of the known local Galactic environment.
Correcting for the Galactic and intrinsic absorption, PDS 456 has an X-ray luminosity of L(2–10 keV) erg s-1 (adopting H km s-1 Mpc-1, , ). This is about a tenth of the X-ray luminosity of 3C 273, but PDS 456 has an optical/X-ray luminosity ratio within the known range for radio-quiet AGN (e.g. Yuan et al. 1998). The X-ray variability of PDS 456 is extreme for such a luminous radio-quiet object. It varies by factors of two in just 30 ks, repeating this behaviour almost every day (Reeves et al. 2002). Overall, the luminosity, variability and spectral characteristics of PDS 456 strongly suggest it is an object running at an unusually high accretion rate, with a massive X-ray outflow driven by radiation and/or magnetic field.
The X-ray properties of PDS 456 clearly show it to be an extraordinary object. To explore its nature further, we report here on a HST UV observation which reveal a further set of extreme properties. In the following sections we describe the HST observation of PDS 456 and the derived spectral characteristics. We then discuss how the UV data suggest a connection between the X-ray and UV properties and how PDS 456 could help us understand the connection between AGN with and without broad absorption lines and explain the origin of at least part of the broad emission line region.
2 The HST observation
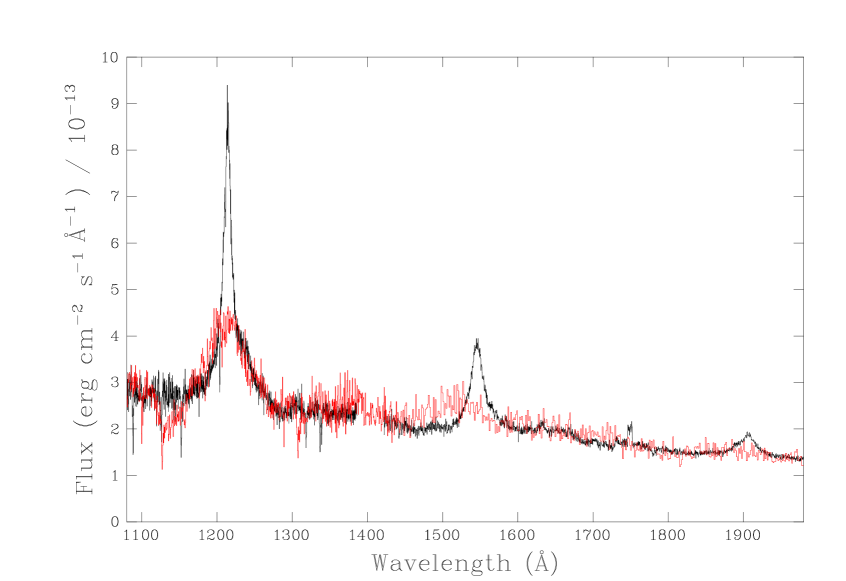
We observed PDS 456 with the HST Space Telescope Imaging Spectrograph (STIS) on 2000 May 14. Exposure times of 1140 and 781 seconds were used for the G140L and G230L gratings respectively. Galactic reddening results in an observed flux level of only 2–10 erg cm-2 s-1 in the STIS data, but nevertheless PDS 456 is clearly detected throughout the entire wavelength range. The dereddened UV spectrum is shown in Fig. 1. An E(BV) = 0.48 was adopted (Torres et al. 1997; Simpson et al. 1999) with the Seaton (1979) extinction law. As this was an exploratory observation using a single HST orbit, the signal-to-noise ratio is not very high, but nevertheless several broad emission features are detected with high significance (7–10), well above any known calibration or instrumental uncertainties. Many narrow Galactic absorption lines are also detected, but will not be discussed further in this paper. The dereddened spectra were combined and analysed using the Starlink DIPSO software program (Howarth et al. 1998).
3 The UV properties of PDS 456

a Observed wavelength. b Observed Line flux. c Velocity shift relative to . Line Fluxb FWHM (Å) ( erg cm-2 s-1) (km s-1) (km s-1) Ly/N v (1 Gaussian) Ly/N v (2 Gaussian) Si IV/O iv C iv
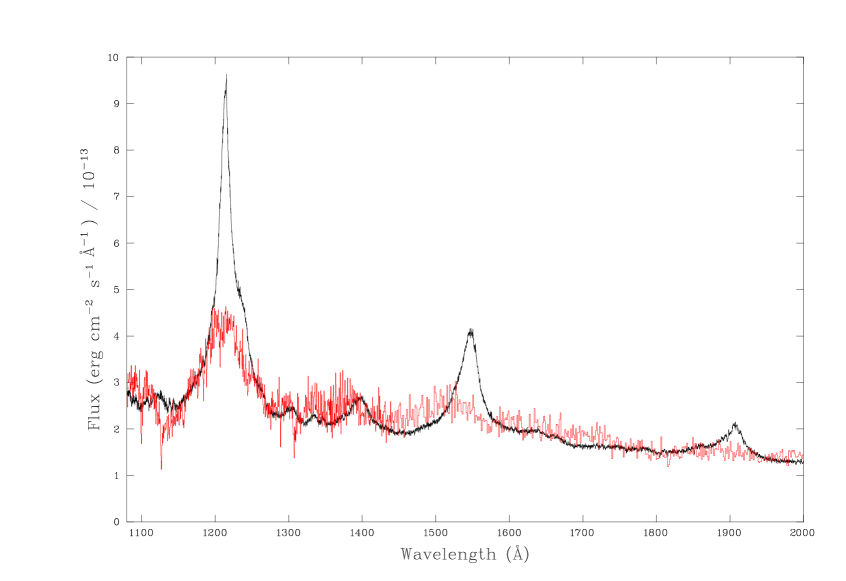
The continuum shape in PDS 456 is fairly “normal” with a UV spectral index (), agreeing with an extrapolation of our previous optical spectra (from August 1997) and with the XMM-Newton Optical Monitor broad-band UV fluxes (from May 2002), suggesting little continuum variability occurs in the UV. Simpson et al. (1999) noted that the optical continuum shape of PDS 456 is very similar to that of 3C 273, and this similarity extends into the UV band, as shown in Fig. 2. The UV continuum shape of PDS 456 is also similar to that of the mean radio-quiet quasar UV spectrum compiled by Telfer et al. (2002) from HST spectra (Fig. 3).
To extract spectral information we fitted the “expected” emission lines with Gaussian profiles, trying both a single and double-Gaussian fit to the Ly/N v complex. The derived parameters are given in Table 1.
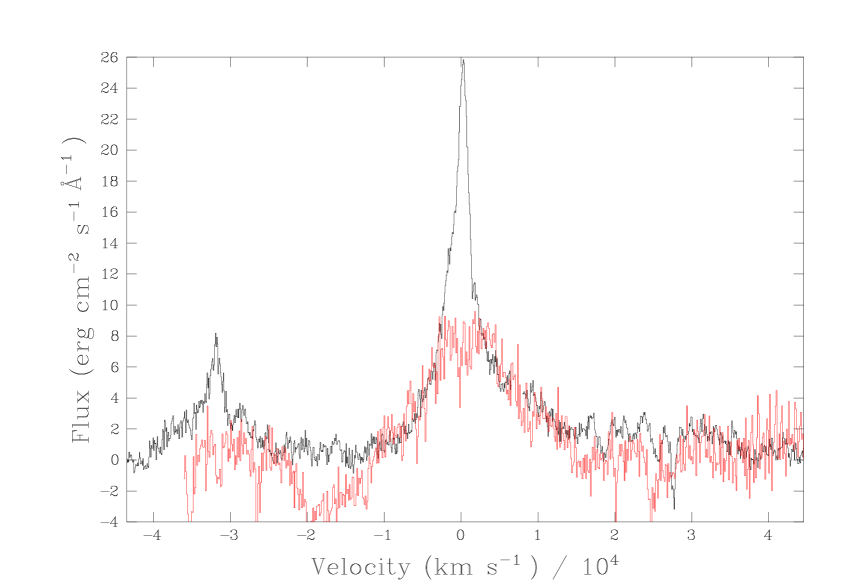
The UV emission lines from the broad-line region (BLR) in PDS 456 are unusually broad (FWHM up to km s-1). Simpson et al. (1999) note that the optical/IR hydrogen lines have a very broad base (FWZI km s-1), and the UV spectrum shows these are similar in shape to Ly/N v (Fig. 4). The Ly/N v profile in PDS 456 is also similar to the base of this feature in 3C 273 (Fig. 2). The broad UV emission lines in PDS 456 lack a sharp, low-velocity core unlike those seen in the Balmer lines (Fig. 4) or in the UV lines of 3C 273 and the mean HST spectrum.
Broad C iv and Si iv/O iv lines are detected in PDS 456, but are both strongly blueshifted by 5000 and 4000 km s-1 respectively relative to the optical/IR low-ionization lines. The blueshift of 2000 km s-1 for Ly/N v is significantly smaller, consistent with the trend in blueshift found by Vanden Berk et al. (2001). The double-Gaussian fit given in Table 1 for Ly/N v was performed assuming the two lines to have the same width and velocity shift. Allowing the line centres to go free gave a consistent but less well constrained fit.
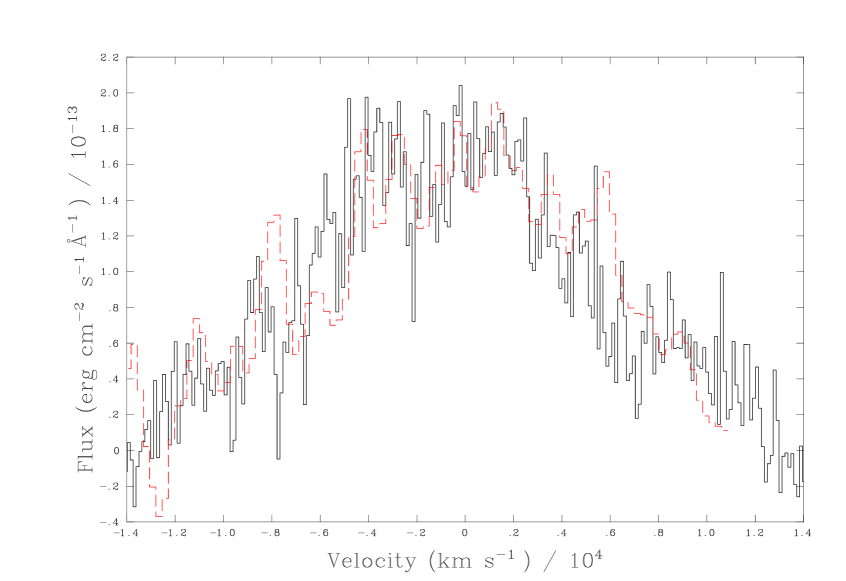
The absence of a sharp low-velocity core in Ly/N v and C iv results in both these features having about half the rest-frame equivalent widths (38 and 22Å respectively) of those in 3C 273 or in the mean HST spectrum. Despite the blueshifts, the Ly/N v and C iv profiles are quite similar (Fig. 5). Neither the He ii nor C iii] lines are clearly detected, the latter possibly indicating a dense BLR. The upper limit for C iii] ( erg cm-2 s-1 gives a line strength relative to C iv of about half the average (Kuraszkiewicz et al. 2002; Telfer et al. 2002).
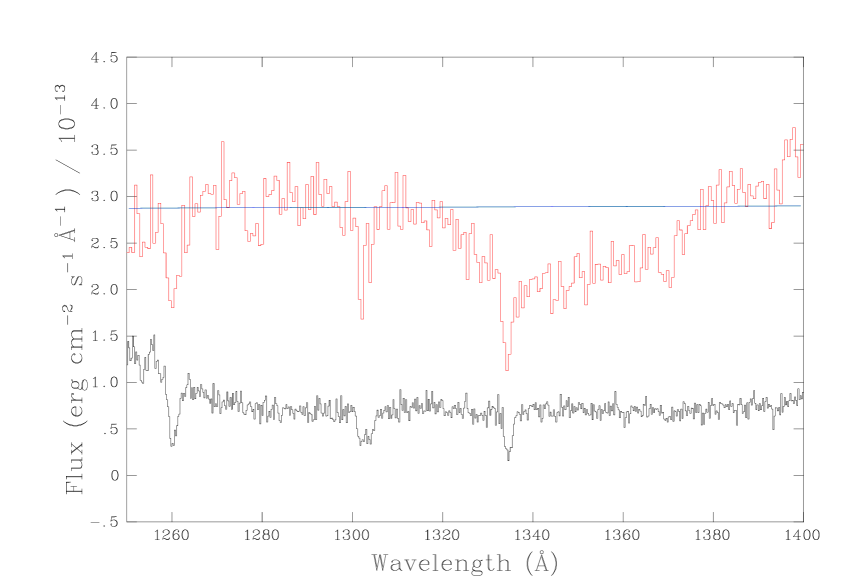
Aside from the blueshifted C iv line, the most striking feature in the UV spectrum of PDS 456 is a broad absorption trough centred around an observed wavelength of . For illustration, we show in Fig. 6 the observed spectrum of PDS 456 shortward of the Ly/N v emission line compared to that of a typical, low-redshift AGN, NGC 3783. The same narrow, Galactic absorption features can be seen, but not the broad absorption trough. If identified as Ly absorption, the broad absorption feature in PDS 456 is blueshifted by 14000–24000 km s-1 relative to the optical/IR narrow emission lines.
4 Discussion
The UV spectrum of PDS 456 displays three unusual properties: very large emission lines blueshifts of 4000–5000 km s-1 for the C iv and Si IV/O iv lines; very broad UV emission lines (FWHM km s-1) which lack a narrow core; and a broad, blueshifted absorption trough, which if identified with Ly extends from to km s-1. The fact that these features are seen in a quasar with a massive, high velocity, high-ionization X-ray outflow strongly suggests a connection between the UV and X-ray properties.
4.1 Emission Line Properties
Comparing with the UV emission-line properties of AGN derived by Kuraszkiewicz et al. (2002), the broad-line widths for PDS 456 are in the upper 10 per-cent of the population for Ly/N v and C iv . If we compare with the broad base of the lines, as fitted by Kuraszkiewicz et al., the line widths in PDS 456 are still in the upper 20% of the population. The line strengths relative to the UV continuum are about half the mean values except for Si iv/O iv. The ratios of the higher ionization broad lines to Ly in PDS 456 are at the high end of the observed distribution for AGN.
The biggest difference in broad line properties for PDS 456 comes when comparing the blueshifts. It is well known that high-ionization broad emission-lines are often blueshifted relative to the low-ionization lines (e.g. Wilkes 1984, Espey et al. 1989), but the blueshifts are usually modest. For 794 radio-quiet quasars Richards et al. (2002) find a median C iv blueshift relative to Mg ii of 824 km s-1. They find blueshifts above 2000 km s-1 are rare and none of their sample have confirmed values above 3000 km s-1. At 5000 km s-1, PDS 456 has the largest C iv blueshift known to date.
To explain the C iv emission-line blueshifts, Richards et al. (2002) propose an absorption model, in which objects with larger blueshifts are those in which the red wing of the emission-line has been absorbed. We note that PDS 456 has a C iv blueshift about double that of any object in the Richards et al. sample. Sub-dividing their sample by increasing amounts of blueshift, Richards et al. find those with larger blueshifts have a weaker than average Ly/N v ratio and weaker He ii , but a similar Si iv/O iv ratio. Although at first sight PDS 456 does not seem to violate these trends, if we wish to explain the blueshift by saying C iv is strongly absorbed in the red wing it would imply a very large amount of absorption, an extremely large velocity range for the “unabsorbed” line and would not explain why it looks similar in profile to Ly/N v and a similarly blueshifted, albeit noisy, Si iv/O iv feature.
4.2 Outflows and the Broad Emission Lines
Broad UV absorption features of similar strength and velocity width to that of the Ly absorption feature seen in PDS 456 are seen in broad absorption-line quasars (BALs; e.g. Turnshek 1984). However, we do not unambiguously detect the usual N v and C iv BALs. Unfortunately the Mg ii feature falls at the atmospheric cut-off of the optical spectrum and is beyond the range of the HST spectrum. Hence we cannot place firm constraints on the ionization state of the UV absorber. It could be argued that the UV broad absorption feature in PDS 456 is actually highly blueshifted N v absorption, but then we cannot explain the lack of strong C iv absorption as both lines are commonly seen, with similar strength, in BAL quasars. Similarly, if we assume the lack of a narrow emission-line core in Ly is due to N v absorption, this would place the N v BAL at a much lower velocity than the Ly absorption. The detection of a single BAL feature poses a problem in comparing with traditional BAL quasars and it could be argued PDS 456 is a different sort of AGN. Nevertheless, we discuss PDS 456 below in the context of such objects.
The origin of the BAL phenomenon in QSOs is unclear, but recent studies suggest they are drawn from the same parent population as other quasars (Reichard et al. 2003). If so, that implies BALs are present in all AGN but are only visible from certain orientations (e.g. Weymann et al. 1991). Many BAL acceleration mechanisms have been proposed, such as line-driving (Murray et al. 1995) or hydromagnetic driving (Königl & Kartje 1994). Line-driven winds models are the most commonly considered. The observed ionization state of the UV absorbing gas implies it must be shielded from the full ionizing continuum (Murray et al.) and such gas arises naturally in simulations of line-driven accretion disk winds (e.g. Proga, Stone & Kallman 2000). The shielding gas has sufficient column density to provide significant soft X-ray absorption in BAL quasars, as appears to be the case for some objects (e.g., Gallagher et al. 2002).
In the context of BAL wind models, PDS 456 could be viewed as a high-ionization analogue of the BAL quasars, in which the bulk of the absorbing gas, including the “shield”, has been ionized, and is observed as a high ionization, high-velocity absorber in the X-ray (Reeves, O’Brien & Ward 2003). The implied high accretion rate and large C iv blueshift in PDS 456 are properties associated with an increased likelyhood of absorption/BALs (Reichard et al. 2003; Gallagher et al. 2004). However, this apparent similarity should not be taken as proof that the X-ray outflow gas in PDS 456 is simply driven in the same way as a BAL. It is hard to envisage a scenario in which a highly-ionized, high velocity outflow such as that in PDS 456 is driven purely by line or continuum radiation (see also Everett & Ballantyne 2004). The evidence for magnetic flaring in PDS 456 (Reeves et al. 2002) suggest rather that hydromagnetic driving could be an important driving mechanism. If so, the geometry of the outflow need not be along the disk plane, as commonly invoked for accretion disk wind models. We note that the kinetic energy of the X-ray outflow ( erg s-1) is comparable to the energy input required to explain the largest radio galaxies, assuming they are built over yr. The outflow could, therefore, be viewed as a wider, slower, higher-mass version of a relativistic jet.
PDS 456 has a far-infrared luminosity comparable to that of an Ultra-Luminous Infrared Galaxy (ULIRG), such as Arp 220, but it has a relatively low CO luminosity (Yun et al. 2004), and hence a relatively low mass of molecular gas. Yun et al. suggest that it may be evolving from being a ULIRG into a QSO. The massive, highly-ionized outflow in PDS 456, indicative of a massive black hole accreting at a high rate, may then be due to it having undergone a recent “accretion event” which has triggered a phase of high activity. PDS 456 may therefore be a relatively young, or refuelled, AGN, which would help explain it having a bolometric luminosity more typical of objects.
The large outflow velocity found for the X-ray absorber (blueshift km s-1) is much larger than that of the UV broad absorption (blueshift 14000–24000 km s-1) and the broad emission lines (blueshifts up to 5000 km s-1). One possibility is that the UV features are due to a decelerating, cooling outflow. In this scenario the X-ray outflow could be the source of at least some of the BLR, most likely the high-ionization gas component. The mass-loss rate derived from the X-ray data of yr-1 is more than sufficient to replenish the M⊙ of gas required to explain the observed C iv 1549 emission. To constrain this model we need to place firm limits on the N v, Si iv and C iv absorption features which are commonly seen in BAL quasars. If no UV high-ionization absorption were detected but only Ly, that could imply the Ly absorber is a different component, which would be curious given its similar blueshift to the highly-ionized X-ray absorbing material. To obtain a higher-quality UV spectrum requires the repair of HST or the provision of a replacement. Also crucial to constraining the otuflow will be a recently approved higher-resolution Astro-E2/XRS observation. These data will probe the velocity and ionization structure and possibly reveal lower ionization X-ray features analagous to those seen in the UV.
Acknowledgements
Based on observations made with the NASA/ESA Hubble Space Telescope, obtained at the Space Telescope Science Institute, which is operated by the Association of Universities for Research in Astronomy, Inc., under NASA contract NAS 5-26555. These observations are associated with program 8264.
References
Chartas, G., Brandt, W.N., Gallagher, S.C., Garmire, G.P., 2002, ApJ,
579, 169
Chartas, G., Brandt, W.N., Gallagher, S.C., 2003, ApJ, 595, 85
Dasgupta, S., Rao, A.R., Dewangan, G.C., Agrawal, V.K., 2005, ApJ,
618, L87
Espey, B.R., Carswell, R.F., Bailey, J.A., Smith, M.G., Ward, M.J.,
1989, ApJ, 342, 666
Everett, J.E., Ballantyne, D.R., 2004, ApJ, 615, L13
Gallagher, S.C., Brandt, W.N., Chartas, G., Garmine, G.P., 2002, ApJ,
567, 37
Gallagher, S.C., Richards, G.T., Hall, P.B., Brandt, W.N., Schneider,
D.P., Vanden Berk, D.E., 2004, ApJ, in press (astro-ph/0410641)
Howarth, I.D., Murray, J., Mills, D., Berry, D.S., Starlink User Note
50.21, Rutherford Appleton Laboratory
Königl, A., Kartje, J.F., 1994, ApJ, 424, 446
Kuraszkiewicz, J.A., Green, P.J., Forster, K., Aldcroft, T.L., Evans,
I.N., Koratkar, A., 2002, ApJS, 143, 257
McKernan, B., Yaqoob, T., Reynolds, C.S., 2004, ApJ, 617, 232
Miller P., Rawlings S., Saunders S., Eales S., 1992, MNRAS, 254, 93
Murray, N., Chiang, J., Grossman, S.A., Voit, G.M., 1995, ApJ, 451,
498
Pounds, K.A., Reeves, J.N., King, A.R., Page, K.L., O’Brien, P.T.,
Turner, M.J.L., 2003a, MNRAS, 345, 705
Pounds, K.A., King, A.R., Page, K.L., O’Brien, P.T., 2003b, MNRAS, 346, 1025
Proga, D., Stone, J.M., Kallman, T.R., 2000, ApJ, 543, 686
Reeves, J.N., O’Brien, P.T., Vaughan, S., Law-Green, D., Ward, M.J.,
Simpson, C., Pounds, K.A., Edelson, R.A., 2000, MNRAS, 312, L17
Reeves, J.N. Wynn, G., O’Brien P.T., Pounds, K.A., 2002, MNRAS, 336,
L56
Reeves, J.N., O’Brien, P.T., Ward, M.J., 2003, ApJ, 593, L65
Reichard, T.A., et al., 2003, AJ, 126, 259
Richards, G.T., Vanden Berk, D.E., Reichard, T.A., Hall, P.B.,
Schneider, D.P., Subbarao, M., Thakar, A.R., York, D.G., 2002, AJ,
124, 1
Seaton, M., 1979, MNRAS, 187, 73P
Simpson C., Ward M.J., O’Brien P.T., Reeves J.N., 1999, MNRAS,
303, L23
Telfer, R.C., Zheng, W. Kriss, G.A., Davidsen, A.F., 2002, ApJ, 565,
773
Torres C.A.O., et al., 1997, ApJ, 488, L19
Turnshek, D.A., 1984, ApJ, 280, 51
Vanden Berk et al., 2001, AJ, 122, 549
Weymann, R.J., Morris, S.L., Foltz, C.B., Hewett, P.C., 1991, ApJ,
373, 23
Wilkes, B.J., 1984, MNRAS, 207, 73
Yuan, W., Brinkmann, W., Siebert, J., Voges, W., 1998, A&A, 330, 108
Yun, M.S., Reddy, N.A., Scoville, N.Z., Frayer, D.T., Robson, E.I.,
Tilanus, R.P.J., 2004, ApJ, 601, 723