Pulling out Threads from the Cosmic Tapestry:
Defining Filaments of Galaxies
Abstract
Filaments of galaxies are the dominant feature of modern large
scale redshift surveys. They can account for up to perhaps half
of the baryonic mass budget of the Universe and
their distribution and abundance can help
constrain cosmological models. However, there remains no
single, definitive way in which to detect, describe and define
what filaments are and their extent. This work examines a
number of physically motivated, as well as statistical,
methods that can be used to define filaments and
examines their relative merits.
Keywords: large scale structure of Universe – cosmology: observations – methods: observational
1 Motivation
What is a filament of galaxies (FOG)? Although at first glance, this is a seemingly innocuous, benign and near-trivial question, there is not really a straight forward answer to it. Many authors, including the present one, have recently been searching for more concrete definitions and hence, also, methods of finding and detecting FOGs (e.g. Pimbblet 2005 and references therein).
The present work is therefore a timely review of the (growing) myriad of approaches that exist to define and detect FOGs in an attempt to answer the question of what a FOG actually is. In a lot of ways, investigations of FOGs nowadays are arguably analogous to where the investigations of galaxy clusters stood at about one half of a century ago (see Abell 1965 for an excellent, albeit somewhat dated by todays standards, review of galaxy clustering). Undoubtedly, the reason for the recent flurry of activity into investigating and characterizing FOGs has to be the availability of modern, high-quality and, most importantly, wide-field redshift surveys such as the 2dF Galaxy Redshift Survey (2dFGRS; e.g. Colless et al. 2001), the Sloan Digital Sky Survey (SDSS; e.g. Abazajian et al. 2004), the 6dF Galaxy Survey (6dFGS; e.g. Jones et al. 2004) and the Las Campanas Redshift Survey (LCRS; e.g. Shectman et al. 1996).
Having written that, the discovery of significant segments of large-scale structure other than galaxy clusters – sheets, filaments and walls of galaxies – is not a new thing. Geller & Huchra (1989) famously cartographed the ‘Great Wall’ from the CfA redshift survey (e.g. Huchra et al. 1983): a highly significant feature that stretches for at least Mpc at km s-1 (Figure 1). So significant is this detection, that it should even have an imprint on the cosmic microwave background radiation (Atrio-Barandela & Kashlinsky 1992; see also Chodorowski 1994).

What else may we expect from FOGs? We know that in hierarchical structure formation modeling there has long been the prediction that galaxy clusters grow through repeated mergers with other galaxy clusters (and galaxy groups) together with continuous accretion of their surrounding matter (e.g. Zeldovich, Einasto & Shandarin 1982; Katz et al. 1996; Jenkins et al. 1998; Colberg et al. 2000; see also Bond, Kofman & Pogosyan 1996). We also know that the accretion process occurs in a highly non-isotropic manner: galaxy filaments funnel matter onto large clusters along preferred directions (see Pimbblet 2005; Ebeling, Barrett & Donovan 2004; Kodama et al. 2001). Beyond a few virial radii from galaxy clusters centres, FOGs are predicted to weave a complex, web- or sponge-like tapestry that gives surveys like SDSS, 6dFGS, 2dFGRS & LCRS their distinctive appearance (Figure 2; see also the 2dFGRS homepage at www.mso.anu.edu.au/2dFGRS ).

We also know that FOGs are highly important for the mass budget of the Universe (e.g. Colberg et al. 1999). Indeed, Cen & Ostriker (1999) show that for a cold dark matter (CDM) Universe, a large fraction, perhaps as much as half (Fukugita, Hogan & Peebles 1998), of baryonic material will not have been observed as it is situated in the inter-cluster media in a hot and tenuous gaseous phase. Along with the dark matter component and perhaps up to a quarter of the galaxian population, these baryons are preferentially situated in (inter-cluster) FOGs. Moreover, FOGs can provide tests of structure formation (c.f. Colberg, Krughoff & Connolly 2004 with Pimbblet, Drinkwater & Hawkrigg 2004) and cluster evolution (see Colberg et al. 1999). They can also be useful in ascertaining the homogeneity scale of our Universe (if, indeed one considers there to be a homogeneity scale; e.g. Coleman & Pietronero 1992 and references therein). Certainly, given that objects with scale lengths Mpc exist and are not chance superpositions, we should be questioning the validity of the cosmological assumption up to such lengths and beyond.
The rest of this paper plans out as follows. In Section 2, we investigate the numerous methods that one can employ to detect FOGs and explore their relative merits. In Section 3 we discuss the findings and present our conclusions.
2 Detection
Already we have seen a number of properties of FOGs. If sufficiently large, then they can cause a decrement in the cosmic microwave background radiation. They also possess multi-wavelength visibility (visual; X-ray; etc.). We describe below how one may take advantage of such properties to detect them in a given dataset.
2.1 Optical Overdensity
At a very simple level, a FOG is merely an overdensity of galaxies compared to the local field111Here, we use the term ‘field’ to mean the ‘average background’ level. (or void) level. Pimbblet & Drinkwater (2004) use this fact to find a relatively short ( Mpc) filament between the two close (both in redshift and spatially) galaxy clusters ACO1079 and ACO1084. Mathematically, one can readily compute this galaxy excess as
| (1) |
Should the observed field sample be too close to the observed filament sample it will obviously contain some (small but non-negligible) amount of contamination:
| (2) |
where is the ratio between the galaxy densities of the filament and field populations (Paolillo et al. 2001). Substituting instead of from Eq. (2) into Eq. (1) gives
| (3) |
In Figure 3 we plot an adaptation of the result obtained by Pimbblet & Drinkwater (2004) utilizing this particular method. Most of the excess galaxy population is faint, with only a few brighter members. Moreover, only a small fraction ( per cent) of these galaxies have colours consistent with early-type galaxies from the two clusters colour-magnitude relations (Pimbblet et al. 2002). In shallow (perhaps, mono-colour) surveys with no supporting redshift information, therefore, such an approach is probably not very efficient nor exceedingly sensitive and may be somewhat prone to large errors.

2.2 X-ray
Given that a non-negligible fraction of baryonic material in a CDM Universe may exist as hot inter-cluster gas, one can also consider looking for FOGs in X-ray band passes. Using the ROSAT All-Sky Survey data, Briel & Henry (1995) attempted just this by combining together the inter-cluster regions of 40 cluster pairs. Although they failed to find any X-ray emitting FOG, they did place an upper limit on the X-ray surface brightness of ergs cm-2 s-1 (0.5 – 2.0 keV).
Scharf et al. (2000) make a joint X-ray/optical detection of Mpc (0.5 deg) FOG with a surface brightness of ergs cm-2 s-1. The count rate for this filament, however, is above background levels.
In the Shapley supercluster meanwhile, Kull & Böhringer (1999) find a promising extended X-ray emission between a close cluster pair that is times brighter than Briel & Henry’s (1995) bound. The only problem here is that Scharf et al. (2000) note that the X-ray emission could be ejecta due to the clusters interacting (merging) with one another rather than material falling in from an actual filament.
More promising progress on this front has been made by Tittley & Henriksen (2001) and Durret et al. (2003). The former detect a gaseous FOG between ACO3391 and ACO3395 that has a minimum flux of ergs cm-2 s-1 (0.8–10 keV) and represents at least 2 per cent of the total mass of the system. The latter team study the ACO85 cluster complex and find a highly elongated filamentary structure. Again, however, this filament may the result of cluster interactions and not a true FOG in the large-scale structure sense.
It would seem that whilst one may expect there to be significant X-ray emission from baryonic material contained in FOGs, we are not quite detecting it with sufficient regularity or confidence to use X-ray emission as the primary tool for FOG detection (unlike in the case of galaxy clusters where X-ray detections are made with much more confidence; e.g. Ebeling et al. 1996).
2.3 Lensing
Pogosyan et al. (1998) point out that FOGs that connect together neighbouring galaxy clusters should have sufficient surface mass density as to be detectable in the weak lensing regime. Indeed, weak lensing would only depend upon the projected density and not the square of the projected density like X-rays are (Pogosyan et al. 1998) and therefore it may constitute an altogether better way of detecting and defining FOGs. There are a small number of investigations that have been proceeding in this direction.
Kaiser et al. (1998) perform a lensing analysis on the supercluster MS 0302+17 and find FOG between two of its three component galaxy clusters. The detection has remained dubious, however, as there may be foreground structure interfering, perhaps some edge of chip effects and residual systematics in the point spread function anisotropy correction involved (Gavazzi et al. 2004). Indeed, Gavazzi et al. (2004) report that they cannot independently confirm the detection of this particular FOG.
Meanwhile, in other investigations, Clowe et al. (1998) report on the detection of a FOG extending from the rich cluster RXJ 1716+67. However, the size of their imaging is small and it is thus unknown how far this filament extends in the direction of a nearby cluster. Gray et al. (2002) examines the ACO901/902 supercluster and find a FOG present. The significance of the detection is, however, small. Superposed with this is the issue that the filament lies in the inter-chip region of the analysis. Nonetheless, this remains a relatively good detection when compared to the problems that Kaiser et al. (1998) encounter.
Yet to date, arguably one of the best weak lensing FOG detections has to be that of Dietrich et al. (2004) between ACO222 and ACO223. Not only is the filament detected by weak lensing, but Dietrich et al. (2004) supply supporting evidence from X-ray emission and increased galaxy density between the clusters. Dietrich et al. (2004) point out, however, that they could not find an objective way to define their filament and in this respect their filament candidate is not very different to that of Kaiser et al. (1998).
So, it would appear that given imaging of sufficient quality and depth, weak lensing could provide an excellent way of detecting FOGs, most especially in combination with other methods (e.g. X-ray; see above).
2.4 Redshifts
Redshifts of regions around galaxy clusters can provide concrete determinations of the presence of FOGs. For example, Ebeling, Barrett & Donovan (2004) report on a 4 Mpc filament that is feeding the growth of the massive cluster MACS J0717.5+3745 at . Its extent beyond the virial radius of the cluster means that it cannot be the remnant of some previous interaction or merger whilst its colours are quite consistent with the colour-magnitude relation (CMR; e.g. Visvanathan & Sandage 1977; Bower, Lucey & Ellis 1992) Indeed, the CMR and other photometric redshift techniques can also help to better define FOGs. Kodama et al. (2001) report several ‘octopus’-like tentacles around ACO851 () which have colours entirely consistent with the CMR of the cluster itself. Pimbblet, Edge & Couch (2005) locate a large scale wall covering at least 40 Mpc situated in front of ACO22 (; Figure 4). Not only does this wall exhibit a CMR similar to ACO22, but it also has a Butcher & Oemler (1984; see Pimbblet 2003 for a review of the Butcher-Oemler effect) blue fraction that does not change significantly between the cluster and the wall (Figure 4).

The above are examples of FOGs around individual clusters. Of course, it is the modern large redshift surveys such as 2dFGRS, 6dFGS, SDSS and LCRS that are providing the community with an unprecedented view of the very large scale structure of the Universe (e.g. Figure 2). With such large datasets, finding individual filaments can become as easy as looking at the regions between two galaxy clusters in three dimensional space and making an appropriate cut at some galaxy density threshold222Pimbblet, Edge & Couch (2005) note that the typical surface density of FOGs is of the order 10 bright (brighter than say ) galaxies per square h-1 Mpc. to determine if there is a significant overdensity of galaxies present (e.g. Pimbblet, Drinkwater & Hawkrigg 2004). One potential pitfall is that one may mistake a redshift space distortion (see Hawkins et al. 2003) for a FOG. Pimbblet, Drinkwater & Hawkrigg (2004) circumvent this by only considering cluster-cluster pairs within 1000 kms-1 of each other and check the FOG distribution angles along the line of sight to ensure that no ‘fingers of god’ are mistaken for FOGs (and conversely, no end-on FOG is mistaken for a cluster!). Also, surveys like 2dFGRS only cream off the very luminous galaxies (and even at bright magnitudes, are incomplete; Cross et al. 2004). They tell us little about the low surface brightness populations which likely contribute a non-negligible fraction of any FOG’s mass. The next-generation of deeper redshift surveys (e.g. using AA on the Anglo-Australian Telescope) should help us to address this point.
We note in passing, however, that one potentially unanswered question is whether a FOG can exist that is not connected to any cluster? If they can, this would bias the results of these kind of investigations which focus exclusively on intercluster regions as the locations to search out FOGs. Recent work by Fairall et al. (2004) suggests, however, that there can be no isolated FOGs.
2.5 Further Statistical Methods
Given that the large redshift surveys may contain several hundred FOGs, it can be better to approach the entire FOG population in a more consistent (and less time-consuming) manner. There are a multitude of statistics available for the analysis of large-scale structure and FOGs, and here we only review a small, representative selection of these approaches.
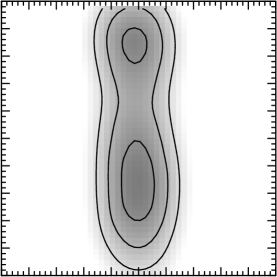
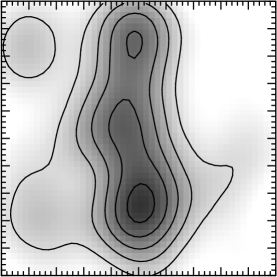
Some readers may be familiar with the children’s game ‘connect the dots’ (CTD herein). The idea is to connect a series of points on a plane, in a particular sequence, in order to form some kind of picture at the end of it. One well known relative of CTD is the travelling salesman problem where the challenge is to connect some points in by shortest possible route. Yet finding FOGs in redshift surveys like 2dFGRS can also be thought of as another variant of CTD types of games (Arias-Castro et al. 2004). Consider a toy-model: a two dimensional curve that one randomly333Random numbers are generated using the method of Pimbblet & Bulmer (2005). samples points from along its length (i.e. galaxies contained in a FOG). Add in some random noise, and now the problem becomes whether we are able to recover the original curve (FOG) in the presence of clutter (field galaxies; chance superpositions; etc.). Donoho and collaborators (e.g. Arias-Castro et al. 2004) approach the CTD problem from a number of angles. One promising method is to make use of a multiscale adaptive geometric analysis. By using a zoo of parallelogram strips of various angles, lengths, widths and eccentricities one can evaluate (count) the galaxy population in all such strips. Then all one has to do is identify strips with unusually high count rates and search for long runs of such strips that would constitute a good continuation of a given curve. The problem with this analogy is that FOGs are not perfect lines or curves: they can be bumpy, lumpy and clumpy in three dimensions (Figure 5). Finding a FOG that is only just above the density of the clutter can prove to be hard (Figure 5), especially if one is interested in the morphology of FOGs.


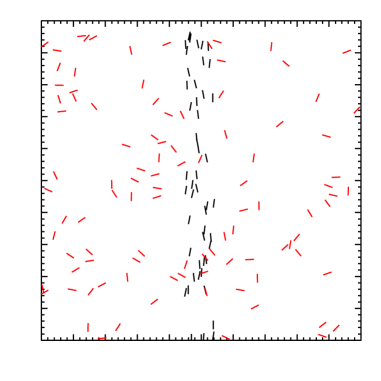
However, if one can make use of galaxy orientation angles (Pimbblet 2005), this problem now becomes vectorized (a so-called ‘connect-the-darts’ problem) and potentially easier to solve (Figure 6; Arias-Castro et al. 2004). We know from early work by Binggeli (1982) that the major axis of galaxy clusters are generally aligned exceptionally well with their first-ranked (usually a cD-type) galaxy and that close cluster pairs generally point to each other. Moreover in CDM, filamentary structure funnels material along preferred directions toward clusters. Since galaxy alignment tends to follow the orientation of clusters and the filaments that feed them, Pimbblet (2005; and references therein) took advantage of this fact by computing the degree of galaxy angle anisotropy for a selected region of the sky. Regions that have significantly anisotropic distributions of galaxy angles (as in Figure 6) readily show up.
Since it is easy to think of galaxies as points within large-scale surveys, it is no surprise that one can apply many mathematical approaches to delineating FOGs and other intrinsic patterns within them. A popular approach is to use a minimal spanning tree formalism (MST herein; e.g. Barrow, Bhavsar & Sonoda 1985; Bhavsar & Ling 1988; Krzewina & Saslaw 1996; Doroshkevich et al. 2000; Doroshkevich et al. 2004 amongst others). One draw back of MST is that it will produce a unique graph for a given set of points. It is known that large-scale surveys such as SDSS and 2dFGRS are incomplete by about 10 to 20 per cent at all magnitudes (Cross et al. 2004; Pimbblet et al. 2001) – a fact that makes MST potentially a poorer choice for analyzing large scale structure with than other methods.
Such other statistical methods, that here we will mention only briefly, include the use of Voronoi (and the complementary Delaunay) tessellations (e.g. van de Weygaert 1994). Essentially, the Voronoi tessellation can be thought of as constructing a skeleton of the Universe by simply finding the bisection line between a single point and every other point. This process is repeated for each point and then the Voronoi tessellation is then the unification of all the halfplanes that have been created (see van de Weygaert 1994 for more indepth detail). Analysis of the cell-like structures of the Voronoi skeleton can inform one about the underlying galaxy distribution, although direct detection of FOGs from these tessellations remains a relatively unattempted task. Minkowski functionals such as shapefinders (e.g. Bharadwaj et al. 2000; Pandey & Bharadwaj 2005; see also Shandarin, Sheth & Sahni 2004) and the genus statistics (e.g. Hoyle et al. 2002; Hoyle, Vogeley & Gott 2002) can also provide us with a direct way of analyzing the structure of the galaxy distribution. Moreover, they can also provide a direct measure of the ‘filamentarity’ and ‘planarity’ of the Universe (e.g. Schmalzing et al. 1999) and one can readily delineate FOGs from them by using an isodensity contour cut. Finally, we should also mention that there are a host of other marked point processes (Stoica et al. 2005 and references therein) which are also capable of recovering individual FOGs. All of these methods highlight the presence of FOGs within redshift surveys to varying degrees.
3 Discussion and Conclusions
Given the above methods to detect FOGs, there is a large amount of literature dedicated to their dissemination. One issue that seems to be prominent in the literature is the mixed nomenclature for FOGs. Many authors refer to them as ‘walls’ (Geller & Huchra 1989), others call them ‘filaments’, some use the term ‘sheets’ or ‘pancakes’. So what is the difference between all these terms? Pimbblet, Drinkwater & Hawkrigg (2004) and Colberg, Krughoff & Connolly (2004) attempt to refine these definitions by dividing detected FOGs into several categories based upon their visual morphology. So the difference between a filament and a wall then becomes a matter of how thick (or, equally, how wide) the FOG is in three-dimensional space (i.e. a filament will have depth width). Sheets are then synonymous with walls. Is this kind of morphological classification useful? Given that walls appear to be much, much rarer than ‘normal’ filaments (Pimbblet, Drinkwater & Hawkrigg 2004) and unlike filaments, they do not possess non-isotropic galaxy orientations (Pimbblet 2005) – yes. Their relative abundances (also filling factors) and lengths should help us to better constrain the ideal cosmological paradigm (e.g. in cold dark matter cosmologies, studies of FOGs can readily exclude bias parameters of ; Bharadwaj & Pandey 2004) as can the number of FOGs connected to clusters of a given mass (Colberg, Krughoff & Connolly 2004).
At the outset of this work, the question ‘what is a filament of galaxies?’ was posed. This work has reviewed a number of methods for finding, detecting and defining FOGs in datasets of varying complexity. Those that are more physically motivated (gravitational weak lensing searches; X-ray searches) appear to be an optimal way to detecting them (especially in unison), but yet, they remain a time-intensive method owing to the required amount of observing time to get down to sufficient limiting magnitudes and fluxes.
We have also investigated how FOGs are detected in large redshift surveys using a variety of methods ranging from simple isodensity thresholding to more involved statistics like the MST. Here, it seems that even the very simple approaches can yield useful results, such as the distribution and abundances of FOG lengths, that are in remarkable agreement with theory.
Acknowledgments
KAP thanks Michael Drinkwater, Alastair Edge and Mary Hawkrigg for their support. This work is financed through the award of a University of Queensland EPSA Research Fellowship and a UQRSF grant.
On a final note, I also wish to express my sincere gratitude to the two referees, Dominique Proust and Tony Fairall, who provided quick and useful reports that have improved the quality of this work.
References
- Abazajian et al. (2004) Abazajian K., et al., 2004, AJ, 128, 502
- Abell (1965) Abell G. O., 1965, ARA&A, 3, 1
- Arias-Castro et al. (2004) Arias-Castro E., Donoho D., Huo X., Tovey C., 2004, Advances in Applied Probability, submitted (www-stat.stanford.edu / donoho / Reports / 2004 / CTD-Arias-etal.pdf)
- Atrio-Barandela & Kashlinsky (1992) Atrio-Barandela F., Kashlinsky A., 1992, ApJ, 390, 322
- Barrow, Bhavsar, & Sonoda (1985) Barrow J. D., Bhavsar S. P., Sonoda D. H., 1985, MNRAS, 216, 17
- Bharadwaj & Pandey (2004) Bharadwaj S., Pandey B., 2004, ApJ, 615, 1
- Bharadwaj et al. (2000) Bharadwaj S., Sahni V., Sathyaprakash B. S., Shandarin S. F., Yess C., 2000, ApJ, 528, 21
- Bhavsar & Ling (1988) Bhavsar S. P., Ling E. N., 1988, ApJ, 331, L63
- Binggeli (1982) Binggeli B., 1982, A&A, 107, 338
- Bond et al. (1996) Bond J. R., Kofman L., Pogosyan, D., 1996, Nature, 380, 603
- Bower, Lucey, & Ellis (1992) Bower R. G., Lucey J. R., Ellis R. S., 1992, MNRAS, 254, 601
- Briel & Henry (1995) Briel U. G., Henry J. P., 1995, A&A, 302, L9
- Butcher & Oemler (1984) Butcher, H. & Oemler, A. 1984, ApJ, 285, 426
- Cen & Ostriker (1999) Cen R., Ostriker J. P., 1999, ApJ, 514, 1
- Chodorowski (1994) Chodorowski M., 1994, MNRAS, 266, 897
- Clowe et al. (1998) Clowe D., Luppino G. A., Kaiser N., Henry J. P., Gioia I. M., 1998, ApJ, 497, L61
- Colberg et al. (2000) Colberg J. M., Krughoff K. S., Connolly A. J., 2004, MNRAS in press (astro-ph/0406665)
- Colberg et al. (2000) Colberg J. M., et al., 2000, MNRAS, 319, 209
- Colberg et al. (1999) Colberg J. M., White S. D. M., Jenkins A., Pearce F. R., 1999, MNRAS, 308, 593
- Coleman & Pietronero (1992) Coleman P. H., Pietronero L., 1992, PhR, 213, 311
- Cross et al. (2004) Cross N. J. G., Driver S. P., Liske J., Lemon D. J., Peacock J. A., Cole S., Norberg P., Sutherland W. J., 2004, MNRAS, 349, 576
- Dietrich et al. (2004) Dietrich J. P., Schneider P., Clowe D., Romano-Diaz E., Kerp J., 2004, preprint, astro-ph/0406541
- Doroshkevich et al. (2000) Doroshkevich A. G., Fong R., McCracken H. J., Ratcliffe A., Shanks T., Turchaninov V. I., 2000, MNRAS, 315, 767
- Doroshkevich et al. (2004) Doroshkevich A., Tucker D. L., Allam S., Way M. J., 2004, A&A, 418, 7
- Durret et al. (2003) Durret F., Lima Neto G. B., Forman W., Churazov E., 2003, A&A, 403, L29
- Ebeling, Barrett, & Donovan (2004) Ebeling H., Barrett E., Donovan D., 2004, ApJ, 609, L49
- Ebeling et al. (1996) Ebeling H., Voges W., Bohringer H., Edge A. C., Huchra J. P., Briel U. G., 1996, MNRAS, 281, 799
- Fairall et al. (2004) Fairall A., Turner D., Pretorius M. L., Wiehahn M., McBride V., de Vaux G., Woudt P. A., 2004, preprint, astro-ph/0411437
- Fukugita, Hogan, & Peebles (1998) Fukugita M., Hogan C. J., Peebles P. J. E., 1998, ApJ, 503, 518
- Gavazzi et al. (2004) Gavazzi R., Mellier Y., Fort B., Cuillandre J.-C., Dantel-Fort M., 2004, A&A, 422, 407
- Geller & Huchra (1989) Geller M. J., Huchra J. P., 1989, Sci, 246, 897
- Gray et al. (2002) Gray M. E., Taylor A. N., Meisenheimer K., Dye S., Wolf C., Thommes E., 2002, ApJ, 568, 141
- Hawkins et al. (2003) Hawkins E., et al., 2003, MNRAS, 346, 78
- Hoyle et al. (2002) Hoyle F., et al., 2002, ApJ, 580, 663
- Hoyle, Vogeley, & Gott (2002) Hoyle F., Vogeley M. S., Gott J. R. I., 2002, ApJ, 570, 44
- Huchra et al. (1983) Huchra, J., Davis, M., Latham, D., & Tonry, J. 1983, ApJS, 52, 89
- Jenkins et al. (1998) Jenkins A., et al., 1998, ApJ, 499, 20
- Jones et al. (2004) Jones D. H., et al., 2004, MNRAS, 355, 747
- Kaiser et al. (1998) Kaiser N., Wilson G., Luppino G., Kofman L., Gioia I., Metzger M., Dahle H., 1998, preprint, astro-ph/9809268
- Katz et al. (1996) Katz N., Weinberg D. H., Hernquist L., Miralda-Escude J., 1996, ApJ, 457, L57
- Kodama et al. (2001) Kodama T., Smail I., Nakata F., Okamura S., Bower R. G., 2001, ApJ, 562, L9
- Krzewina & Saslaw (1996) Krzewina L. G., Saslaw W. C., 1996, MNRAS, 278, 869
- Kull & Böhringer (1999) Kull A., Böhringer H., 1999, A&A, 341, 23
- Pandey & Bharadwaj (2005) Pandey B., Bharadwaj S., 2005, MNRAS, 357, 1068
- Paolillo et al. (2001) Paolillo M., Andreon S., Longo G., Puddu E., Gal R. R., Scaramella R., Djorgovski S. G., de Carvalho R., 2001, A&A, 367, 59
- Pimbblet (2005) Pimbblet K. A., 2005, MNRAS, 358, 256
- Pimbblet, Edge, & Couch (2005) Pimbblet K. A., Edge A. C., Couch W. J., 2005, MNRAS, 357, L45
- Pimbblet & Bulmer (2005) Pimbblet K. A., Bulmer M., 2005, PASA, 22, 1
- Pimbblet, Drinkwater, & Hawkrigg (2004) Pimbblet K. A., Drinkwater M. J., Hawkrigg M. C., 2004, MNRAS, 354, L61
- Pimbblet & Drinkwater (2004) Pimbblet K. A., Drinkwater M. J., 2004, MNRAS, 347, 137
- Pimbblet (2003) Pimbblet K. A., 2003, PASA, 20, 294
- Pimbblet et al. (2002) Pimbblet K. A., Smail I., Kodama T., Couch W. J., Edge A. C., Zabludoff A. I., O’Hely E., 2002, MNRAS, 331, 333
- Pimbblet et al. (2001) Pimbblet K. A., Smail I., Edge A. C., Couch W. J., O’Hely E., Zabludoff A. I., 2001, MNRAS, 327, 588
- Pogosyan et al. (1998) Pogosyan D., Bond J. R., Kofman L., Wadsley J., 1998, in Wide Field Surveys in Cosmology, 14th IAP meeting held May 26-30, 1998 (Paris: Editions Frontieres), 61
- Scharf et al. (2000) Scharf C., Donahue M., Voit G. M., Rosati P., Postman M., 2000, ApJ, 528, L73
- Schmalzing et al. (1999) Schmalzing J., Buchert T., Melott A. L., Sahni V., Sathyaprakash B. S., Shandarin S. F., 1999, ApJ, 526, 568
- Shandarin, Sheth, & Sahni (2004) Shandarin S. F., Sheth J. V., Sahni V., 2004, MNRAS, 353, 162
- Shectman et al. (1996) Shectman S. A., Landy S. D., Oemler A., Tucker D. L., Lin H., Kirshner R. P., Schechter P. L., 1996, ApJ, 470, 172
- Stoica et al. (2004) Stoica R. S., Martinez V. J., Mateu J., Saar E., 2005, A&A, in press (astro-ph/0405370)
- Tittley & Henriksen (2001) Tittley E. R., Henriksen M., 2001, ApJ, 563, 673
- van de Weygaert (1994) van de Weygaert R., 1994, A&A, 283, 361
- Visvanathan & Sandage (1977) Visvanathan N., Sandage A., 1977, ApJ, 216, 214
- Zeldovich, Einasto, & Shandarin (1982) Zeldovich I. B., Einasto J., Shandarin S. F., 1982, Nature, 300, 407