A wide-field photometric study of the globular cluster system of NGC 4636
Previous smaller-scale studies of the globular cluster system of NGC 4636, an elliptical galaxy in the southern part of the Virgo cluster, have revealed an unusually rich globular cluster system. We re-investigate the cluster system of NGC 4636 with wide-field Washington photometry. The globular cluster luminosity function can be followed roughly 1 mag beyond the turn-over magnitude found at for the blue cluster sub-population. This corresponds to a distance modulus of , 0.4 mag larger than the distance determined from surface brightness fluctuations. The high specific frequency is confirmed, yet the exact value remains uncertain because of the uncertain distance: it varies between and . The globular cluster system has a clearly bimodal color distribution. The color peak positions show no radial dependence and are in good agreement with the values found for other galaxies studied in the same filter system. However, a luminosity dependence is found: brighter clusters with an “intermediate” color exist. The clusters exhibit a shallow radial distribution within 7′, represented by a power-law with an exponent of -1.4. Within the same radial interval, the galaxy light has a distinctly steeper profile. Because of the difference in the cluster and light distribution the specific frequency increases considerably with radius. At 7′ and 9′ the density profiles of the red and blue clusters, respectively, change strongly: the power-law indices decrease to around -5 and become similar to the galaxy profile. This steep profile indicates that we reach the outer rim of the cluster system at approximately 11′. This interpretation is supported by the fact that in particular the density distribution of the blue cluster population can be well fit by the projection of a truncated power-law model with a core. This feature is seen for the first time in a globular cluster system. While the radial distribution of the cluster and field populations are rather different, this is not true for the ellipticity of the system: the elongation as well as the position angle of the cluster system agree well with the galaxy light. We compare the radial distribution of globular clusters with the light profiles for a sample of elliptical galaxies. The difference observed in NGC 4636 is typical of an elliptical galaxy of this luminosity. The intrinsic specific frequency of the blue population is considerably larger than that of the red one. 111 Tables A.1. to A.6. are only available in electronic form at the CDS via anonymous ftp to cdsarc.u-strasbg.fr (130.79.128.5) or via http://cdsweb.u-strasbg.fr/cgi-bin/qcat?J/A+A/
Key Words.:
galaxies: elliptical and lenticular,cD – galaxies: individual: NGC 4636 – galaxies: star clusters – galaxies: stellar content – galaxies: structure1 Introduction
The question as to what extent the study of globular cluster systems (GCSs) can contribute to the understanding of galaxy formation has been studied by many authors (e.g. Beasley et al. beasley02 (2002), Côté et al. cote02 (2002), Forbes et al. forbes97 (1997), Ashman & Zepf ashman92 (1992)) but a satisfactory answer can still not be given. A guide to the answer could be the relation between global properties of GCSs and properties of their host galaxy. However, even when considering seemingly well-established statements, one faces complications when new and better observations become available.
An example is the specific frequency introduced by Harris & van den Bergh (harris81 (1981)), with N being the total number of globular clusters (GCs) and the absolute visual magnitude of the host galaxy. Theory states that central galaxies in galaxy clusters should exhibit -values about a factor 3 higher than galaxies in the field, which typically have values of 3-4 (e.g. Harris harris01 (2001), Elmegreen elmegreen99 (1999), Ashman & Zepf ashman98 (1998)). This mainly refers to 3 central galaxies, NGC 4486 (M87) in Virgo, NGC 1399 in Fornax and NGC 3311 in Hydra I. But recent wide-field photometry of the GCS of NGC 1399 revealed only (Dirsch et al. 2003a ), because the galaxy’s total brightness was previously underestimated (confirming an earlier claim by Ostrov et al. ostrov98 (1998)). Although still somewhat higher than the average for ellipticals, it turns out to be significantly lower than in previous studies.
NGC 4636, the southernmost bright elliptical galaxy in the Virgo cluster, is a counter example to the rule that high specific frequencies are related to central cluster galaxies: it is a relatively isolated field galaxy and shows a peculiarly high . In that and in other aspects, this elliptical galaxy is intriguing. Because of its X-ray brightness, NGC 4636 has been studied extensively in this frequency range and these observations have also been used to study the dark matter distribution. A surprisingly massive dark halo has been deduced by Loewenstein & Mushotzky (loewenstein03 (2003)): even well inside the effective radius the dark matter constitutes a large if not the major fraction of the total mass, which is a unique case. Its bright, diffuse X-ray halo is atypical for an isolated galaxy and comparable in luminosity and extension to a central cluster galaxy (e.g. Xu et al. xu02 (2002), Jones et al. jones02 (2002), Matsushita et al. matsushita98 (1998), Awaki et al. awaki94 (1994)).
NGC 4636 also shows an unusual behavior in the far infrared. Temi et al. (temi03 (2003)) found that its FIR luminosity between 40 m and 80 m is a factor of 50 higher than what is expected from the dust emission produced by its stellar body, a model that fits other elliptical galaxies quite well. Temi et al. speculate that a recently merged, dusty, gas-rich dwarf galaxy might explain the excess luminosity. Unfortunately, existing H i observations cannot be used to support or rule out this idea: while Knapp et al. (knapp78 (1978)), Gallagher (gallagher78 (1978)) and Bottinelli & Gougenheim (bottinelli78 (1978)) reported an extended H i disk with a mass of , Krishna Kumar & Thonnard (krishna83 (1983)) found only an upper limit of in NGC 4636.
The globular cluster system of NGC 4636 has been investigated by Hanes et al. (hanes77 (1977)) and Kissler et al. (kissler94 (1994)). They found very large specific frequencies of and , respectively. These values are typical for central galaxies and not for an elliptical in a low density region such as southern border of the Virgo cluster. With such a specific frequency NGC 4636 would have one of the highest values known. However, the study by Hanes et al. was based on photographic material and Kissler et al. only used V-band observations. It is therefore of great interest to confirm or revise the anomalous specific frequency by new deep photometry in more than one color band. A further objective is to determine the distance using the globular cluster luminosity function (GCLF) and the spatial distribution of the GCs.
As illustrated for NGC 1399 by Ostrov et al. (ostrov98 (1998)) and Dirsch et al. (2003a ), the specific frequency can easily be overestimated due to an underestimation of the galaxy luminosity. Additionally, the specific frequency is known to to vary radially (e.g. Ashman & Zepf ashman98 (1998), Larsen et al. larsen01 (2001), Rhode & Zepf rhode01 (2001))). Hence it is necessary to observe the whole radial extent of a galaxy to derive this quantity. To reliably assess the specific frequency, it is thus crucial to obtain accurate measurements to large radii for both, the number of GCs and the light profile.
Wide-field CCD studies exist only for five elliptical galaxies: for two GC-rich central ellipticals: NGC 4472 (Rhode & Zepf rhode01 (2001)) and NGC 1399 (Dirsch et al. 2003a ) and for three more “typical” ellipticals: NGC 3379, NGC 4406 and NGC 4594 (Rhode & Zepf rhode03 (2003)). The studies of the central cluster galaxies revealed extended cluster systems that reach out to approximately 100 kpc. While the clusters in the inner part (less than roughly 50 kpc) have a distinctly shallower distribution than the field population, there are indications in both cases that field stars and clusters are similarly distributed at larger radii.
In this work we investigate the GCS of NGC 4636 for the first time with wide-field CCD images that cover roughly using the metallicity-sensitive Washington filter system. This investigation aims to improve the understanding of the structural parameters of the GCS and its population structure.
2 The data
2.1 Observations & reduction
The data set consists of Washington wide-field images obtained with the MOSAIC camera mounted at the prime focus of the CTIO 4-m Blanco telescope during 4 and 5 April 2002. We obtained four 600 sec images in R and seven 900 sec images in C.
We used the Kron-Cousins R and Washington C filters, although the genuine Washington system uses T1 instead of R. However, Geisler (1996) has shown that the Kron-Cousins R filter is much more efficient than T1 and that R and T1 magnitudes are closely related, with only a very small color term and zero-point difference. The MOSAIC wide-field camera images a field of . The eight SITe CCDs have a pixel scale of 0.27″/pixel. Further information on the MOSAIC camera can be found on the MOSAIC homepage (http://www.noao.edu/kpno/mosaic/mosaic.html).
We dithered the images to fill the gaps between the (eight) individual CCD chips. Due to the dithering not all of the area is covered by the same number of exposures, which restricts the usable field to . The seeing on the final images is 1″.
The MOSAIC data has been handled using the mscred package within IRAF. In particular this software corrects for the variable pixel scale across the CCD which would otherwise cause a 4% variability of the brightness of star-like objects from the center to the corners. The flatfielding resulted in images that had remaining sensitivity variations (peak-to-peak).
To facilitate the search for point sources the extended galaxy light was subtracted. This was done using a median filter with an inner radius of and an outer radius of . This size is large enough to not alter the point source photometry which has been verified with artificial star tests described later on.
2.2 Photometry
The photometry has been done using the PSF fitting routine allstar within DAOPhot II.
For the point source selection we used the and sharpness values from the PSF fit and found approximately 10000 point sources. The brightest non-saturated objects have (depending slightly on the individual MOSAIC chip).
In each night 4 to 5 fields, each containing about 10 standard stars from the list of Geisler (geisler96a (1996)), were observed with a large coverage of airmasses (typically from 1.0 to 1.9). It was possible to use a single transformation for both nights, since the coefficients were indistinguishable within the uncertainties.
We derived the following relations between instrumental and standard magnitudes:
The standard deviation of the difference between instrumental and calibrated magnitudes is 0.021 in T1 and 0.023 in C-T1.
A table containing the cluster candidates with coordinates and photometric data is available in electronic form.
2.3 Photometric completeness
The completeness of the data has been studied with the aid of the task addstar within DAOPhot II, which was used to add 6666 stars to the science image. This number was found not to increase the crowding in the field. This was done ten times to produce ten different images. These modified images were reduced in the same way as the original data. The final, spatially averaged completeness function for the entire MOSAIC field in the color range is plotted in Fig. 1 for the entire MOSAIC field. The difference between the completeness function for red and blue clusters is marginal and does not need to be considered. However, there are strong spatial variations: close to the center of the elliptical galaxy and in the vicinity of bright foreground stars the completeness is lower. Throughout our study we applied completeness corrections as a function of spatial range.

2.4 The color-magnitude diagram
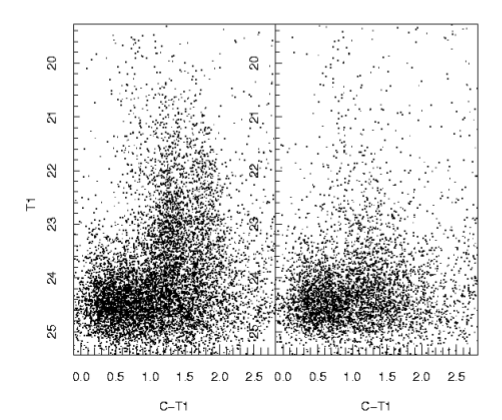
The color magnitude diagrams for all point sources in the MOSAIC images are plotted in Fig. 2. The left panel shows all objects within a galactocentric distance of which we consider to be the appropriate distance to separate clusters from background objects (see Sect. 5.1). The so defined background objects are plotted in the right panel. The globular cluster population is discernible within . The bimodal nature of the color distribution (see Sect.3) is already visible. Background galaxies become significant at R and begin to dominate the CMD at R. Most foreground stars are redder than the color range used for these CMDs.
For the foreground absorption Schlegel et al. (schlegel98 (1998)) give and Burstein & Heiles (burstein82 (1982)) . Using the reddening law of Rieke & Lebofsky (rieke85 (1985)) and E EB-V (Harris & Canterna harris77 (1977)), we find for the extinction and absorption , (Schlegel et al./Burstein & Heiles values), respectively. In the following we adopt the mean values, and .
3 Cluster color distribution
The color distribution of the cluster candidates is clearly bimodal as shown in Fig. 3. In this figure, as in the whole paper, the data is shown as histograms and as an adaptive kernel filtered distribution (using an Epanechikov kernel, Merritt & Tremblay merritt94 (1994)). Whenever a fit is performed, the histogram data is used. This figure also shows how the distribution varies with radius: the fraction of red clusters (those with ) is higher at smaller radii () than at larger (). A sum of two Gaussians is fitted to the color histograms:
The fit results are tabulated in Table 1.
| radial range | blue peak | red peak | ||||
|---|---|---|---|---|---|---|
This fit shows that the peak position and the width of the Gaussians for the two populations remain constant with radius, despite the change of the relative heights. The radial constancy of the peak position has also been observed in the V-I color for a sample of elliptical galaxies by Larsen et al. (larsen01 (2001)).
In the subsequent analysis we separate the clusters into two sub-samples, a red one () and a blue one () divided at the minimum of the inner sample plotted in Fig. 3.

The color distribution depends on the luminosity: the fraction of bright red clusters compared to blue ones is larger than the corresponding fraction for faint clusters, indicating that the luminosity functions are different. This is shown in Fig.4. The fitted peak positions are for the faint sample and for the bright sample. The color peak of the bright red clusters is approximately 0.1 mag bluer than that of the fainter cluster sample. We regard this as an indication that the concept of only two populations might not be sufficient.

4 The luminosity function of the cluster population
The LF of the cluster candidates is shown in Fig. 5 for two radial intervals ( and ) and for the red () and the blue () cluster samples. The GCLF can be described by a Gaussian or a t5 function which has more extended wings (Secker & Harris secker93 (1993)). However, no systematic differences in the turn over magnitudes (TOMs) have been reported when using these functions (Larsen et al. larsen01 (2001)). We adopt the Gaussian model. The results of fitting the blue, the red and the entire cluster sample are shown in the first three columns of Table 2. Since the position of the starting bin is arbitrary, we fitted two histograms with starting bins that are half the bin size apart and averaged the results which always deviated by less than 0.2 mag.

We have shown in Section 3 that the brighter clusters have a bluer red peak than the fainter ones. This indicates that two populations are not sufficient to describe the cluster system. We therefore divide the red cluster sample further, into an ”intermediate” color sample () and a “very red” sample (). The ”intermediate” color sample selects the red peak of the bright cluster population. The results of a Gaussian fit to the data are found in Table 2.
While most sub-samples are found to have similar TOMs and widths (which will be detailed shortly) the fit parameters for the intermediate color sample deviate significantly: the TOM is about one magnitude fainter and the width a factor of two broader. Moreover, the uncertainties are much larger. Despite the faint TOM we do not claim that there are relatively more faint clusters. We rather consider the faint TOMs with the enormous errors (at least a factor of 3 larger than in the other cases) as an indication that the fit of a Gaussian is not adequate. This interpretation is illustrated with Fig. 6 that compares the LF of the intermediate and the very red sub-samples. This figure shows that the fraction of bright GCs is larger for the intermediate color sample, consistent with the results using the color distributions.
It is interesting to see this behavior in the context of the luminosity dependent color distribution of the GCS in NGC 1399: in this galaxy the bimodality disappears for the brightest GCs, which means a larger fraction of “intermediate” colored GC candidates. The color peak of the brightest clusters in NGC 1399 is at while the “intermediate” colored sample of NGC 4636 is in the range , hence the majority is redder than in NGC 1399. A further discussion of the potential nature of these sources is given in Sect. 7.2.

Apart from the intermediate color sample no systematic differences in the TOM values can be seen within the uncertainties. This is in contrast to the expected dependence of the TOM on the metallicity of the cluster sample predicted by Ashman et al. (ashman95 (1995)). This discrepancy is discussed in more detail in Sect. 7.2. The TOM that will be used from now on is the mean value of the blue () and the very red () samples in the entire field: and the width .
The TOM and the width of the fitted Gaussian are strongly correlated and we find that is a good fit where is the difference from the adopted width of 1.03. For example, for a width of which is frequently kept constant when fitting the TOM of an elliptical galaxy in R which is comparable to T1, the TOM would be .
| radial | |||||
|---|---|---|---|---|---|
| interval | [0.9-2.1] | [0.9-1.55] | [1.55-2.1] | [1.55-1.8] | [1.8-2.15] |
4.1 The distance to NGC 4636
The absolute value of the TOM is best established in the V system (e.g. Richtler richtler03 (2003), Harris harris01 (2001), Ashman & Zepf ashman98 (1998)). However, the V-R color of our clusters is unknown and the only possibility is to shift their R-TOM by a constant value. We assume a mean for our clusters (which has been derived from Galactic clusters of similar color from the lists in Harris & Canterna (harris77 (1977)) and Harris harris96 (1996)). Thus we find for the reddening corrected TOM
Theoretically the TOM should depend on the metallicity (Ashman et al. ashman92 (1992)). However, in our sample no such effect is visible. For this reason we do not attempt to correct for any metallicity dependence. According to Richtler (richtler03 (2003)) the TOM of the Milky Way, M31 and the mean of a (selected) sample of elliptical galaxies with SBF measurements is the same within the uncertainties (of the order 0.2 mag for each method), despite the possible metallicity differences between the GCS of these galaxies. He gives an averaged absolute TOM of in V. We hence find a distance modulus of .
Alternatively, we determined the R-TOM for the Milky Way using the GC compilation of Harris (harris96 (1996)) and find . With this value we determine a distance modulus of , which is compatible with the above quoted value.
The obtained distance modulus agrees with that of Kissler et al. (kissler94 (1994)), which is also based on the GCLF. However, the comparison with the distance modulus based on the SBF method is less favorable (, Tonry et al. tonry01 (2001)). The latter would correspond to a . We comment on this difference in the discussion.
5 Spatial distribution
5.1 Radial cluster distribution

To determine the radial density distribution we accounted for the radially variable completeness by constructing the LF of all point sources brighter than T1=24 and correcting the LF for completeness. The LF is then summed, normalized to the area and background corrected. Beyond the number density of the point sources in the whole/blue/red color interval remains constant and hence it has been chosen as background. The used background densities are for the entire/blue/red sample. The resulting radial profiles are shown in Fig. 7 and are tabulated in Table 8. In addition, the values uncorrected for background and the background values are plotted in Fig. 7 which illustrates the uncertainties of the employed backgrounds.
In all radial distributions shown in Fig. 7 a change in slope at a radial distance between 7′ and 9′ is apparent. This steepening occurs approximately two arc-minutes closer in for the red than for the blue sub-population. It is already visible for the blue population in the uncorrected sample, however not as clearly. As it is customary we fit power-laws to the data which are shown in Fig. 7 as dashed lines. To account for the variable exponents that manifest themselves in the different slopes in the double logarithmic presentation we split the radial range in smaller parts. The resulting exponents () are tabulated in Table 3. While the blue clusters can be described with one exponent within the density distribution of the red ones changes the exponent within this radial interval. The uncertainties of the power-law indices are given for the background used (including the statistical error). However, a systematic under- or overestimation of the background density might significantly change the slopes for the larger radius interval. Since an underestimation is not very probable considering Fig. 6, the main uncertainty is an overestimation, i.e. the cluster system is more extended. However, beyond 13′ a radial dependence is not visible in any of the sub-samples nor does the color distribution of the point sources show the characteristic peaks of the GCS.
| r[arcmin] | all clusters | blue clusters | red clusters |
|---|---|---|---|
In the uppermost panel of Fig. 7 we also included the density profile by Kissler et al. (kissler94 (1994)). They used V measurements with a limiting magnitude of 24. Since (Galactic globular clusters with C-T1=1.5) this corresponds roughly to our brightness limit. Except for the last point the agreement is excellent. The last point deviates since they apparently overestimated their background because they used a too small CCD field for a reliable background determination. We also included in Fig. 7 the galaxy light profile measured in the T1 filter (see the next section).
The observed density profile can be described with the projection of a truncated power-law model with a core and a uniform exponent (truncation radius , core radius ). Within the core a constant number density is assumed. The resulting distributions are shown in Fig. 7 for the red and the blue populations. In particular for the blue population such a simple model provides an excellent fit to the observations. The (used) parameters for the blue/red populations are: , and .
Finally, one might ask whether the ”intermediate” red sample () has the same distribution as the red and blue sample. Its radial distribution (, ) is indistinguishable within the uncertainties from these other distributions.
5.2 Galaxy profile
The surroundings of NGC 4636 are devoid of any large galaxy or bright foreground stars and it is straightforward to use the ellipse task in IRAF/STSDAS to model the galaxy. In Fig. 8 the luminosity and color profiles are shown and tabulated in Table 9. Caon et al. (caon94 (1994)) presented a B luminosity profile for this galaxy which we include in our figure. The V-T1 color resulting from the surface profile of Lauer et al. (lauer95 (1995)) is V-T1, which is in excellent agreement with the color given in Prugniel et al.’s (prugniel98 (1998)) compilation (). This agreement supports the photometric calibration of T1. The same holds within for the B-T1 color that results from Caon et al.’s profile. However, for larger radii Caon et al.’s profile is slightly shallower and the B-T1 color becomes bluer than C-T1. However, this behavior is not supported by the color profile of Idiart et al. (idiart02 (2002)).
A good empirical fit to the T1 profile is
with , , , , , . The standard deviation between the fit and the T1 profile is 0.037 and the maximal deviations less than 0.09 mag ().


To further check our photometric calibration we compare the integrated galaxy light with aperture measurements compiled by Prugniel et al. (prugniel98 (1998)), shown in Fig. 9. For this comparison we transformed our T1 measurements into R. The overall agreement is very good. However, for radii larger than , the measurements from the literature seem to be 0.03 magnitudes fainter than ours. Since this shift is within our calibration uncertainty we make no attempt to correct for it.
In Fig. 7 it is obvious that for radii smaller than 7′ the cluster population has a distinctly shallower distribution than the diffuse light, a fact that has already been noted for the inner 4′ by Kissler et al. (kissler94 (1994)). At larger radii, the slope of the galaxy light and cluster density profile appear very similar; however, the uncertainties in the background determination make a firm statement difficult. Beyond 11′ (which corresponds to kpc) the stellar population of NGC 4636 is negligible especially compared to the X-ray halo which reaches 300 kpc (Matsushita et al. matsushita98 (1998)).
The color gradient of NGC 4636 is relatively shallow (for a comparison with a galaxy that has a strong radial color gradient see for example NGC 1399, Dirsch et al. 2003a ). Such a gradient can be caused by differences in the distribution of distinct stellar populations, however, in NGC 4636 high resolution archival WFPC2 HST images reveal an abundance of patchy dust structures in the inner region. Therefore, reddening can play a major role in producing the color gradient. Hence, the stellar populations seem to be well mixed.
5.3 Azimuthal distribution
To determine the ellipticity of the cluster system we study the azimuthal density distribution of GC candidates in circular annuli. The ellipticity and the number density along the major and the minor axis () are related via , where is the exponent of the radial density distribution ().
In Fig. 10 the azimuthal cluster density is shown for four different radial bins. In such a graph an elliptical cluster distribution manifests itself as a distribution. We fit this function to the data which is shown in Fig. 10 as the dotted line. Within and the distribution is clearly elliptical. Within a radial range of and a fit also results in an elliptical distribution, however, the distribution is considerably asymmetric and the fit is relatively poor. At even larger radii the distribution appears rather asymmetric with an enhancement of clusters towards the North-West (around ). This excess can be interpreted as a slightly more extended cluster distribution towards this direction. Interestingly, the galaxy light also shows an indication for such an asymmetric elongation, however, flatfield uncertainties prohibit a definite answer, see Fig. 12.
The radial dependence of the ellipticity and the position angle is shown with filled circles in Fig.11. Within 8′ the cluster system has an ellipticity comparable to that of the galaxy light (). At larger radii no information for the galaxy light is available and the cluster ellipticity drops to , only a deviation from the ellipticity found at for the smaller radii.


It is also of interest to study whether a difference in the azimuthal distribution of red and blue clusters can be found. For this task we used all blue/red clusters within and , the radial range where the two samples are indistinguishable. We found that the values for ellipticity and position angle agree with the values obtained for the total sample. Also the ”intermediate” color sample defined above has the same azimuthal distribution within the uncertainties.
6 The total number of clusters and the specific frequency
To determine the total number of clusters we used the TOM and the width of the Gaussian that had been fit to the GC luminosity function in Sect. 4 (). With this model we extrapolate from the number of observed GCs to all clusters. We proceeded as follows: we summed all clusters that are brighter than T1=24 in radial bins. These cluster counts were completeness corrected to account for the radially changing completeness. In this way we observed 66% of the total number of clusters. The final number of all clusters within a radial distance of 14′ is .
Kissler et al. (kissler94 (1994)) found within , where we find , which is in excellent agreement.
The specific frequency is the number of globular clusters per unit luminosity scaled to a galaxy with an absolute luminosity of mag (). In Sect. 5.2 we have shown that . The light profile can be observed to a semi-major axis distance of . The GCs are counted in circular rings and for the comparison we need the galaxy light in circular rings as well. The largest aperture for which we can determine a reliable luminosity is . At this radius the total T1 luminosity of NGC 4636 is . This is the maximum radius for which a specific frequency can be obtained. The total number of cluster candidates within this radius is . Hence we find and for the GCS and the SBF distance, respectively. A slight inconsistency in these values is that we used the same number of clusters and varied only the galaxy’s luminosity. However, since the TOM is visible the number of clusters does not change for the shorter distance.
Since the clusters have a shallower distribution than the diffuse galaxy light the specific frequency varies radially and it is not sufficient to give only one number for the specific frequency. Therefore we calculated the specific frequency for different limiting radii for the distance of Tonry et al. (tonry01 (2001)) and ours. The result is shown in Fig. 13 and tabulated in Table 4.

| r[arcmin] | ||
|---|---|---|
| 0.5 | ||
| 1.4 | ||
| 2.3 | ||
| 3.2 | ||
| 4.1 | ||
| 5.0 | ||
| 5.9 | ||
| 6.8 | ||
| 7.7 |
The specific frequency is rather large, in particular if one uses the smaller distance of Tonry et al. (tonry01 (2001)). In this case NGC 4636 would have one of the largest specific frequencies ever observed. In our opinion this is a further argument against this shorter distance.
7 Discussion
The properties of the GCS of NGC 4636 present several puzzles. In the following discussion we put them into a broader context. While definitive answers cannot be given, we attempt to work out the environment inside which possible solutions can be searched for. We summarize our results in Table 5.
| Coordinates (J2000): | , |
|---|---|
| Assumed reddening: | |
| TOM distance modulus: | |
| SBF distance modulus: | |
| Total number of GCs: | |
| Total apparent magnitude: | |
| Average color: | |
| Global specific frequency: | |
| TOM distance: | |
| SBF distance: |
7.1 The specific frequency
One of these puzzles is the specific frequency, which is surprisingly high for a relatively isolated galaxy, even if our large distance modulus of 31.25 is correct. A distance modulus of 30.8, as suggested by the SBF method, shifts to unrivaled values. Richtler (richtler03 (2003)) compared SBF distances and GCLF distances for a large sample of early-type galaxies. Apart from an overall good agreement, deviations are almost exclusively found in the sense of smaller SBF distances. These galaxies frequently exhibit other indicators pointing to the existence of intermediate-age or even young stellar populations. The difference of 0.4 mag between SBF and GCLF moduli, as found for NGC 4636, is only marginally explainable by the quoted measurement uncertainties. Moreover, the appearance of a supernova (Giclas giclas39 (1939)) is another indication for an intermediate-age population. On the other hand, in those galaxies where younger populations have unambiguously been identified, for instance in NGC 1316 (Goudfrooij et al. goudfrooij01 (2001)) or NGC 5018 (Hilker & Kissler-Patig hilker96 (1996), Leonardi & Worthey leonardi00 (2000)), the specific frequency is distinctly lower due to the higher luminosity of younger populations (Gomez & Richtler gomez01 (2001)). It is therefore difficult to explain the difference between SBF and GCLF moduli by a contribution of an intermediate-age population to the SBF magnitude. A small contribution would not be sufficient given the insensitivity of the I-band fluctuation magnitude to population differences (e.g Cantiello et al. cantiello03 (2003)), while a large one is improbable because of the high specific frequency. The specific frequency of NGC 4636 is comparable to that of NGC 1399, the central galaxy in the Fornax cluster (Dirsch et al. 2003a ). This demonstrates that a central position in a high density environment is not a necessary condition for developing a high -value. Scenarios like stripping globular clusters from neighboring galaxies, which have been constructed to explain the wealth of clusters for example in NGC 1399, are not applicable in the case of NGC 4636.
The extent and brightness of the X-ray halo as well as the total mass indicated by the X-ray analysis could also be characteristic of a small group of galaxies. Together with the high specific frequency, one may ask whether NGC 4636 is the remnant of a galaxy group. Isolated elliptical galaxies have several times been suspected to result from multiple merging of small groups (e.g. Stocke et al. stocke04 (2004), Mulchaey & Zabludoff mulchaey99 (1999), Vikhlinin et al. vikh99 (1999)). Numerical simulations of these merger processes show a strong dependence on the initial conditions (Athanassoula et al. athana97 (1997)), suggesting that the merger rate for group galaxies encompassed by a common dark matter halo is low, the corresponding timescales possibly exceeding a Hubble time. Thus NGC 4636 might be the merger outcome of a close group of galaxies with individual dark halos and the present halo the dispersed debris of the merger components. More properties, which support such a scenario, are the unusually high dust content (Temi et al. temi03 (2003)) and the absence of a color gradient which suggests that chemical evolution was largely terminated at the formation time of NGC 4636.
The high, perhaps extremely high, star formation rate that accompanied the merger is favorable for a high efficiency of cluster formation (Larsen & Richtler larsen00 (2000)), giving a qualitative explanation for the high specific frequency of NGC 4636. Searching for possible counterparts, one comes across NGC 1132, which has been suspected of being the merger remnant of a small galaxy group (Mulchaey & Zabludoff mulchaey99 (1999)). However, nothing is known about its cluster system due to its large distance of about 100 Mpc.
McLaughlin (mclaughlin99 (1999)) argued that the efficiency of GC formation is constant if one normalizes the total cluster mass to the sum of stellar mass and X-ray gas mass. Does the high specific frequency come back to ”normal” when the gas mass contained in the X-ray halo of NGC 4636 is included? For this, one needs factors of the order 1.5-2. One problem is the uncertain volume, inside which this normalization has to take place. The GCS terminates at a radius of roughly 40 kpc. According to Matsushita et al. (matsushita98 (1998)), the stellar mass inside this radius still is a factor of 10 larger than the X-ray gas mass, rendering the inclusion of the gas mass insignificant. Beyond this radius, the galaxy’s light cannot be traced any more. Only at a radius of 200 kpc, apparently much larger than the extension of the GCS and the galaxy, the X-ray gas mass becomes comparable to the total stellar mass. The question remains how the history of GC formation and the X-ray gas are related. A more or less constant ratio of GC mass and total mass does not contradict a local high efficiency of GC formation in a merger event.
7.2 The luminosity function
It has been theoretically predicted by Ashman et al. (ashman95 (1995)) that, for a given break in the mass function, metal-poor clusters have a brighter TOM than more metal-rich clusters. Such differences have also been observed in the V luminosity function of several GCS by Larsen et al. (larsen01 (2001)). Despite those expectations we do not see convincing evidence for this effect in NGC 4636. For example, considering the blue and the very red population (see Table 2) and using the Washington color-metallicity relation of Harris & Harris (harris02 (2002)), we find a mean metallicity of -1.44 dex and -0.08 dex for these populations. Such a metallicity difference should manifest itself in a TOM difference of (we used the fact that T1 is basically R and Table 3 of Ashman et al. ashman95 (1995)). Such a difference cannot be seen in Table 2. However, the fitted width of the Gaussian is much smaller for the very red than for the blue sample. If we had used the same width we would have found a TOM for the whole radial range of which is also within the uncertainties equal to that of the blue sample. We have no good explanation for the absence of the predicted TOM dependence on metallicity.
We have shown that the intermediate color cluster sample has a LF that differs from that of the other sub-populations in the sense that it has brighter GCs (Fig. 5). This behavior can also be seen in the brightness selected color distributions (Fig. 3). It is interesting to note that this is similar to the GCS around NGC 1399, where the brighter GCs have a different color distribution (Dirsch et al. 2003a , Ostrov et al. ostrov98 (1998)). In particular the bright GCs have no bimodal color distribution any longer but peak at an intermediate color. We tentatively interpret both observations with a picture in which the “normal” GCs are mixed with a population of objects that are brighter and of intermediate color. These may be former nuclei of stripped nucleated dwarf galaxies.
7.3 The ”edge” of NGC 4636
The GC density profile becomes very steep beyond (see Fig. 7). Since the GCS traces the galaxy light (see also the Section 7.4), it is reasonable to assume that the whole stellar body of NGC 4636 shows this behavior, which is supported by a relatively sharp border of the galaxy light. Such steepening in the very outer regions of elliptical galaxies has been explained by Jaffe (jaffe87 (1987)) and White (white87 (1987)) on the basis of energy considerations. They argue that the transition from an to an spatial density profile occurs if there is a sharp cut in the energy distribution function near the escape energy in the case of an approximately Keplerian potential.
A different case is, for example, NGC 1399, which has also been studied with wide-field CCD photometry by Dirsch et al. (2003a ). They attributed its (spatially) uniform profile to its extended dark matter halo. The Keplerian regime (if it exists at all in the inner region of the Fornax cluster) would then be beyond the observable radial range. If this idea was applicable to NGC 4636 it would imply that we have already reached the regime of a declining potential.
However, this interpretation conflicts with the existence of a massive dark halo - as is claimed on the basis of X-ray observations (Loewenstein & Mushotzky loewenstein03 (2003), Matsushita et al. matsushita98 (1998), Mushotzky et al. mushotzky94 (1994)). Hence either our interpretation of the light profile and of the cluster distribution is incorrect or the X-ray mass profile is inaccurate. Problems concerning the interpretation of the X-ray gas arise from its turbulent nature (Otho et al. otho03 (2003), Jones et al. jones02 (2002)) and a possible interaction with the Virgo inter-cluster gas (Trinchieri et al. trinchieri94 (1994)). Therefore an independent measurement of the dark matter distribution is desirable.
7.4 Is the GC radial density distribution peculiar?
The radial distribution of the GCS in NGC 4636 is considerably shallower than the galaxy light over nearly the entire radial range. How can this be assessed in a quantitative manner? GCSs generally exhibit shallower surface density profiles than their host galaxies’ light (Harris harris01 (2001), Ashman & Zepf ashman98 (1998)). It is also known that larger galaxies tend to have GCSs with shallower radial distributions (Kissler-Patig kisslerpatig97 (1997), Ashman & Zepf ashman98 (1998)), which also holds for the galaxy profile (Kormendy & Djorgovski kormendy89 (1989)). However, we are not aware of any recent quantitative comparison examining these trends. In the following we collect power-law indices fitted to the radial distribution of GCSs from the literature and perform a similar, homogeneous fit to published galaxy light profiles within a comparable radial range. The correlation of these power-law indices with galaxy luminosity is determined and compared for GCSs and field stars.
We use the galaxy profile measurements of Virgo and Fornax ellipticals published by Caon et al. (caon94 (1994)) and fit power-laws to the data (we multiplied the luminosity profiles by -0.4 to ensure comparability with the cluster data). A power-law fit may not be the preferred fit to a galaxy light profile. It is chosen here to allow a comparison with the published cluster density profiles which are generally described by power-laws. In order to exclude galaxies for which a single power-law at radii larger than 20″ is not appropriate, we fitted two radial ranges and omitted those galaxies for which the power-law indices deviate by more than 0.15. The B luminosity profiles from Caon et al. (caon94 (1994)) were transformed to V magnitudes with B-V colors from Prugniel et al. (prugniel98 (1998)). We adopted the total apparent magnitudes given by Caon et al.. For the absolute magnitudes we used the distance moduli of Tonry et al. (tonry01 (2001)). For galaxies without a SBF distance we used a mean cluster distance modulus of 31.4 for Fornax and 31.1 for Virgo. To correct for absorption the mean of the Schlegel et al. (schlegel98 (1998)) and Burstein & Heiles (burstein82 (1982)) values was employed. The result is shown in the upper panel of Fig. 14, which illustrates the well-known fact that larger early-type galaxies are less concentrated (e.g. Kormendy & Djorgovski kormendy89 (1989)). In this plot we also included for a consistency check the same dependence published by Schombert et al. (schombert86 (1986)). This data, however, is much more heterogeneous and not reddening corrected. The distances are those provided by Schombert et al. (schombert86 (1986)) and are based on the recession velocities. Furthermore, the galaxy luminosities published by Schombert et al. are measured within a linear radius of 16 kpc. To transform these luminosities to the scale of Caon et al. we compared galaxies that are contained in both samples and obtained a mean shift of . One expects a systematic trend of this shift with magnitude, however, we were unable to detect it, presumably due to the small magnitude coverage of the galaxies in common (12 objects). We fit a linear function to the galaxies brighter than of the two samples and found a slope of , consistent with Schombert’s sample. Considering its luminosity (), NGC 4636 has a surprisingly shallow light distribution ().
To compare the dependence of the GCS radial distribution and the luminosity profile on the total galaxy luminosity we compiled data from the literature, the most important single source being Kissler-Patig (kisslerpatig97 (1997)) in conjunction with distance moduli from Tonry et al. (tonry01 (2001)). Furthermore, we excluded those cases in which the error of the power-law exponent is larger than 0.3 and cases in which the power-law fit is done on the basis of less than 4 points and included a few galaxies with recent measurements. For the galaxy luminosity we have chosen the value given by Caon et al. (caon94 (1994)) or, when not available, the total V magnitude from the RC3. The resulting dependence of the cluster radial distribution on the host galaxy’s luminosity is shown in the lower panel of Fig. 14.
The comparison of the radial cluster distribution with the galaxy light shows the well established fact that in general the cluster systems have shallower distributions. However, it also shows that the difference between the slopes of galaxy light and the GC radial profiles depends on luminosity: brighter galaxies exhibit a slightly larger difference on the average, which was not yet obvious in the sample discussed by Ashman & Zepf ashman98 (1998).
The radial distribution of the GCs of one elliptical is rather different: NGC 1316, the brightest galaxy in the sample, clearly stands out. However, it is not a typical elliptical galaxy, but a merger remnant with an age of 2-3 Gyr (Goudfrooij et al. goudfrooij01 (2001), Gomez & Richtler gomez01 (2001)).
The location of NGC 4636 in this diagram on the other hand is typical.
In Table 11 we also included the difference between the slope of the GC radial density profile and the galaxy light for several galaxies where both numbers are available. It shows that both slopes are closely related, irrespective of luminosity.

It is important to note that a shallower density profile of the GCS does not necessarily imply a GCS that is more extended than the galaxy light. Both in NGC 4636 and NGC 1399 the GCS has a clearly shallower profile than the galaxy light until a certain radius. At large radii, however, the distribution becomes steeper and is compatible with that of the galaxy light. The radius at which this happens is fairly large and hence the shallower inner decline does not correspond to a core.
7.5 The discrepancy between the distribution of clusters and field stars
Another fact worth pointing out is that the ellipticities of the GCS and the field population of NGC 4636 are the same (within the uncertainties) within 4′ and 9′ while the radial distributions are rather different in this range.
Also puzzling is the fact that no pronounced radial color gradient can be seen for the galaxy light. One might expect that any field component that is connected to the metal-poor, blue cluster population (and which should therefore follow the same density profile) would become radially more prominent and hence the galaxy light is expected to have a stronger color gradient than actually observed. The implication is that the population that has formed together with the clusters (in particular the metal-poor, blue ones) is negligible compared to the field population that formed with a very low cluster formation efficiency. This is in strong contrast to other galaxies where the clusters have a shallower distribution and in which strong color gradients in the light profile have been found: NGC 1427 (Forte et al. forte01 (2001)), NGC 4472 (Rhode & Zepf rhode01 (2001)), NGC 1399 (Dirsch et al. 2003a ).
In the following we perform a study similar to that presented in Dirsch et al. (2003a ): we aim at constraining the so-called intrinsic specific frequency (ISF) which measures the specific frequencies of the red clusters with respect to a red population of the same mean color and of the metal-poor clusters with respect to their underlying field population. Such an approach results in a unique solution only when the two populations are assumed and the two observables, light profile and color profile, are fitted by varying only the blue and red ISF. The result is shown in Fig. 15. For radii larger than 6′ a constant ISF for each population can be used, which corresponds to the fact that cluster and light distribution become similar at large radii. The ISF of the blue population is, as expected, at all radii larger than that of the red ones. Furthermore, at large radii the value of the blue population’s ISF is very similar to that derived for NGC 1399. However, while in the latter galaxy the blue ISF remains constant with radius, it declines in NGC 4636 inwards. This decline is accompanied by a decline in the red cluster density profile, otherwise a color gradient would arise. The value of the red ISF is considerably smaller in NGC 4636 than in NGC 1399.

Summarizing, we find that in particular the red clusters have formed with a lower efficiency in NGC 4636 compared to NGC 1399, while it is slightly higher for the blue clusters for radii greater than 6′. Within this radius also their formation efficiency was lower. Despite these differences the global specific frequencies are very similar and hence the overall cluster formation efficiencies have been comparable.
7.6 The globular cluster - X-ray gas connection
The GCS and the hot X-ray gas may have a common evolutionary history (via mass loss during star formation and SN explosions of the respective stellar population), however, there is no reason to expect a tight relationship in their distribution. It is therefore striking to find that similar radii appear to be characteristic of both. We have shown than the GC density distribution becomes steeper at (depending on the population) which is also where the X-ray gas changes its slope and becomes flatter (Trinchieri et al. trinchieri94 (1994)). At a radius of about the cluster system appears to have ended; this is the radius where the intensity profile of the X-ray gas changes again and becomes nearly flat (at kpc, Matsushita et al. matsushita98 (1998)). Is this merely a coincidence? A study of the dynamical properties of the GCS that can constrain the matter distribution is required to shed light on these findings.
Appendix A The data tables
The luminosity function of the GCs, their color and radial distribution and the galaxy profile including the ellipticity are published electronically. The galaxy sample used in Sec. 7.4 is also available electronically. The table captions are given in this appendix.
| C-T1 | N() | N() |
|---|---|---|
| 0.89 | ||
| 0.96 | ||
| 1.02 | ||
| 1.10 | ||
| 1.17 | ||
| 1.24 | ||
| 1.31 | ||
| 1.38 | ||
| 1.45 | ||
| 1.52 | ||
| 1.58 | ||
| 1.66 | ||
| 1.73 | ||
| 1.80 | ||
| 1.87 | ||
| 1.94 | ||
| 2.00 | ||
| 2.08 | ||
| 2.15 | ||
| 2.21 |
| r | n(all)[arcmin-2] | n(blue)[arcmin-2] | n(red)[arcmin-2] | |||
|---|---|---|---|---|---|---|
| with background | background subtracted | with background | background subtracted | with background | background subtracted | |
| r | T1 | C-T1 | PA | |
|---|---|---|---|---|
| galaxy | Lit | ||
|---|---|---|---|
| NGC 524 | KP97 | ||
| NGC 708 | OH02 | ||
| NGC 720 | KP96 | ||
| NGC 1052 | KP97 | ||
| NGC 1316 | Gea01 | ||
| NGC 1374 | KP97 | ||
| NGC 1380 | KP97b | ||
| NGC 1399 | Dea03a | ||
| NGC 1404 | KP97 | ||
| NGC 1427 | Fea01 | ||
| NGC 1700 | Bea00 | ||
| NGC 3115 | KP97 | ||
| NGC 3258 | Dea03b | ||
| NGC 3268 | Dea03b | ||
| NGC 3379 | RZ031 | ||
| NGC 4278 | KP97 | ||
| NGC 4365 | KP97 | ||
| NGC 4406 | RZ03 | ||
| NGC 4472 | RZ01 | ||
| NGC 4486 | KP97 | ||
| NGC 4594 | RZ03 | ||
| NGC 4636 | this paper | ||
| NGC 4697 | KP97 | ||
| NGC 7014 | OH02 | ||
| NGC 5193 | OH02 | ||
| IC 5193 | OH02 |
| galaxy | |||
|---|---|---|---|
| NGC 1336 | |||
| NGC 1351 | |||
| NGC 1373 | |||
| NGC 1375 | |||
| NGC 1379 | |||
| NGC 1380 | |||
| NGC 1380A | |||
| NGC 1381 | |||
| NGC 1399 | |||
| NGC 1404 | |||
| NGC 1419 | |||
| NGC 1427 | |||
| NGC 4261 | |||
| NGC 4339 | |||
| NGC 4472 | |||
| NGC 4600 | |||
| NGC 4636 |
Acknowledgments
TR and BD gratefully acknowledge support from the Chilean Center for Astrophysics FONDAP No. 15010003. YS gratefully acknowledges funding support from the DAAD (German Academic Exchange Service). We thank the anonymous referee for her/his careful reading and helpful comments.
References
(1) Ashman, K.M., Zepf, S.E., 1992, ApJ, 384, 50 (2) Ashman, K.M., Conti,A., Zepf, S.E., 1995, AJ, 110, 1164 (3) Ashman, K.M., Zepf, S.E., 1998, Globular cluster systems, Cambridge astrophysics series, Cambridge (4) Athanassoula, E., Makino, J., Bosma, A. 1997, MNRAS 286, 825 (5) Awaki H., Mushotzky R., Tsuru T., Fabian A.C., 1994, PASJ, 46, L65 (6) Beasley, M.A., Baugh, C.M., Ducan, A.F. et al., 2002, MNRAS 333, 383 (7) Bottinelli, L., Gouguenheim, L., 1978, A&A, 64, L3 (8) Brown, R.J.M., Forbes D.A., Kissler-Patig, M., Brodie, J.P., 2000, MNRAS, 317, 406 (9) Burstein, D., Heiles, C., 1982, AJ, 87, 1165 (10) Cantiello M., Raimondo G., Brocato E., Capaccioli M. 2003, AJ 125, 2783 (11) Caon, N., Capaccioli, M., D’Onofrio, M., 1994, A&AS, 106, 199 (12) Côté, P., West, M.J., Marzke, R.O., 2002, ApJ, 567, 853 (13) Dirsch, B., Richtler, T., Geisler, T., et al., 2003a, AJ, 125, 1908 (14) Dirsch, B., Richtler, T., Bassino, L.P., 2003b, A&A, 408, 929 (15) Elmegreen, B. G., 1999, Ap&SS, 269, 469 (16) Forbes, D.A., Brodie, J.P., Grillmair, C.J., 1997, AJ 113, 1652 (17) Forte, J.C., Geisler, D., Ostrov, P.G., 2001, AJ, 121, 1992 (18) Gallagher, J.S., 1978, IAUS, 77, 54 (19) Geisler, D., 1996, AJ, 111, 480 (20) Giclas, H.L., 1939, PASP, 51, 166 (21) Gómez, M., Richtler, T., Infante, L., Drenkhahn, G., 2001, A&A, 371, 875 (22) Goudfrooij, P., Mack, J., Kissler-Patig, M., et al., 2001, MNRAS, 322, 643 (23) Hanes, D.A., 1977, MNRAS, 180, 309 (24) Harris, H.C., Canterna, R., 1977, AJ, 82, 798 (25) Harris, W.E., van den Bergh, S., 1981, AJ, 86, 1627 (26) Harris, W.E., 1996, AJ, 112, 1487 (27) Harris, W.E., 2001, in ”Star Clusters“, Saas-Fee Advanced Course 28, Lecture Notes 1998, eds. L. Labhardt and B. Binggeli, Springer-Verlag, Berlin, p.223 (28) Harris, W.E., Harris, G.L.H., 2002, AJ, 123, 3108 (29) Hilker, M., Kissler-Patig, M., 1996, A&A, 314, 357 (30) Idiart, T.P., Michard, R., de Freitas Pacheco, J.A., 2002, A&A, 383, 30 (31) Jaffe, W., 1987, in ”Structure and Dynamics of Elliptical Galaxies”, IAU Symp. 127, ed. T. de Zeeuw, D. Reidel, Dordrecht, p.511 (32) Jones, C., Forman, W., Vikhlinin, A. et al. 2002, ApJ, 567, L115 (33) Kissler-Patig, M., 1997, A&A, 319, 83 (34) Kissler-Patig, M., Richtler, T., Storm, J, della Valle, M., 1997b, A&A, 327, 503 (35) Kissler-Patig, M., Richtler, T., Hilker, M., 1996, A&A, 308, 704 (36) Kissler, M., Richtler, T., Held, E.V. et al., 1994, A&A, 287, 463 (37) Knapp, G.R., Faber, S.M., Gallagher, J.S., 1978, AJ, 83, 11 (38) Kormendy, J., Djorgovski, S., 1989, ARA&A, 27, 235 (39) Krishna Kumar, C., Thonnard, N., 1983, AJ, 88, 260 (40) Kundu, A., Whitmore, B.C., Sparks, W.B. et al., 1999, ApJ, 513, 733 (41) Larsen, S.S., Brodie, J.P., Beasley M.A. et al., 2003, ApJ, 585, 767 (42) Larsen, S.S., Brodie, J.P., Huchra, J.P. et al., 2001, AJ, 121, 2974 (43) Larsen, S.S., Richtler T., 2000, A&A, 354, 836 (44) Leonardi, A. J., Worthey, G., 2000, ApJ, 534, 650 (45) Lauer, T.R., Ajhar, E.A., Byun, Y. et al., 1995, AJ 110, 2622 (46) Loewenstein, M., Mushotzky, F., 2003, Nuclear Physics B Proc. Suppl. 124, 91 (47) Matsushita, K., Makishima, K., Ikebe, Y. et al., 1998, ApJ, 499, L13 (48) McLaughlin, D., 1999, AJ, 117, 2398 (49) Mc Millan, R.J., Ciardullo, R., 1996, ApJ, 473, 707 (50) Merritt, D., Tremblay, B., 1994, AJ 111, 2243 (51) Minniti, D., Alsonso, M.V., Goudfrooij, P. et al., 1996, ApJ, 467, 221 (52) Mulchaey J.S., Zabludoff A.I., 1999, ApJ, 514, 133 (53) Mushotzky, R.F., Loewenstein, M., Awaki, H. et al., 1994, ApJ, 436, L79 (54) Okon, W.M.M., Harris, W.E., 2002, ApJ, 567, 294 (55) Ostriker, J. P., Binney, J., Saha, P., 1989, MNRAS, 241, 849 (56) Ostrov, P.G., Forte, J.C., Geisler, D., 1998, AJ, 116, 2854 (57) Otho, A., Kawano, N., Fukazawa, Y., 2003, PASJ, 55, 819 (58) Prugniel, P., Heraudeau, P., 1998, A&AS, 128, 299 (59) Puzia, T.H., Kissler-Patig, M., Brodie, J.P., Huchra, J.P., 1999, AJ, 118, 2734 (60) Rhode, K.L., Zepf, S.E., 2001, AJ, 121, 210 (61) Rhode, K.L., Zepf, S.E., 2003, astro-ph/0310277 (62) Richtler, T., 2003, astro-ph/0304318 (63) Rieke G.H., Lebovsky M.J., 1985, ApJ, 288, 618 (64) Schlegel, D., Finkbeiner, D., Davis, M., 1998, ApJ, 500, 525 (65) Schombert, J.M., 1986, ApJS, 60, 603 (66) Secker, J., 1992, AJ, 104, 1472 (67) Secker, J., Harris, W.E., 1993, AJ, 105, 1358 (68) Stocke J.T, Keeney B.A., Lewis A.D., Epps H.W., Schild R.E. 2004, AJ, 127, 1336 (69) Temi, P., Mathews, W.G., Brighenti, F., Bregman, J.D., 2003, ApJ, 585, L121 (70) Tonry, J.L., Dressler, A.D., Blakeslee, J.P., 2001, AJ, 546, 681 (71) Trinchieri, G., Kim, D.-W., Fabbiano, G., Canizares, C.R.C., 1994, ApJ, 428, 555 (72) Vikhlinin A., McNamara B.R., Hornstrup A. et al. 1999, ApJ 520, L1 (73) White, S.D.M. 1987, in ”Structure and Dynamics of Elliptical Galaxies”, IAU Symp. 127, ed. T. de Zeeuw, D. Reidel, Dordrecht, p.263 (74) Whitmore, B.C., Zhang, Q., Leitherer, C., at al., 1999, AJ 118, 1551 (75) Whitmore, B.C., Schweizer, F., Kundu, A., Miller, B.W., 2002, AJ, 124, 147 (76) Xu, H., Kahn, S.M., Peterson, J.R. et al., 2002, ApJ, 579, 600 (77) Yoshii, Y., Tsujimoto, T., Nomoto, K., 1996, ApJ, 462, 266 (78) Yungelson, L., Livio, M., Tutukov, A., Kenyon, S.J., 1995, ApJ, 447, 656