The Konus-Wind and Helicon-Coronas-F detection of the giant -ray flare from the soft -ray repeater SGR 1806-20
Abstract
The giant outburst from SGR 1806-20 was observed on 2004 December 27 by many spacecraft (ref. 1,2,3,4,5,6). This extremely rare event exhibits a striking similarity to the two giant outbursts thus far observed, on 1979 March 5 from SGR 0526-66 (ref. 7) and 1998 August 27 from SGR 1900+14 (ref. 8,9,10). All the three outbursts start with a short giant radiation pulse followed by a weaker tail. The tail pulsates with the period of neutron star rotation of 5–8 s, to decay finally in a few minutes. The enormous intensity of the initial pulse proved to be far above the saturation level of the gamma-ray detectors, with the result that the most valuable data on the time structure and energy spectrum of the pulse is lost. At the time of the December 27 outburst, a Russian spacecraft Coronas-F with a -ray spectrometer aboard was occulted by the Earth and could not see the outburst. It succeeded, however, in observing a weak reflected signal due to the -rays Compton scattered by the Moon (ref. 11). This has been the first observation of a cosmic gamma-ray flare reflected from a celestial body. Here we report, that the detection of a weakened back-scattered initial pulse combined with direct observations by the Konus -ray spectrometer on the Wind spacecraft permitted us to reliably reconstruct the intensity, time history, and energy spectra of the outburst.
During the period elapsed since its launch in 1994, Konus-Wind has detected three giant outbursts. The first of them came on 1998 June 18 from SGR 1627-41 (ref. 12). It was weaker than the others and did not have a pulsating tail. The second giant outburst, on 1998 August 27 (ref. 8,9,10), was associated with SGR 1900+14. It is to this event that the giant outburst on 2004 December 27 from SGR 1806-20 is very similar.
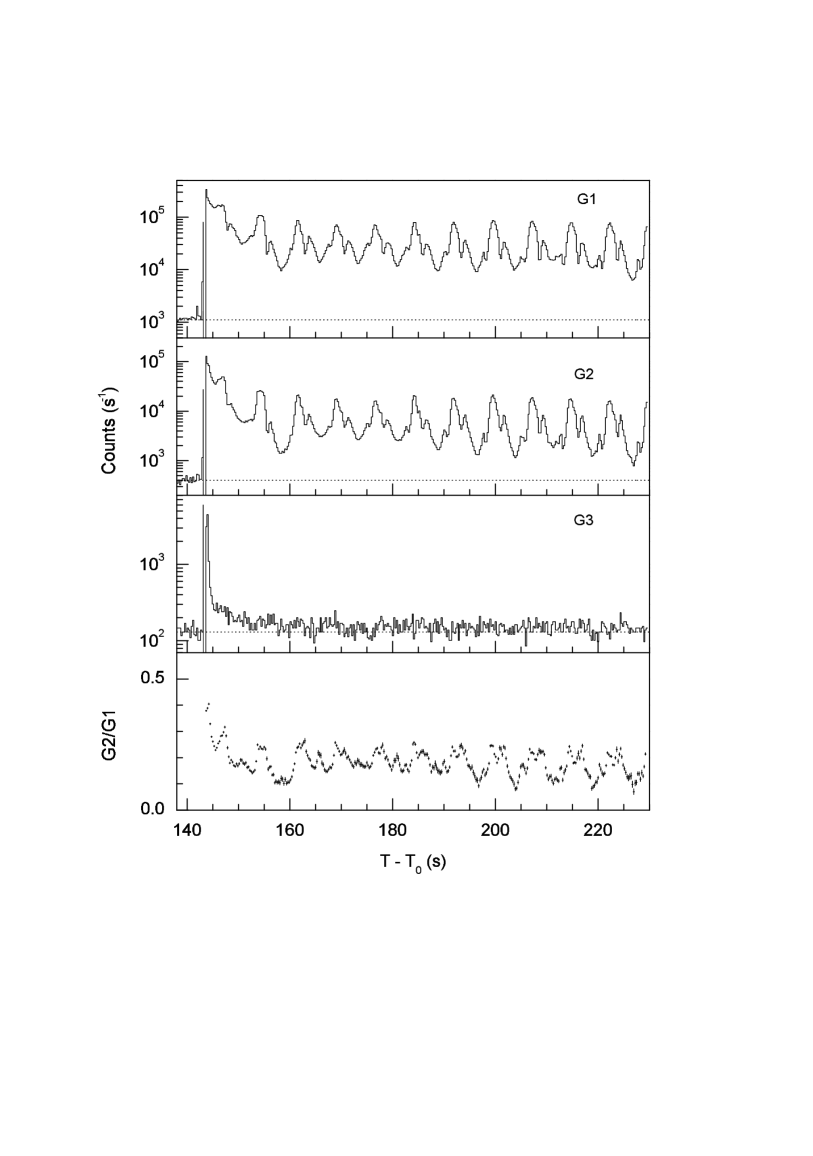
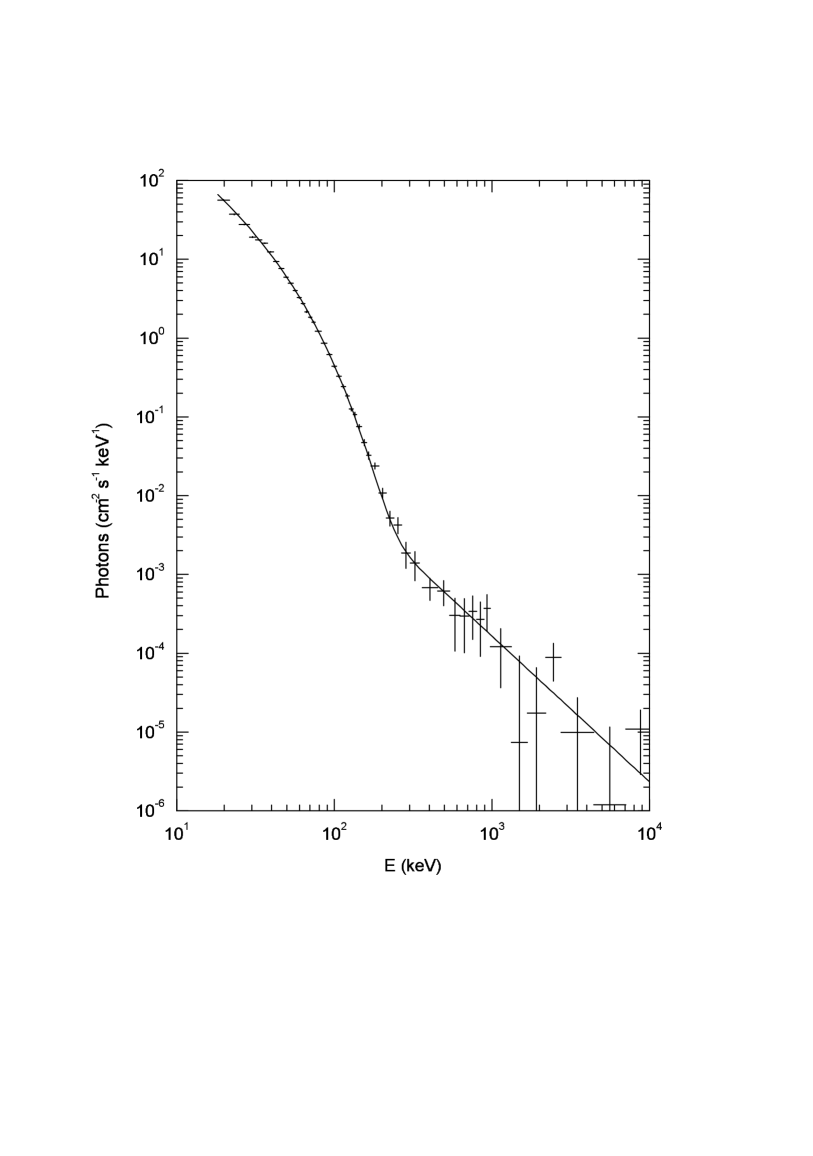
On Wind, the record of this outburst was triggered by a preceding recurrent soft burst at =21:27:58.447 s UT. This burst was the last but strongest of a series of 10 recurrent bursts which occurred on December 27 before the giant outburst. The strongly enhanced SGR recurrent activity at the end of 2004 could be an indication of an approaching giant outburst, as was the case with the 1998 August 27 event (ref. 13). Figure 1 presents a fragment of the time history of the giant outburst recorded with a 0.256-s resolution. The event started at =142.08 s with an extremely steep intensity rise to drive the gamma detector far above the saturation level for 0.5 s. On termination of the initial pulse and with the detector having resumed operation, the burst tail became visible until its decay after 380 s. The burst tail intensity pulsates with the period of neutron star rotation s. Each period exhibits a complex, three-peaked pulsation structure. The count rate ratio of the G2 (65–280 keV) to G1 (16.5–65 keV) energy windows is a measure of the spectral hardness of the radiation. Within each period, the spectral hardness correlates with the intensity structure. Most likely the variations in the intensity and spectral shape during a period are caused by changing of the viewing angle on a rotating anisotropic source. Figure 2 displays an energy spectrum of the tail averaged over the pulsation period. The spectrum consists of two components, with the energy region of up to 400 keV being dominated by a component falling off exponentially with energy, and at energies keV by a power law with a photon index of . Such spectra vary very little in shape as the burst decays. Each of them contains a weak hard power-law component extending to as far as 10 MeV. The total fluence in the outburst tail can be estimated as erg cm-2 in the 20 keV–10 MeV band. Estimation of the initial pulse fluence from complete detector saturation during 0.5 s can yield only its lower limit erg cm-2. Thus, direct observation of an outburst does not permit one to obtain data on the intensity, time history, and energy spectrum of the initial pulse.
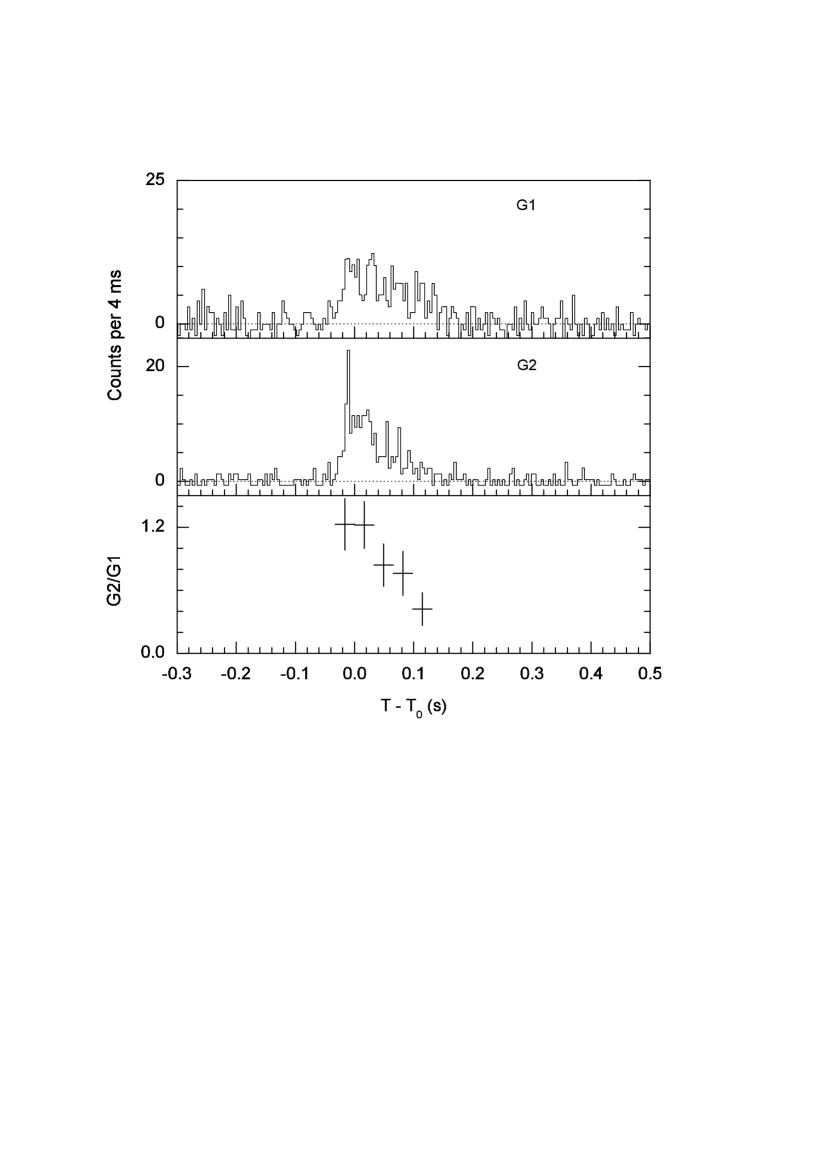
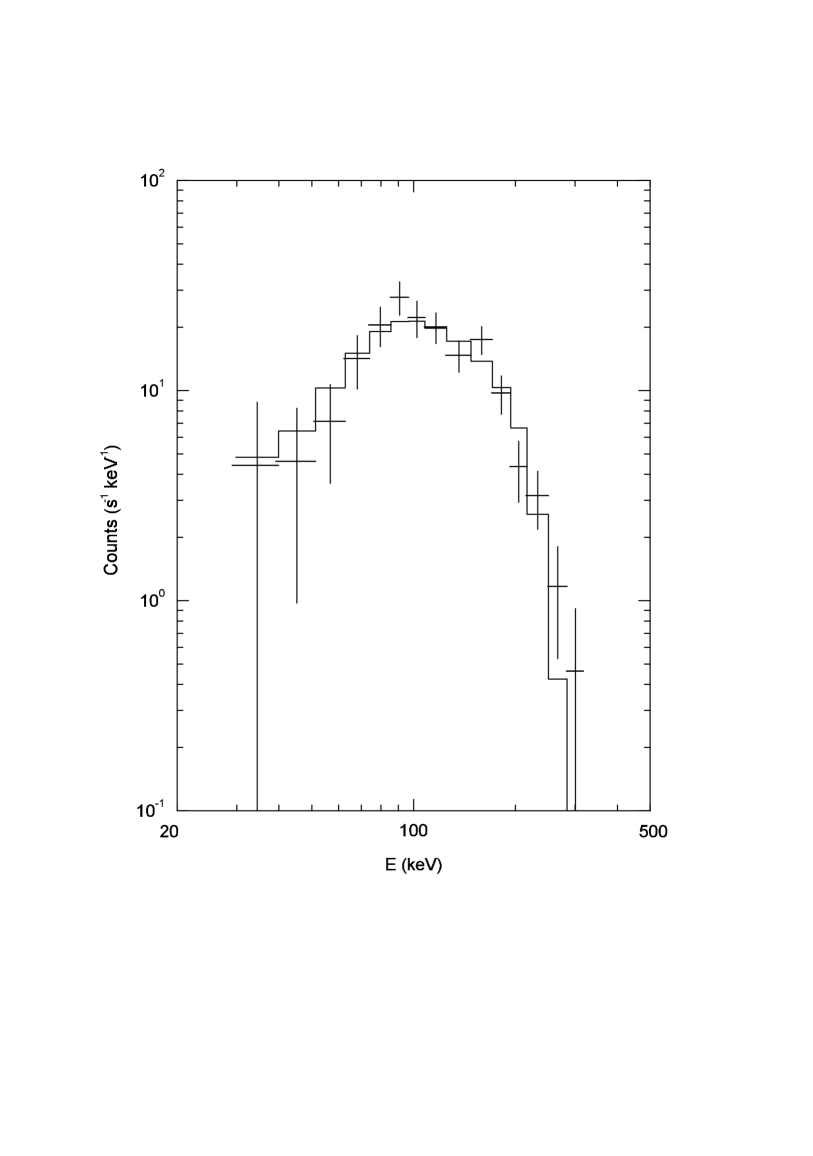
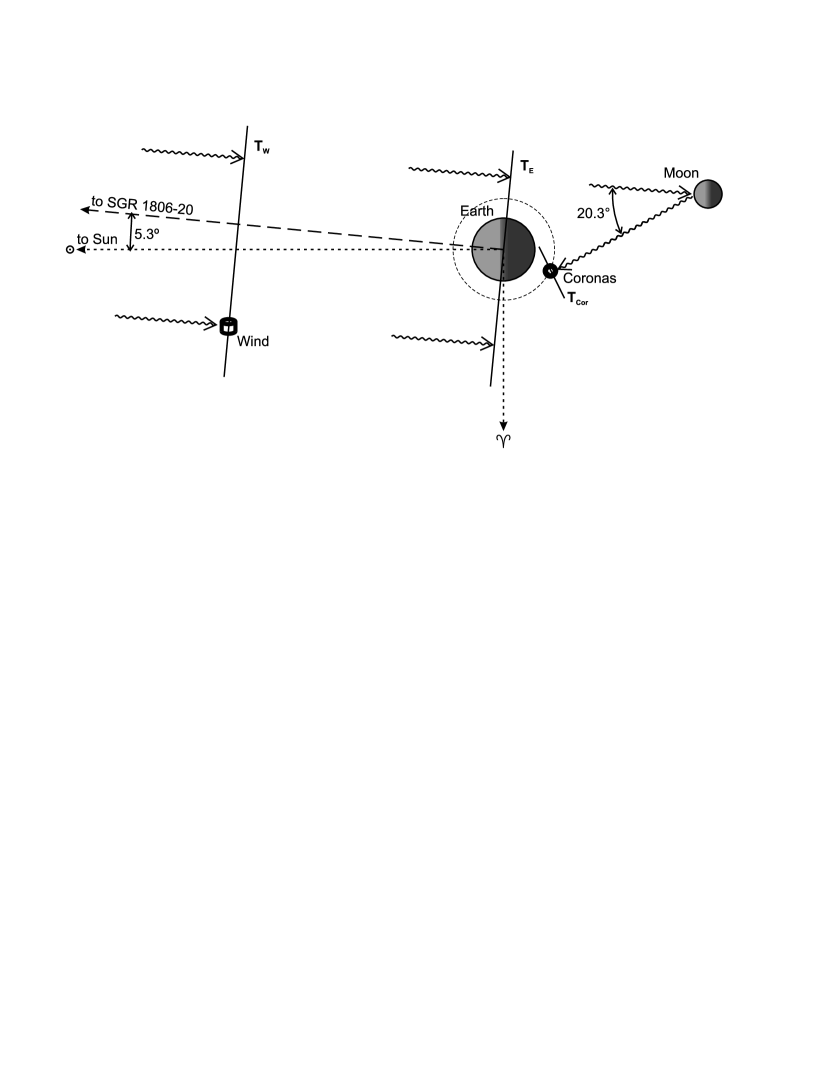
A fortunate chance to gain this information has been provided by observation by the Helicon instrument on Coronas-F of a short gamma-ray burst on 2004 December 27 at 21:30:29.303 s UT. Figure 3 presents a time history of this burst recorded in the energy windows G1 (25–100 keV) and G2 (100–450 keV), and the G2/G1 ratio which exhibits a strong hard-to-soft spectral evolution. Shown in Fig. 4 is an average energy spectrum accumulated over 128 ms after . There are two grounds arguing for this burst to result from Compton scattering of the giant pulse by the Moon. First, it is consistent with the delay of its arrival to Coronas-F and Wind to be expected in this case (a schematic diagram of the flare wavefront propagation is shown on Fig. 5). Second, while the shape of the measured energy spectrum is far from typical of gamma-ray bursts, it fits quite well the so-called Compton backscattering peak at scattering angles of about 180∘, where the energy of singly scattered photons cannot exceed . The real angle through which the radiation incident on the Coronas-F detector was scattered lies in the range 159.5–159.9∘. The right-hand wing of the observed spectrum derives primarily from scattering, multiple as well as single, of photons with energies in excess of 200 keV striking the Moon. In this energy region, the cross section of photoabsorption is substantially lower than that of Compton scattering. The left-hand wing covers a low energy region where photoabsorption becomes strongly dominating over scattering, so that an ever decreasing fraction of photons is capable of escaping out of the lunar soil.
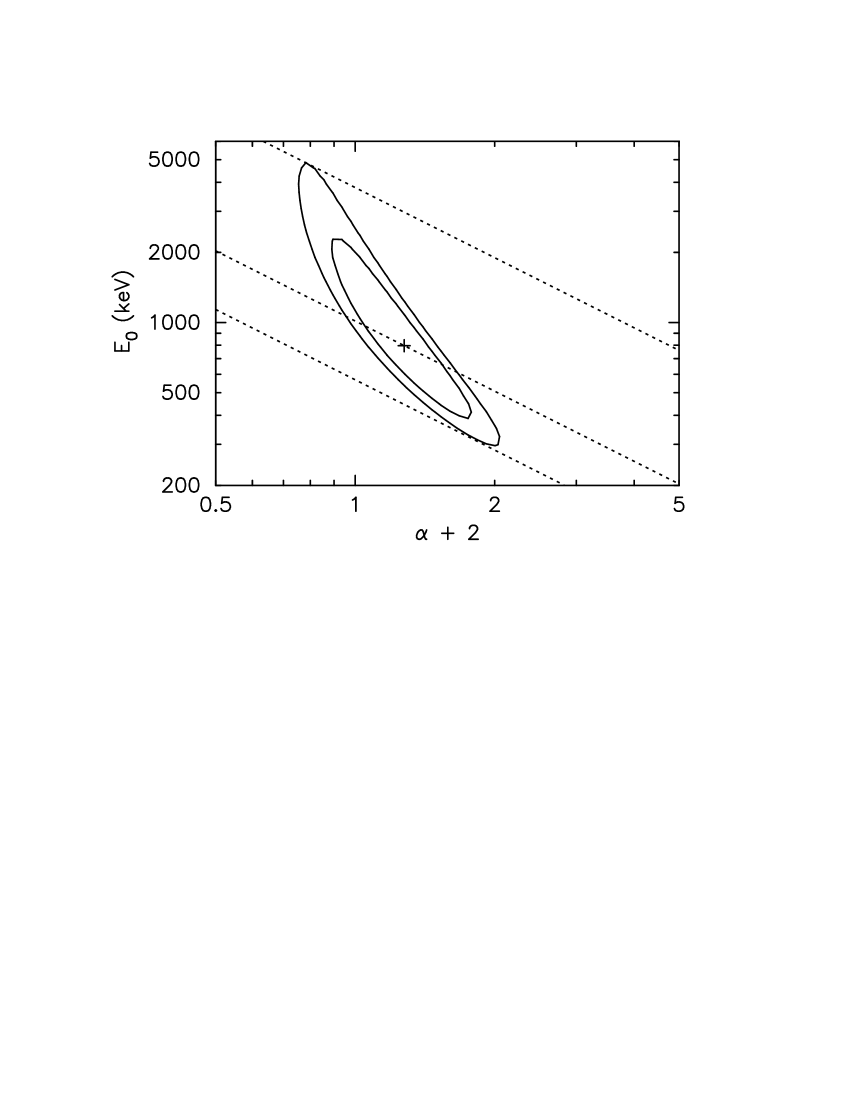
To determine the spectrum and intensity of the initial pulse, the burst radiation scattering from the Moon was numerically simulated by the Monte Carlo method using the well-known GEANT code developed in CERN (ref. 14). A response matrix of the Moon for the above-mentioned scattering angles was calculated for a broad photon energy range from 20 keV to 12 MeV and folded then with the detector response matrix. The result of the spectrum simulation is also shown in Fig. 4. The best-fit model was found to be a power law function with an exponential cutoff, with =-0.7 and =800 keV. The reflected energy flux seen by Coronas-F is weak being attenuated by a factor of . The energy spectrum statistics is poor, particularly in the wings. Therefore, the confidence regions of 68 and 90% for the and parameters shown in Fig. 6 are fairly large. One readily sees, however, that the fitting parameters and are in strong anticorrelation. As a result, the estimates of the total energy in the pulse vary rather weakly. At a confidence level of 90% the fluence and the peak flux of the initial pulse in the 20 keV–10 MeV energy band are erg cm-2 and erg cm-2 s-1.
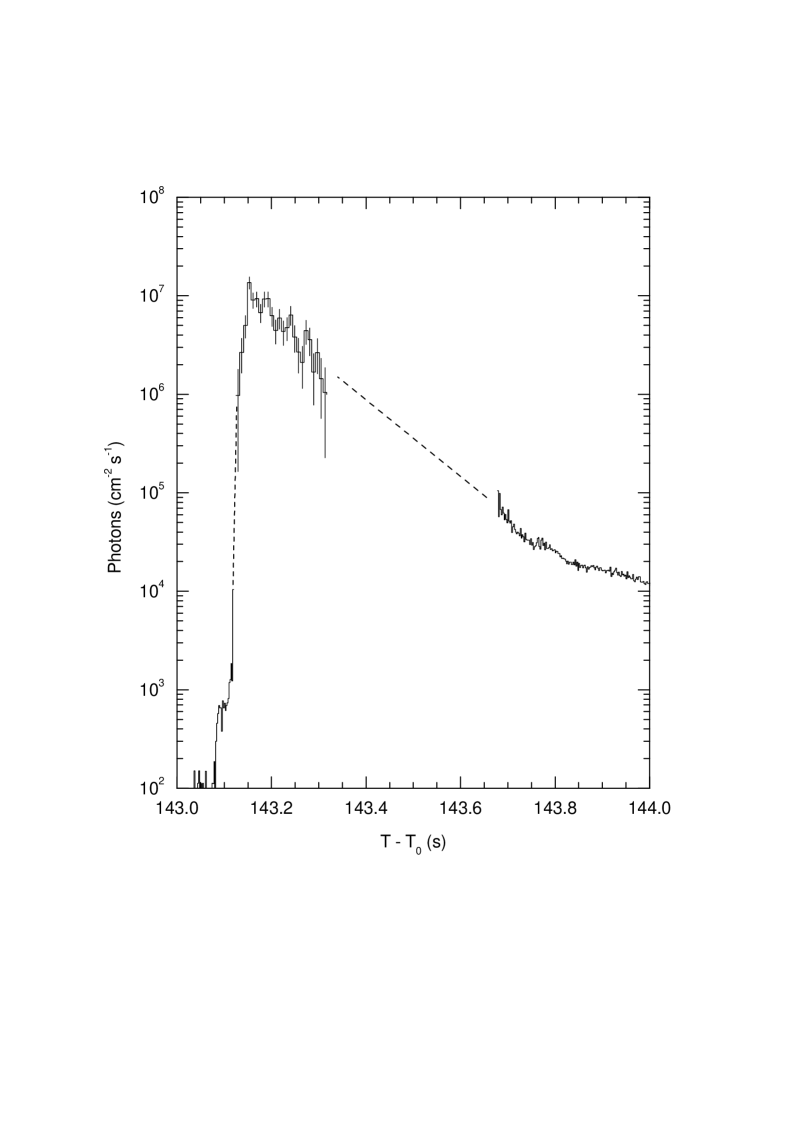
Photons scattered from different zones of a spherical target reach an observer with a relative time delay whose maximum value is ms, where is the Moon’s radius, and is the velocity of light. This gives rise to a blurred time profile of the reflected signal (Fig. 3). Correspondingly, the real front of the initial pulse should be shorter than observed, 10–15 ms. Figure 7 displays a reconstructed time profile of the initial pulse. By Wind’s information, the giant outburst starts with a comparatively slow intensity rise, which transforms in 20 ms to an avalanche-type growth. The continuation of the time history was derived from Coronas-F data by introducing the corresponding corrections for attenuation and spreading of the signal as it is scattered and propagates to Coronas-F. As evident from the figure, the intensity reaches a peak of photons cm-2 s-1. At Helicon sensitivity, the initial pulse is detected over a background for 150 ms. A saturation of the Konus lasts longer, about 600 ms.
Assuming isotropic emission and a distance to SGR 1806-20 of 15 kpc (ref. 15), the energy release and the maximal luminosity of the initial pulse are erg and erg s-1. The energy release in the tail of all the three giant outbursts in the SGRs is erg, and one may expect the energy confined in their initial pulses to be comparable, about erg. This is consistent with our earlier assumption that the lower limit on the energy released in the initial pulse of the giant outbursts from SGR 1900+14 is actually many times smaller than its true value (ref. 9), because the referred value of erg was calculated for a minimum flux which is capable of saturating the Konus. The energy release of 1046 erg is comparable to the energy stored in the magnetosphere of a neutron star with a surface magnetic dipole field of G. This may present serious difficulties for the magnetar model of SGRs (ref. 16). Giant outbursts from SGRs at larger distances should be observed as short (0.25 s) gamma-ray bursts with a hard spectrum (ref. 17). It is conceivable that it is such events that make up part of the Konus-Wind catalog of short gamma-ray bursts (ref. 18). Present-day gamma-ray spectrometers, which can reliably measure the time profile and energy spectrum of short gamma-ray bursts with fluences of erg cm-2, should be capable of recording the initial pulses of giant outbursts from SGRs at distances of 30 Mpc. If such a burst is localized to within 5–10 arc minutes, its identification with a host galaxy may become possible.
References
- (1) 1. Borkowski, J. et al. 2004, GCN Circ. 2920
- (2) 2. Hurley, K. et al. 2004, GCN Circ. 2921
- (3) 3. Mazets, E. P. et al. 2004, GCN Circ. 2922
- (4) 4. Palmer, D. et al. 2004, GCN Circ. 2925
- (5) 5. Smith, E. et al. 2005, GCN Circ. 2927
- (6) 6. Boggs, S. et al. 2005, GCN Circ. 2936
- (7) 7. Mazets, E. P., Golentskii, S. V., Ilinskii, V. N., Aptekar, R. L., Guryan, Iu. A. 1979, Nature, 282, 587
- (8) 8. Hurley, K. et al. 1999, Nature, 397, 41
- (9) 9. Mazets, E. P. et al. 1999, Astron. Lett., 25, 635
- (10) 10. Feroci, M. et al. 1999, ApJ, 515, L9
- (11) 11. Golenetskii, S. et al. 2004, GCN Circ. 2923
- (12) 12. Mazets, E. P. et al. 1999, ApJ, 519, L151
- (13) 13. Golenetskii, S. et al. 2004, GCN Circ. 2769
- (14) 14. Agostinelli, S. et al. 2003, NIM A, 506, 250
- (15) 15. Eikenberry, S. S. et al. 2004, ApJ, 616, 506
- (16) 16. Thompson, C., Duncan, R. C. 1995, MNRAS, 275, 255
- (17) 17. Mazets, E. P., Golenetskii, S. V., Gurian, Iu. A., Ilinskii, V. N. 1982, Ap&SS, 84, 173
- (18) 18. Mazets, E. P. et al. 2002, astro-ph/0209219