The Chandra Deep Field South/GOODS survey ††thanks: Based in part on observations obtained at the European Southern Observatory using the ESO Very Large Telescope on Cerro Paranal (ESO program 168.A-0485)
We provide important new constraints on the nature and
redshift distribution of optically faint ( R) X-ray
sources in the Chandra Deep Field South Survey. We use a large
multi-wavelength data set, including the GOODS/ACS survey, the
recently released Hubble Ultra Deep Field (UDF) data, and the new
public VLT/ISAAC imaging. We show that we can derive accurate
photometric redshifts for the spectroscopically unidentified
sources thus maximizing the redshift completeness for the whole
X-ray sample. Our new redshift distribution for the X-ray source
population is in better agreement with that predicted by X-ray
background synthesis models; however, we still find an
overdensity of low redshift (z) sources. The optically faint
sources are mainly X-ray absorbed AGN, as determined from direct
X-ray spectral analysis and other diagnostics.
Many of these
optically faint sources have high () X-ray-to-optical flux
ratios. We also find that of them are well fitted
with the SED of an early-type galaxy with z and the remaining with irregular or starburst
galaxies mainly at z. We estimate that of
the optically faint sources are X-ray absorbed QSOs. The overall
population of X-ray absorbed QSOs contributes a
fraction of the [2-10] keV X-ray Background (XRB) whereas current
XRB synthesis models predict a contribution.
Key Words.:
Surveys – Galaxies: active – (Galaxies:) quasars: general – (Cosmology:) diffuse radiation – X-ray: galaxies – X-rays: general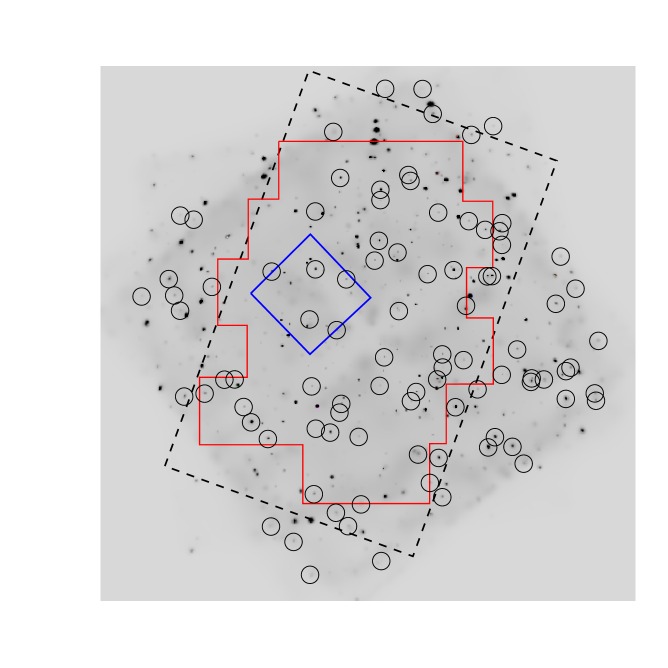

1 Introduction
Recent Chandra and XMM-Newton (Brandt et al.
brandt01 (2001), Rosati et al. rosati02 (2002), Hasinger et al.
hasinger01 (2001)) deep surveys have almost resolved the entire
keV X-ray background (XRB), forty years after its discovery (Giacconi
et al. giacconi62 (1962)). A large optical follow-up program of
hundreds of X-ray sources in these fields has lead to the
identification of a mixture of obscured and unobscured AGN, with an
increasing fraction of obscured AGN at faint X-ray fluxes (Barger et
al. barger03 (2003), Szokoly et al. szokoly04 (2004)). The optical
counterparts of a significant fraction of the X-ray sources are too
faint (R25) for optical spectroscopy, even for
hours exposures with 8-10 m class telescopes. In this work, we focus
on this subsample of X-ray sources with R, which will be
referred to as Optically Faint Sources (OFS). This criterium
simply reflects an observational limit beyond which we need to rely on
accurate photometric measurements and X-ray spectral information to
estimate their redshift and to establish their physical nature. We
note that OFS represent a quarter of the entire X-ray sample,
therefore they have a significant impact on statistical studies, such
as the X-ray luminosity function, the evolution of the TypeI/TypeII
ratio and the overall NH distribution. Moreover, many OFS are
relatively bright in the X-ray band, due to powerful AGN activity
[Alexander et al. (alexander01 (2001)); Mignoli et al.
(mignoli04 (2004))]. It is possible that a sizeble fraction of these
sources belong to the long-sought class of high-redshift, high
luminosity, heavily obscured active galactic nuclei (Type II QSOs).
The first detailed study of OFS has been done by Alexander et al.
(alexander01 (2001)) in the Chandra Deep Field Nord (CDF-N). Here we
extend that work by estimating photometric redshifts for a large
fraction of the OFS population, providing direct constraints on their
intrinsic absorption and on their spectral energy distribution.
The
outline of the paper is as follows: in §2 we describe the X-ray
sample. In §3 we compare the X-ray properties of the optically bright
(R25) and faint (R25) X-ray sources. In §4 we derive
photometric redshifts. In §5 we discuss the few OFS with known
spectroscopic redshifts. In §6 we use the X-ray to optical flux
ratios as a diagnostic tool. In §7 we perform an X-ray spectral
analysis and in §8 we derive the fraction of OFS that are likely to
be X-ray detected Type-2 QSOs. We study in detail the OFS inside the
Hubble Ultra Deep Field in §9. Finally in §10 we summarize and
discuss the results. Throughout this paper we use Vega magnitudes (if
not otherwise stated) and assume ,
and H km/s/Mpc.
2 The sample
The X-ray sample is obtained from the 1 Ms Chandra observation
of the Chandra Deep Field South (CDF-S; Giacconi et al.
giacconi02 (2002); Rosati et al. rosati02 (2002)). We refer to Table 2
in Giacconi et al. (giacconi02 (2002)) for the X-ray quantities and
relative errors (e.g., X-ray fluxes, counts). In Figure
1 we show a smoothed 0.5-7 keV image of the CDF-S
field on which we have highlighted the OFS. The distribution of R band
magnitudes for the X-ray sources is reported in Figure
2. From the entire X-ray sample of 346 sources, 92
are OFS (), of which 46 ( of the total sample)
do not have a R band counterpart (down to R26.1-26.7). In the
CDF-N, the fraction of optically faint sources (I) is slightly
larger (; Alexander et al. alexander01 (2001));
however, this study was performed in the most sensitive region of the
CDF-N field, while here we are considering the whole of the CDF-S
field.
At present only six () of the OFS have been
spectroscopically identified, as compared to 151 () of the
optically bright (R) X-ray sources (Szokoly et al.
szokoly04 (2004)). We will discuss in detail the properties of these
six OFS in Section 5. For the remaining OFS it
will be challenging to obtain a spectroscopic redshift with 8-10 meter
telescopes, with the exception of those sources with strong emission
lines. In order to obtain information on their redshift distribution
we have determined photometric redshifts (see Section
4).
3 Comparison of the optically bright and optically faint X-ray source samples
Before we investigate in detail the nature of the optically faint X-ray source population, we will compare their general X-ray properties with those of the well-studied optically bright X-ray source population (see also Section 4 of Alexander et al. alexander01 (2001)).
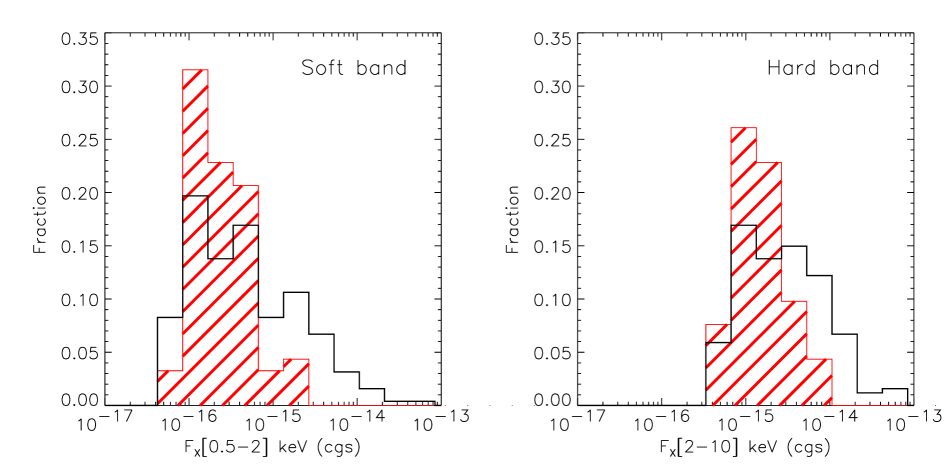
3.1 X-ray fluxes
In Figure 3 we compare the X-ray fluxes distributions of the optically bright and faint sources in the 0.52 keV (left panel) and 210 keV bands (right panel). According to a Kolmogorov-Smirnov test the probability that the distributions are drawn from the same population is extremely small ( in the 0.5-2 keV band and in the 2-10 keV band). According to Figure 3, almost all the bright X-ray sources are part of the optically bright sample.
The total flux in the 2-10 keV band of the OFS is erg cm-2 s-1 deg-2 after correcting for the sky coverage in the CDF-S (see Fig. 5 of Giacconi et al. giacconi02 (2002)). This accounts for a fraction of the [2-10] keV XRB; the estimated error range corresponds to the uncertainty in the measurement of the XRB flux (HEAO, Marshall et al. marshall80 (1980) and Revnivtsev et al. revnivtsev04 (2004); SAX, Vecchi et al. vecchi99 (1999); XMM-Newton, De Luca & Molendi deluca04 (2004)).
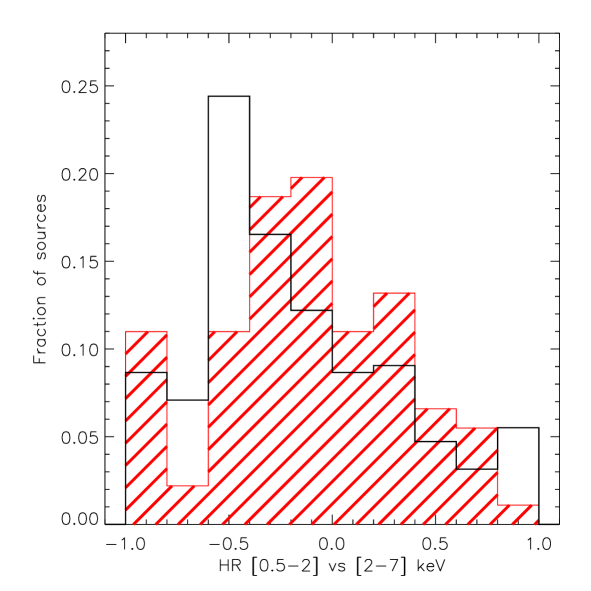
3.2 Hardness ratios distibution
The hardness ratio (HR) is a useful tool to characterize the spectral
shape of the AGN X-ray continuum. We adopt the definition
HR(HS)/(HS), where H and S are the net count rates in
the 2-7 keV and 0.5-2 keV band, respectively. We have recomputed the
HR values over those given in Giacconi et al. (giacconi02 (2002)) by
performing aperture photometry for each source in both the 0.5-2 keV
and 2-10 keV bands irregardless of whether the source is detected in
either of these bands. Therefore, several values previously set to
or (Giacconi et al. giacconi02 (2002)) have a different
value, still consistent with the old one within 1 error. When
HR, we plot the 1 upper/lower limits. Other minor
differences come from the new reduction of the CDF-S data performed
after the release of CALDB 2.26 and CIAO3.1. In particular, we applied
the correction for the degraded effective area of ACIS–I chips due to
material accumulated on the ACIS optical blocking filter at the epoch
of the observation using the recently released time–dependent gain
correction (see http://asc.harvard.edu/ciao/threads/acistimegain/).
We have corrected the HR values for the off-axis angle of the source,
normalizing the soft and hard counts to refer to an on-axis source
falling on the aimpoint (chip3). To do that, we have used the soft and
hard exposure maps computed for the monochromatic energies of 1.5 and
4.5 keV respectively.
In Figure 4 we show the hardness ratio distributions.
A larger fraction of OFS show a high HR, typical of intrinsically
absorbed AGN emission, than found in the optically bright
sample.111The HR is a reasonable indicator of the intrinsic
column density of an AGN only for . At higher
redshifts an absorbed AGN can have a lower HR value due to the
higher rest-frame energies probed in the observed X-ray band. The
two HR distributions are distinguishable according to the
Kolmogorov-Smirnov test at the significance level; a similar
result has been obtained by Alexander et al. (alexander01 (2001)) in
the CDF-N. These findings are also in agreement with the general trend
toward flatter X-ray spectral slopes at fainter X-ray fluxes (i.e.
Tozzi et al. tozzi01 (2001)). It has been shown that this flattening
is due to the fainter X-ray sources having more absorbed X-ray spectra
(see e.g. Mainieri et al. mainieri02 (2002); Kim et al.
kim04 (2004)).
We conclude that there is a larger fraction of OFS
with flat X-ray spectral slopes. To confirm that this flattening is
due to high intrinsic absorption we fit the X-ray spectra of each
source. We discuss this in more detail in §7.
4 Photometric redshift technique applied to an X-ray selected sample
Given the optically faintness of the OFS, the only viable way to
determine their redshifts is to use photometric redshift techniques.
In recent years, these techniques have achieved good accuracy,
particularly when high quality multiwavelength imaging data is
available; e.g. for the Hubble
Deep Field North (Fernández-Soto et al. fernandez99 (1999); Benitez
benitez00 (2000); Furusawa et al. furusawa00 (2000)). These procedures
rely on detecting the passage of continuum features within the
spectral energy distribution (SED) of sources across a series of
photometric passbands (e.g., the break).
Recently these techniques have also been applied to the optical
counterparts of X-ray sources. For these sources the contribution to
the optical/near-IR emission from the AGN nucleus can be significant.
Gonzalez & Maccarone (gonzalez02 (2002)) studied a sample of 65
sources detected by Chandra in the Hubble Deep Field North
and flanking fields. By using a set of galaxy templates, and excluding
objects dominated by the emission from the QSO, they were able to
obtain photometric redshifts to an accuracy similar to that achieved
for non-active galaxies. Mobasher et al. (mobasher04 (2004)) used the
wide multiwavelength photometry from the Great Observatories Origins
Deep Survey (GOODS)222see: http://www.stsci.edu/science/goods/
to derive photometric redshifts for a sample of 19 AGN with
spectroscopic identification. They found an rms scatter of
, good enough to be useful for many science
applications. Finally, Zheng et al. (zheng04 (2004)), using the GOODS
photometry, estimated photometric redshifts for the full sample of 346
X-ray sources detected in the CDF-S (Giacconi et al.
giacconi02 (2002)). By comparison with known spectroscopic redshifts
(137 sources from Szokoly et al. szokoly04 (2004)) we derived an
average dispersion .
In Zheng et al. (zheng04 (2004)), we presented photometric redshifts for the full sample of X-ray sources in the CDF-S. In this work, we fully describe our methodology developed to produce the best results for the OFS. By determining likelihood contours in the redshift vs template plane, our approach clearly elucidate degeneracies/dependencies between redshift and SED/reddening which often affect the photometric redshift determination.
4.1 Multicolour catalogue
A key ingredient for deriving reliable photometric redshifts is broad,
multi-wavelength coverage and accurate photometry. An area of arcmin2 of GOODS/CDF-S has been imaged with the Advance Camera
for Surveys (ACS) on board of the Hubble Space Telescope (HST) in the
F435W, F606W, F775W and F850LP bands (Giavalisco et al.
giavalisco03 (2004)). A large program with the VLT is under way to
image the GOODS area in the bands, using some 32 ISAAC
fields to mosaic a 150 arcmin2 region (Vandame et al. in
preparation)333see:
http://www.eso.org/science/goods/releases/20040430/; in addition,
an extensive spectroscopic campaign has been completed with FORS2 at
ESO (Vanzella et al. vanzella04 (2004)) and additional spectroscopy
with VIMOS is planned in 2005.444see:
http://www.eso.org/science/goods/ The CDF-S has also been selected
as one of the target fields in the Spitzer legacy program GOODS
(Dickinson et al. dickinson02 (2002)). For an overview of the
available data in this field we refer the reader to Giavalisco et al.
(giavalisco03 (2004)).
We will restrict our photometric redshifts
estimation only to the region of the CDF-S covered by deep HST/ACS
imaging (see Figure 1) and we will refer to it as the
“GOODS area”. In this region there are 192 X-ray sources, 112
of which have a spectroscopic redshift (Szokoly et al.
szokoly04 (2004)). For this sample we have built a multicolour
catalogue in B435, V606, i775, z850, J, H, Ks
bands. For the four optical bands we refer to the publicly available
GOODS catalogue555http://www.stsci.edu/science/goods/, while
in the near-IR we use the deep VLT/ISAAC observations (Vandame et al.
in preparation), when available, or the shallower NTT/SOFI imaging
(Vandame et al. vandame01 (2001)).
We used SExtractor (Bertin & Arnouts, bertin96 (1996)) for source detection in each band. To obtain reliable source colours the spread in seeing conditions for images in different wavebands has been taken into account. We obtained PSF-matched magnitudes as follows: 1) we computed aperture magnitudes in each waveband using the available images (”original” images); 2) we degraded the point spread function (PSF) of each image to match the worst condition (”degraded” images); 3) we recomputed the aperture magnitudes using the ”degraded” images; 4) we derived corrections for the different seeing conditions by comparing the magnitudes of “bright” stars in the “original” and in the “degraded” images. These corrections ( mag) are applied to the ”original” magnitudes. We checked that those corrections are constant over a large magnitude range. We also corrected for Galactic extinction: the values in the different filters have been obtained from the NASA/IPAC Extragalactic Database which are taken from Schlegel et al. (schlegel98 (1998)). The corrections in the CDF-S region are small (from mag in the B band to mag in the Ks band).
In the following, we adopt an X-ray based classification as suggested by Szokoly et al. (szokoly04 (2004)), but using unabsorbed luminosities and intrinsic absorption as opposed to uncorrected luminosities and hardness ratio (see Tozzi et al. tozzi05 (2005)). We introduce the following classes: X-ray unabsorbed QSO: L erg/s and N cm-2; X-ray unabsorbed AGN: erg/s and N cm-2; X-ray absorbed QSO: L erg/s and N cm-2; X-ray absorbed AGN: erg/s and N cm-2; galaxy: L erg/s and N cm-2.
| XIDa | R mag | zspec | zphot | 1 b | templatec | oddsd | X/Oe | NHf | LXg | Class Xh |
|---|---|---|---|---|---|---|---|---|---|---|
| (Vega) | keV) | |||||||||
| 45 | 25.4 | 2.291 | 2.37 | 2.23-2.43 | 1.67 | 0.97 | 23.8 | 22.91 | 44.18 | QSO abs |
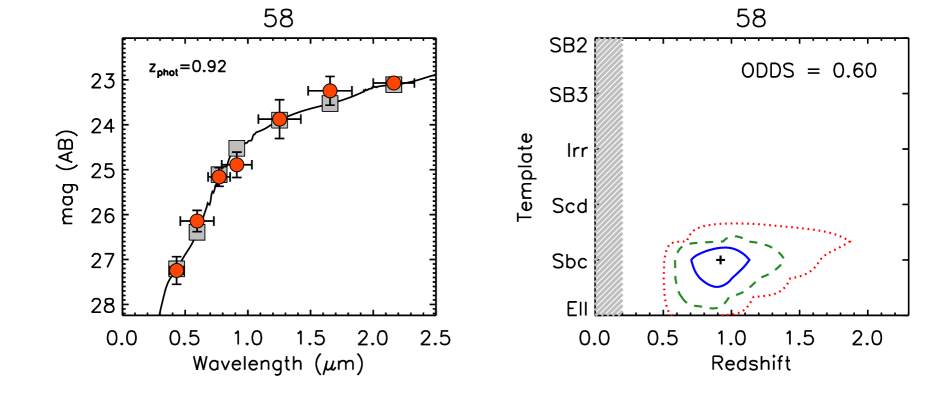
| 58 | 26.0 | … | 0.92 | 0.75-1.07 | 2.00 | 0.60 | 19.2 | 22.40 | 43.16 | AGN abs |
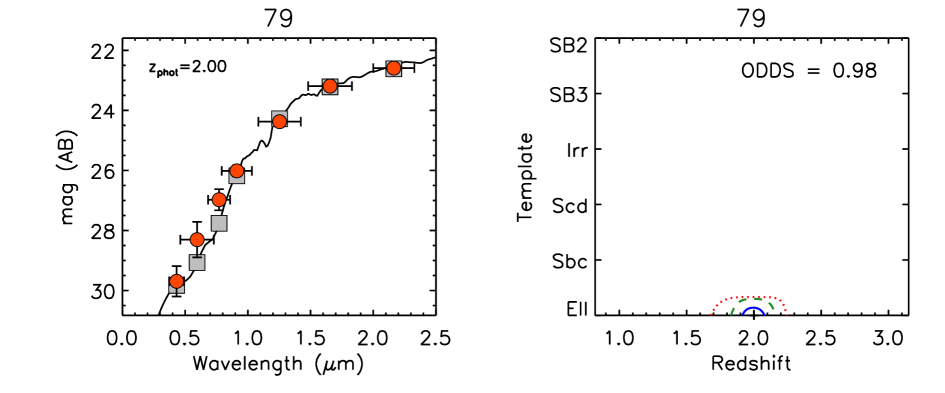
| 79 | 26.5 | … | 2.00 | 1.91-2.07 | 1.00 | 0.98 | 36.4 | 21.75 | 43.67 | AGN unabs |
| 79A∗ | 26.5 | … | 1.82 | 1.76-1.86 | 1.33 | 1.00 | 36.4 | 21.75 | 43.67 | AGN unabs |
| 81 | 26.0 | … | 2.59 | 2.47-2.59 | 2.33 | 0.95 | 10.2 | 22.63 | 43.81 | AGN abs |
| 82 | 25.9 | … | 1.89 | 1.79-1.97 | 1.33 | 0.97 | 12.1 | 23.47 | 43.79 | AGN abs |
| 108 | 25.9 | … | 1.56 | 1.48-1.66 | 2.33 | 0.96 | 8.4 | 21.79 | 43.15 | AGN unabs |
| 117 | 25.5 | 2.573 | 2.75 | 2.50-3.00 | 1.33 | 0.85 | 8.5 | 22.49 | 43.99 | AGN abs |
| 124 | 25.3 | … | 0.61 | 0.45-0.77 | 3.00 | 0.53 | 0.3 | 21.62 | 41.75 | galaxy |
| 133 | 99.0 | … | 1.21 | 0.78-4.08 | 2.00 | 0.11 | 21.9 | 22.75 | 43.32 | AGN abs |
| 146 | 99.0 | … | 2.67 | 2.55-2.66 | 1.67 | 0.97 | 42.3 | 24.18 | 45.11 | QSO abs |
| 147 | 25.1 | … | 0.99 | 0.89-1.10 | 2.00 | 0.87 | 16.3 | 23.39 | 43.67 | AGN abs |
| 148 | 27.3 | … | 1.74 | 1.62-1.88 | 1.67 | 0.87 | 69.9 | 24.18 | 45.09 | QSO abs |
| 159 | 99.0 | … | 3.30 | 3.17-3.46 | 3.67 | 0.98 | 142.8 | 23.00 | 44.81 | QSO abs |
| 178 | 26.0 | … | 0.29 | 0.23-3.54 | 3.67 | 0.32 | 0.7 | 21.68 | 41.00 | galaxy |
| 210 | 99.0 | … | 1.73 | 1.60-1.95 | 1.33 | 0.74 | 18.1 | 22.32 | 43.36 | AGN abs |
| 217 | 25.8 | … | 7.72 | 1.08-7.62 | 5.00 | 0.30 | 0.8 | 23.06 | 43.80 | AGN abs |
| 221 | 99.0 | … | 2.51 | 2.34-2.62 | 1.00 | 0.90 | 1.6 | 22.58 | 43.32 | AGN abs |
| 226 | 99.0 | … | 1.45 | 1.14-1.87 | 5.67 | 0.39 | 24.4 | 22.17 | 43.35 | AGN abs |
| 227 | 99.0 | … | 2.18 | 1.98-2.36 | 1.33 | 0.77 | 33.8 | 23.83 | 44.24 | QSO abs |
| 240 | 25.0 | … | 1.41 | 1.35-1.53 | 1.33 | 0.95 | 4.4 | 22.42 | 43.13 | AGN abs |
| 243 | 99.0 | … | 7.89 | 7.56-7.93 | 4.00 | 0.99 | 40.2 | 23.26 | 44.11 | QSO abs |
| 263 | 25.3 | 3.660 | 3.50 | 3.32-3.56 | 3.33 | 0.97 | 5.5 | 24.18 | 44.54 | QSO abs |
| 265 | 99.0 | 1.215 | 1.16 | 1.09-1.24 | 1.33 | 0.98 | 51.2 | 23.20 | 43.70 | AGN abs |
| 508 | 99.0 | … | 2.50 | 1.90-2.85 | 1.00 | 0.58 | 18.8 | 23.88 | 44.15 | QSO abs |
a XID from Giacconi et al. (giacconi02 (2002)).
b 1 confidence range.
c Best fit template. BPZ performs two interpolations between each one of the following templates:
1: Elliptical (CWW)
2: Sbc (CWW)
3: Scd (CWW)
4: Irregular (CWW)
5: SB3 (Kinney)
6: SB2 (Kinney).
d Odds parameter which gives a metric on the reliability of the photometric redshift determination (see Sec. 4.2).
e X-ray-to-optical flux ratios.
f Logaritm of the column density.
g Logaritm of the unabsorbed X-ray luminosity in the [0.5-10] keV band. The uncertainties are smaller than 0.01 in the adopted units.
h X-ray classification (see Sec. 4.1).
∗ Photometric redshift obtained using the UDF photometry (see Sec. 9 and Fig. 12,13).
| XIDa | R mag | zspec | zphot | 1 b | templatec | oddsd | X/Oe | NHf | LXg | Class Xh |
|---|---|---|---|---|---|---|---|---|---|---|
| (Vega) | keV) | |||||||||
| 510 | 25.4 | … | 2.51 | 2.34-2.59 | 2.33 | 0.93 | 5.1 | 23.44 | 43.79 | AGN abs |
| 513 | 26.1 | … | 3.56 | 3.41-3.68 | 1.00 | 0.96 | 7.6 | 24.16 | 44.19 | QSO abs |
| 515 | 99.0 | … | 2.26 | 2.13-2.46 | 1.67 | 0.84 | 19.7 | 23.50 | 43.75 | AGN abs |
| 515∗ | 99.0 | … | 2.30 | 2.24-2.38 | 2.00 | 1.00 | 19.7 | 23.50 | 43.75 | AGN abs |
| 518 | 99.0 | … | 0.84 | 0.58-1.37 | 2.00 | 0.33 | 9.5 | 21.91 | 42.23 | AGN unabs |
| 523 | 99.0 | … | 1.32 | 0.87-6.22 | 2.00 | 0.10 | 11.3 | 22.98 | 43.08 | AGN abs |
| 524 | 99.0 | … | 2.36 | 2.17-2.58 | 1.67 | 0.75 | 18.5 | 23.39 | 43.84 | AGN abs |
| 537 | 99.0 | … | 1.54 | 1.31-1.63 | 6.00 | 0.65 | 9.0 | 22.62 | 42.89 | AGN abs |
| 555 | 25.4 | … | 2.28 | 2.11-2.46 | 3.00 | 0.79 | 0.3 | 22.68 | 42.83 | AGN unabs |
| 557 | 25.4 | … | 1.81 | 1.75-1.96 | 1.33 | 0.92 | 0.3 | 22.66 | 42.88 | AGN abs |
| 561 | 99.0 | … | 0.62 | 0.50-0.87 | 2.33 | 0.47 | 1.6 | 21.38 | 41.82 | galaxy |
| 564 | 99.0 | … | 0.43 | 0.23-0.54 | 4.33 | 0.51 | 1.4 | 21.79 | 41.53 | galaxy |
| 572 | 27.0 | … | 2.73 | 2.21-2.68 | 2.00 | 0.53 | 1.8 | 23.43 | 43.62 | AGN abs |
| 583 | 99.0 | … | 2.77 | 2.66-2.88 | 1.00 | 1.00 | 2.2 | 23.32 | 43.77 | AGN abs |
| 589 | 99.0 | … | 1.33 | 0.89-6.51 | 2.00 | 0.10 | 1.2 | 22.90 | 42.81 | AGN abs |
| 593 | 25.9 | … | 2.07 | 1.83-2.15 | 2.67 | 0.77 | 0.6 | 23.32 | 43.31 | AGN abs |
| 599 | 25.2 | … | 2.84 | 2.48-2.82 | 1.33 | 0.76 | 1.9 | 24.05 | 43.99 | AGN abs |
| 605 | 99.0 | … | 4.71 | 4.39-4.83 | 5.00 | 0.85 | 8.2 | 24.70 | 44.52 | QSO abs |
| 605A∗ | 99.0 | … | 4.29 | 4.21-4.32 | 3.67 | 0.99 | 8.2 | 24.70 | 44.52 | QSO abs |
| 606 | 25.3 | 1.037 | 1.00 | 0.92-1.06 | 2.67 | 0.95 | 4.8 | 23.27 | 43.16 | AGN abs |
| 610 | 99.0 | … | 2.04 | 1.94-2.17 | 1.00 | 0.90 | 8.7 | 24.18 | 43.87 | AGN abs |
| 614 | 99.0 | … | 1.13 | 0.60-1.57 | 4.33 | 0.27 | 19.8 | 21.30 | 42.67 | AGN unabs |
| 618 | 25.6 | … | 4.66 | 4.59-4.72 | 6.00 | 1.00 | 0.8 | 23.86 | 44.30 | QSO abs |
| 626 | 25.4 | … | 0.59 | 0.55-0.62 | 6.00 | 1.00 | 0.4 | 22.45 | 42.94 | AGN abs |
| 628 | 99.0 | … | 2.07 | 2.01-2.17 | 2.00 | 0.99 | 1.2 | 23.93 | 43.68 | AGN abs |
| 629 | 25.3 | … | 0.56 | 0.49-0.61 | 6.00 | 0.97 | 0.3 | 22.37 | 41.39 | galaxy |
4.2 Photometric redshifts
Using the extraordinarily deep and wide photometric coverage in the
“GOODS area”, we have computed photometric redshifts for the OFS.
This allows us to estimate the redshift distribution of OFS to a
greater precision than has been performed before. For example,
Alexander et al. (alexander01 (2001)) assumed that most OFS reside in
L⋆ host galaxies to infer that the majority of the
population is in the redshift range of z.
We used the
publicly available code BPZ (Benitez benitez00 (2000))666BPZ is
available from http://acs.pha.jhu.edu/txitxo/. This code
combines minimization and Bayesian marginalization, using
prior probabilities to include a priori knowledge of the
distribution of galaxy magnitudes and spectral types with redshift. We
used the default library of spectral templates in BPZ: four ( E, Sbc,
Scd, Irr) are spectral energy distributions from Coleman, Wu &
Weedman (coleman80 (1980)) and two are derived from spectra of
starburst galaxies in Kinney at al. (kinney96 (1996)). We allowed the
code to calculate two interpolated SEDs between each pair of these
templates.
BPZ provides the “odds” parameter to characterize the
accuracy of the redshift estimation. This parameter is defined as the
integral of the redshift probability distribution within the interval
, where is the value which
maximizes the probability distribution and the observed
. A low value () of the odds parameter is a warning that
the probability distribution is spread over a large redshift range or
is double-peaked.
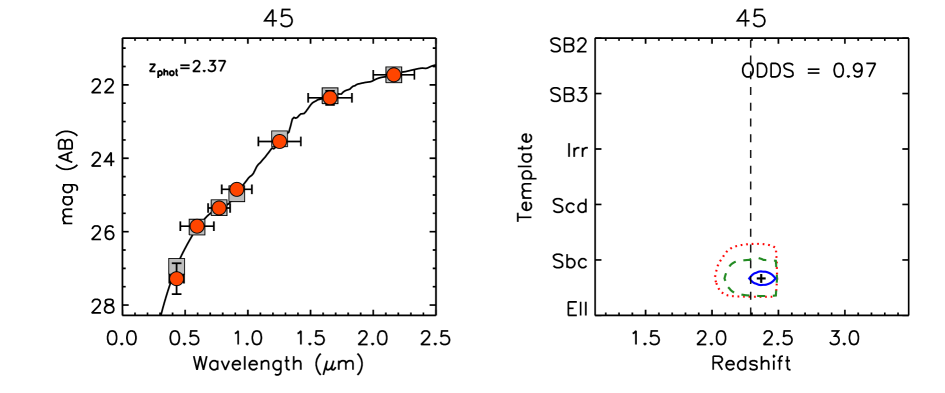
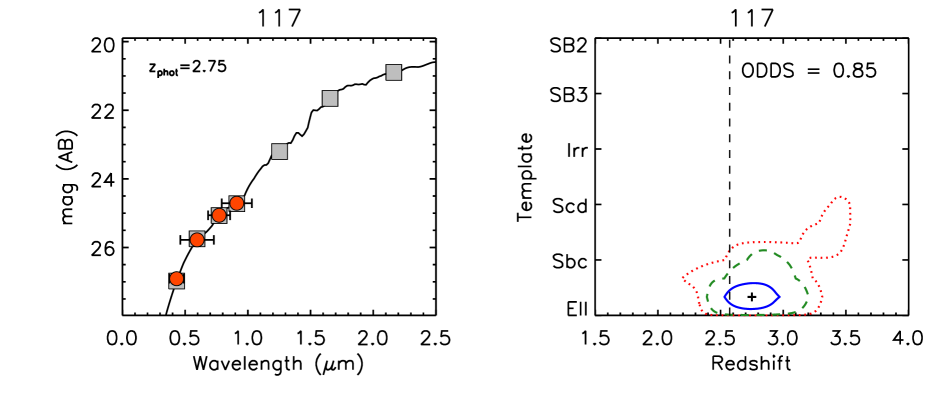
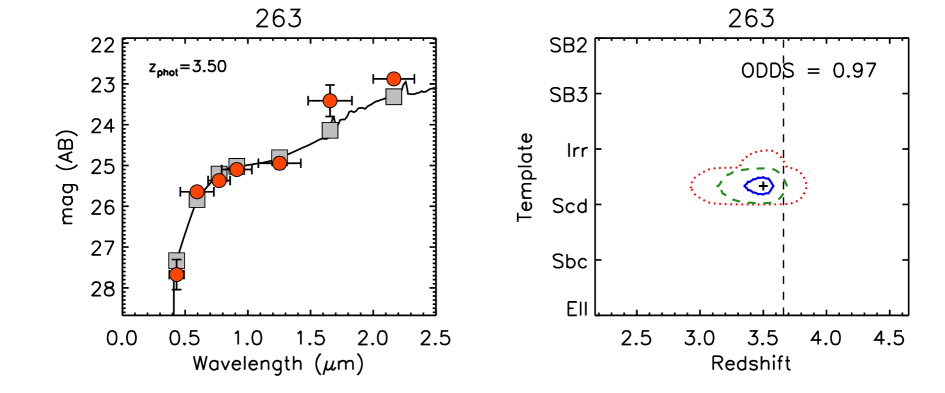
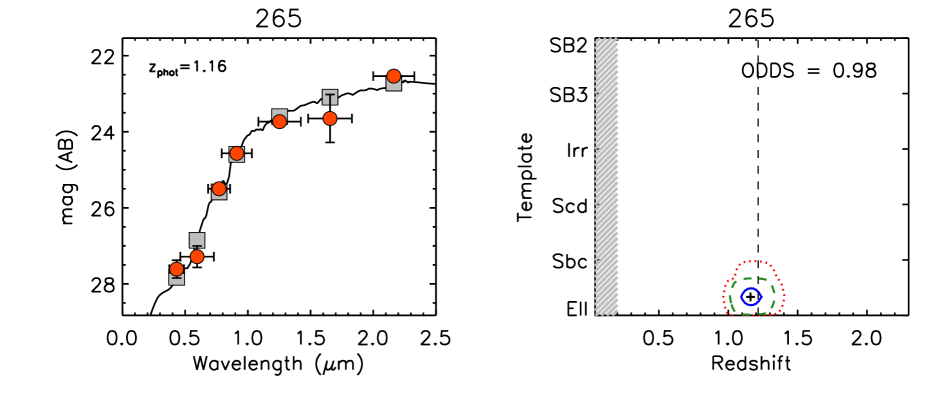
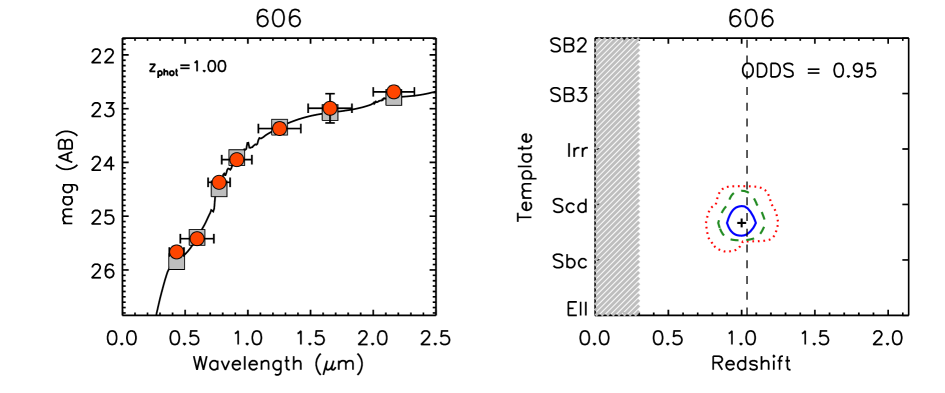
The reliability of the OFS photometric redshifts was estimated using
the five spectroscopically identified OFS in the “GOODS area”:
CDF-S/XID 45, 117, 263, 265 and 606 (see Table 3
and Figure 5-6).
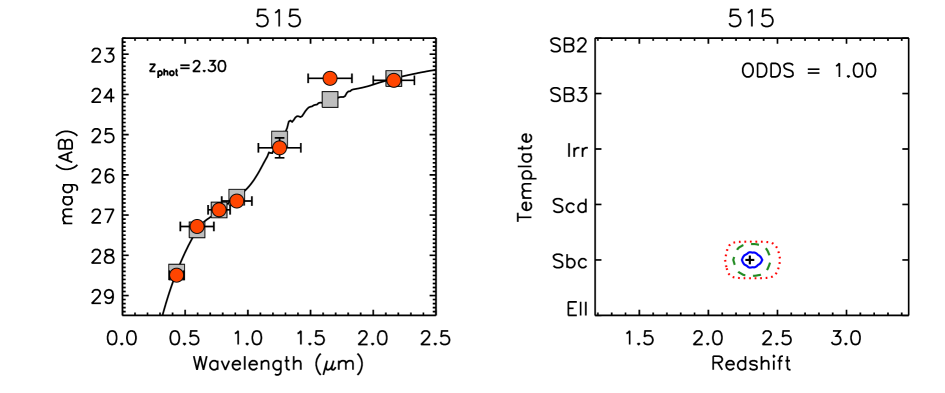
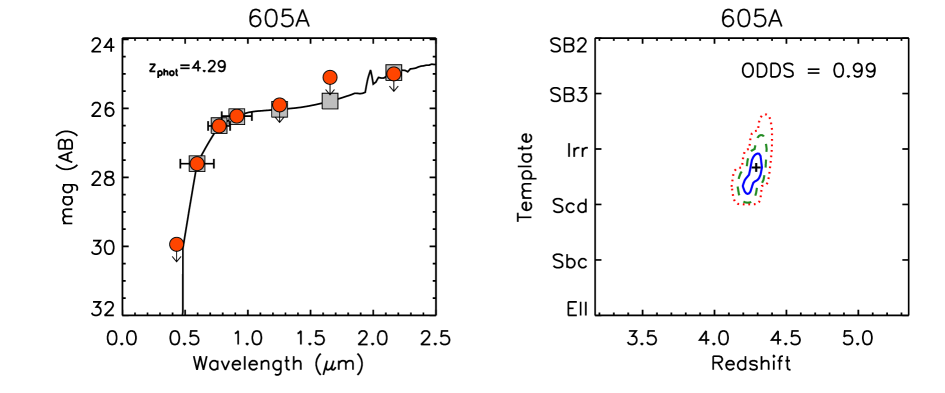
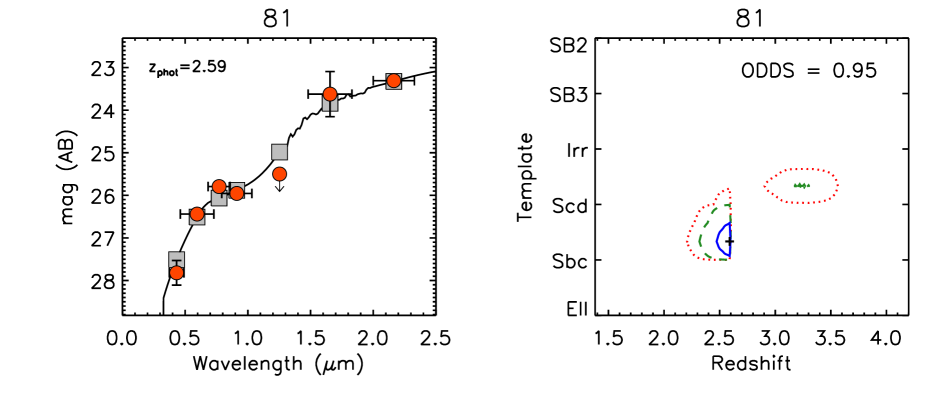
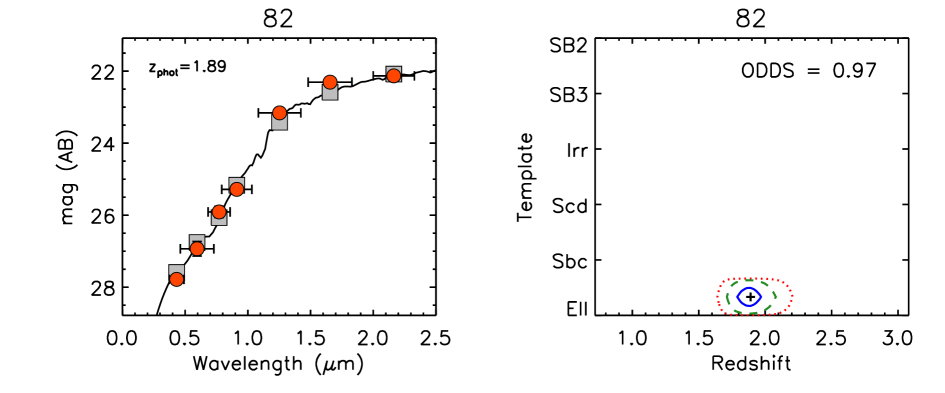
In the left column the best fit template is plotted together with the
observed photometry. On the right column, likelihood contours
(, , ) are reported in the SED
template vs redshift plane. In all of the five cases the agreement
between the photometric and spectroscopic redshift is extremely good,
even for source CDF-S/XID 117 for which we do not have reliable
near-IR photometry. Therefore we are confident that we can apply this
procedure to the whole of OFS class. In Table 1
and 2 we report the derived photometric
redshifts and the 1 confidence range. Best fits and
confidence contours for each source are shown in Figure
14.
We have also used X-ray information to set
a posteriori constraints in the redshift solution space. In a plot of
the Hardness Ratio versus the X-ray luminosity of the sources in
the CDF-S (see Figure 10 of Szokoly et al. szokoly04 (2004)) almost
all of the sources spectroscopically identified as AGN have: HR and L erg s-1.
Consequently for all the objects with HR we have imposed a
minimum X-ray luminosity limit (L erg s-1) that converts to a minimum redshift for each
source (zmin). In the confidence contour plots the shaded
area corresponds to z, where the probability to have
the correct solution is low ( see Figure 5
and Figure 14).777 of the X-ray
sources in the CDF-S with spectroscopic redshifts and HR have L
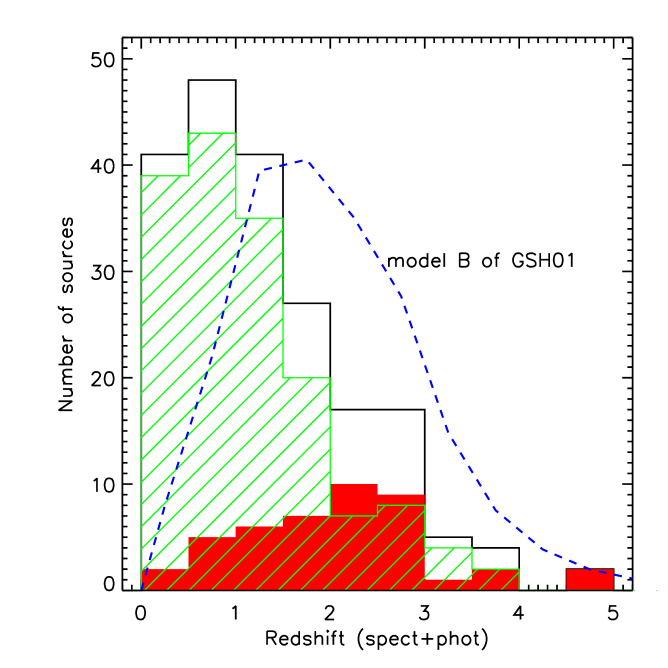
We compare in Figure 7 the redshift distribution
of optically bright sources and OFS. We use the spectroscopic
redshift, if known, or the derived photometric redshift, if the source
is still unidentified. The solid histogram shows the redshift
distribution of the OFS, the hatched histogram shows the distribution
of optically bright sources, and the open histogram shows the
distribution of the whole X-ray sample. We have excluded sources
belonging to the two large scale structures at z and 0.73
discovered by Gilli et al. (gilli03a (2003)) in the CDF-S. The
uncertainties in the photometric redshifts are too large to determine
whether a source belongs to these structures. Since of the
spectroscopically identified sources with z belong to the redshift spikes, we assumed that a similar
fraction of sources with z are part
of the same structures.
In Figure 7, we have overplotted for comparison the prediction of a synthesis model for the XRB [model B from Gilli, Salvati & Hasinger (gilli01 (2001))].
The majority of the OFS lie at z, with a small fraction at z, as previously predicted by Alexander et al. (alexander01 (2001)). Perhaps surprisingly, a small fraction of OFS lie at z. We note that a larger fraction () of OFS are at z than found for the optically bright sources (). According to a K-S test the probability that these two distributions are drawn from the same population is extremely small ( ). These have to be taken into account when comparing the redshift distributions of recent deep Chandra and XMM-Newton surveys with XRB synthesis models predictions. Almost all of the spectroscopically identified sources in the two deepest Chandra pointings are optically bright: both in the CDF-S and CDF-N. It has been noted (Hasinger hasinger02 (2002); Gilli gilli03b (2004)) that the redshift distribution of these new surveys is in disagreement with XRB models predictions based on the ROSAT X-ray luminosity function. These models predict that the distribution peaks at z, whereas the observed N(z) of the sources identified to date peaks at z. Since OFS appear to have a N(z) peaking at z ( Figure 7) and they make up the majority of still unidentified sources, the disagreement with the models predictions is attenuated. Nevertheless, a significant discrepancy with the models remains even with the addition of photometric redshifts (Figure 7). A solution for this problem requires a new determination of the X-ray luminosity function of AGN ( one of the main input parameters of XRB synthesis models), particularly exploring the X-ray fainter regime not covered by previous surveys (Gilli gilli03b (2004)). A similar result has been recently found by Fiore et al. (fiore03 (2003)) using a different approach to derive the redshift information for unidentified sources in the HELLAS2XMM 1dF sample.
Finally, a significant fraction (46 out of 346, ) of the X-ray sources in the 1 Msec Chandra exposure (Giacconi et al. giacconi02 (2002)), are not detected in deep VLT optical images down to R. Yan et al. (yan03 (2003)) identified in the near-IR six of these objects using the first release of deep VLT/ISAAC JHKs data, which covered an area 2.5 times smaller than the new extended ISAAC imaging shown in Figure 2. Using optical/near-IR colour-colour diagrams the authors concluded that they were likely to be E/S0 galaxies at . Taking advantage of the deep optical ACS photometry we can now set tighter constraints on the redshift of these six sources: CDF-S/XID 201 has a spectroscopic redshift of z (Szokoly et al. szokoly04 (2004))888This source is not reported in Table 3 and 1 because, as shown in Szokoly et al. (szokoly04 (2004)), an optical counterpart (201b) with R has been identified inside the Chandra error circle.; the best fit SED of CDF-S/XID 79 and CDF-S/XID 221 is an unreddened early-type galaxy with redshift and respectively and the remaining three sources (XID/CDFS 515,561,593) are best fitted with the template of a spiral galaxy and have photometric redshifts of , and respectively.
| XIDa | CXO CDFSb | Rc | RKd | ze | Qf | Optg | X-rayh | FSi | FHj | HRk |
|---|---|---|---|---|---|---|---|---|---|---|
| 45 | J033225.8274306 | 25.3 | 5.1 | 2.291 | 1 | LEX | QSO abs | |||
| 54 | J033214.7275422 | 25.7 | 5.4 | 2.561 | 3 | HEX | QSO abs | |||
| 117 | J033203.1274450 | 25.5 | 4.9 | 2.573 | 3 | HEX | AGN abs | |||
| 263 | J033218.9275136 | 25.3 | 5.1 | 3.660 | 3 | HEX | QSO abs | |||
| 265 | J033233.4274236 | 1.215m | 1 | LEX | AGN abs | |||||
| 606 | J033225.0275009 | 25.3 | 4.3 | 1.037 | 1 | LEX | AGN abs |
a XID from Giacconi et al. (giacconi02 (2002)).
b IAU registered name, based on original X-ray coordinates.
c Vega R magnitude for the optical counterpart
d Vega R-K colour for the optical counterpart
e Optical spectroscopic redshift for the optical counterpart (Szokoly et al. szokoly04 (2004)).
f Quality flag of the optical spectrum (see Szokoly et al. szokoly04 (2004)).
g Optical classification (see Szokoly et al. szokoly04 (2004)).
h X-ray classification.
i Flux in soft (0.5-2 keV) band, in units of erg cm-2 s-1.
j Flux in hard (2-10 keV) band, in units of erg cm-2 s-1.
k Hardness ratio, defined as (HS)/(HS) where H and S are the net counts in the hard and soft bands, respectively.
| XIDa | CXO CDFSb | countsc | N | L | cstatg | |
|---|---|---|---|---|---|---|
| 45 | J033225.8274306 | 1.46 | 22.91 | 150.7 | ||
| 54 | J033214.7275422 | 1.38 | 23.03 | 153.8 | ||
| 117 | J033203.1274450 | 1.8 | 22.49 | 126.4 | ||
| 263 | J033218.9275136 | 1.75 | 60.1 | |||
| 265 | J033233.4274236 | 1.8 | 23.20 | 107.9 | ||
| 606 | J033225.0275009 | 1.8 | 23.27 | 59.9 |
a XID from Giacconi et al. (giacconi02 (2002)).
b IAU registered name, based on original X-ray coordinates.
c Net counts in the [0.5-10] keV band.
d Spectral Index and 90% confidence range (Tozzi et al. (2005)).
e Logaritm of the intrinsic absorption (and 90% confidence range) [Tozzi et al. (2005)].
f X-ray luminosity in [0.5-10] keV band, deabsorbed and in erg s-1 [Tozzi et al. (2005)].
g C-statistic coefficient from the model fitting.

4.3 EXOs
The objects with extreme X-ray-to-optical ratios (EXOs) studied by Koekemoer et al. (koekemoer04 (2004)) are also included in our sample. These sources were selected to be undetected in the ACS z band of the GOODS survey. In this work, by supplementing the HST imaging with new deep VLT/ISAAC data in J, H and Ks bands we can improve the photometric redshift accuracy. Since in several bands we have only upper limits, the confidence contours for these sources are generally large and the low value of the odds parameter reflects the uncertainty in the redshift determination. However, in three cases we have odds0.6. The first, CDF-S/XID 243 has a single solution at high redshift ( z, which gives an absorbed L erg s-1, see Figure 14) and is best fitted with the SED of an irregular galaxy. Instead CDF-S/XID 508 has a double solution, with the peak of the redshift distribution corresponding at z ( absorbed L erg s-1) but with a secondary peak at lower redshift (, absorbed L erg s-1). We have inspected the X-ray spectrum of this source, and have detected a clear feature which, if identified with the Fe line at rest-frame 6.4 keV, would indicate a redshift of z (see Fig. 8). We therefore suspect that the lower redshift solution is correct. Finally, CDF-S/XID 583 is detected in the v, i and z ACS bands999In Koekemoer et al. (koekemoer04 (2004)) only of the ACS observation time were considered while here we have used the entire ACS data set. and this favours a low redshift solution ( z , absorbed L erg s-1). These results do not exclude the high-redshift ( z) AGN scenario proposed by Koekemoer et al. (koekemoer04 (2004)) for a small fraction of the EXOs population. We conclude that using the best multiwavelength imaging data set available to date, we have found a candidate at z; the other two EXOs are most likely at lower redshifts (z). Forthcoming Spitzer observations of this field shall determine more accurate photometric redshifts for the EXO population.
5 The properties of OFS with spectroscopic redshifts
For the few OFS with known redshifts, we can study their X-ray spectral properties. In the CDF-S, there are six of these objects and we report in Table 3 their main X-ray and optical properties. The depth of the 1 Msec CDF-S data enables us to perform an X-ray spectral analysis of these sources. We adopt a power-law model plus an absorption component. The fit yields the power-law photon index , the intrinsic column density NH, and the X-ray luminosity in the [0.5-10] keV rest-frame band corrected for absorption. We give the results of these fits in Table 4. Adopting the X-ray classification presented in Section 4.1, the sample comprises three X-ray absorbed QSOs, and three X-ray absorbed AGNs.

The identified OFS show a variety of optical classes in Table
3. Following the optical classification introduced
by Szokoly et al. (szokoly04 (2004))101010The spectroscopic data
of the CDF-S are publicly available at this URL:
http://www.mpe.mpg.de/mainieri/cdfs_pub/, there are: three
objects showing high excitation narrow lines (C iv1549) together with narrow Ly emission (HEX),
CDF-S/XID 54,117,263, and three objects showing only low excitation
lines (LEX) either Ly, CDF-S/XID 45, or [O ii]3727, CDF-S/XID 265,606. For the sources in the LEX
class, the presence of an AGN is only revealed by their high X-ray
luminosities.
In strongly absorbed X-ray sources, the host galaxy
dominates the optical and near-IR emission. The RK versus
diagram can be used to contrain the nature of the X-ray sources. We
present this diagram in Figure 9 for all of the CDF-S
sources with spectroscopic redshifts, highlighting the OFS. For
comparison, we also plot the evolutionary tracks expected for
classical Type-1 QSOs and galaxies of various morphological types. The
optically faint X-ray population has on average redder colours than
the optically bright population. For the 92 OFS of our sample, we find
that 60 () of them are Extremely Red Objects (EROs),
RK5, as compared to only 28 () for the optically
bright population (see also Alexander et al. alexander01 (2001) and
alexander02 (2002)). The OFS with spectroscopic identification cover
a wide redshift range (z).
In Figure 9, we plot also the OFS for which we have determined a photometric redshift. Almost all of them have colours dominated by the host galaxy (elliptical or spiral) and, except for a few candidates at high redshift, the bulk of them lie in the redshift range of , filling in a region that is poorly sampled by spectroscopically identified X-ray sources.
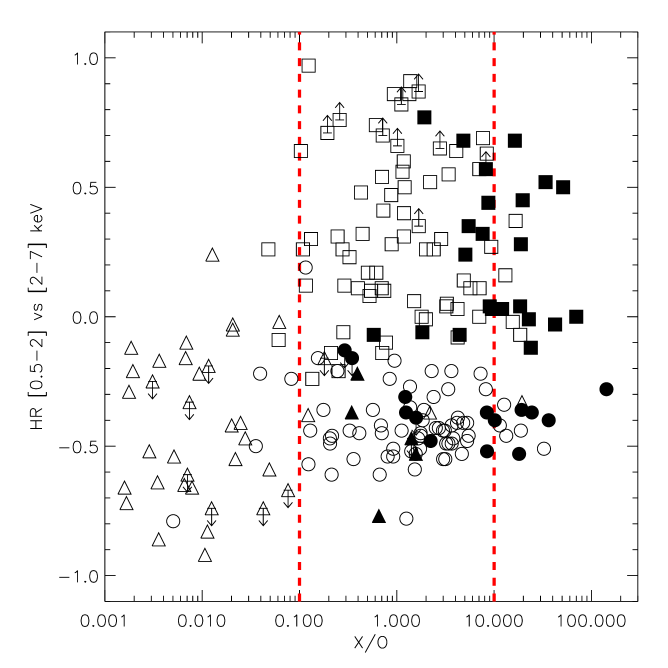
6 X-ray-to-optical flux ratios
X-ray-to-optical flux ratios (X/O) can yield important information on
the nature of X-ray sources (Maccacaro et al. maccacaro88 (1988)). A
value of is a clear sign of AGN activity since
normal galaxies and stars usually have lower X-ray-to-optical flux
ratios. In Figure 10, we show the hardness ratios
(HR) versus X/O for the X-ray sources in the CDF-S area. The majority
of X-ray unabsorbed and X-ray absorbed AGN/QSOs are inside the well
defined locus of active galactic nuclei (), while
“normal” galaxies, for which the contribution to the X-ray flux is
mainly due to star-formation activity, have X/O. The OFS have
ratios characteristic of AGN and of them show
intriguingly high values (X/O).111111We note that of the X-ray sources in the CDF-S with X/O are OFS. In
the spectroscopic follow-up of the CDF-S, three of the OFS with high
X/O have been identified (Szokoly et al. szokoly04 (2004); Vanzella
et al. vanzella04 (2004)): CDF-S/XID 45,54 and 265 have redshifts of
z,2.561 and 1.215, respectively. Two of them are classified as
X-ray absorbed QSOs and one as X-ray absorbed AGN (see Table
3). Recently, Mignoli et al. (mignoli04 (2004))
have studied a sample of eleven hard X-ray selected sources with
X/O using deep near-IR observations with ISAAC. All but one of
the sources have been detected in the KS band with very red
colors (RK). They were able to provide a
morphological classification and the sample is dominated by elliptical
profiles (7/10). Using the morphological information and the RK
colour the authors determined a minimum redshift for the sources in
the range z. In the OFS inside the “GOODS
area” there are 20 objects with such high X/O values and we have
determined photometric redshifts for them. Three sources ( CDF-S/XID
133,523,614) have extremely low value of the odds parameter and we
will exclude them in the following analysis. Two different classes of
objects are present. Twelve ( ) have a best fitting SED
of an elliptical galaxy, the average column density is cm-2 and their predicted redshift range is
(with a mean redshift of ). The
remaining sources have a best fitting SED of either an irregular or
starburst galaxy, with a mean redshift of z and X-ray spectra
indicating a low value of absorption ( cm-2). One of these sources is the z candidate
(CDF-S/XID 243) .121212We are sampling an X-ray flux regime ( erg cm-2 s-1) much fainter than the one studied
by Mignoli et al. (mignoli04 (2004)), erg cm-2
s-1 ( M. Brusa PhD thesis).
Summarizing, of
the OFS with X/O are X-ray absorbed AGN and their photometry is
well reproduced by an unreddened early-type template at . The other of the sources do not show strong X-ray
absorption, they have bluer colours and among them there are some high
redshift X-ray unabsorbed/absorbed QSOs. Finally, a significant
fraction ( ) of the sources with high X/O are X-ray
absorbed QSOs.
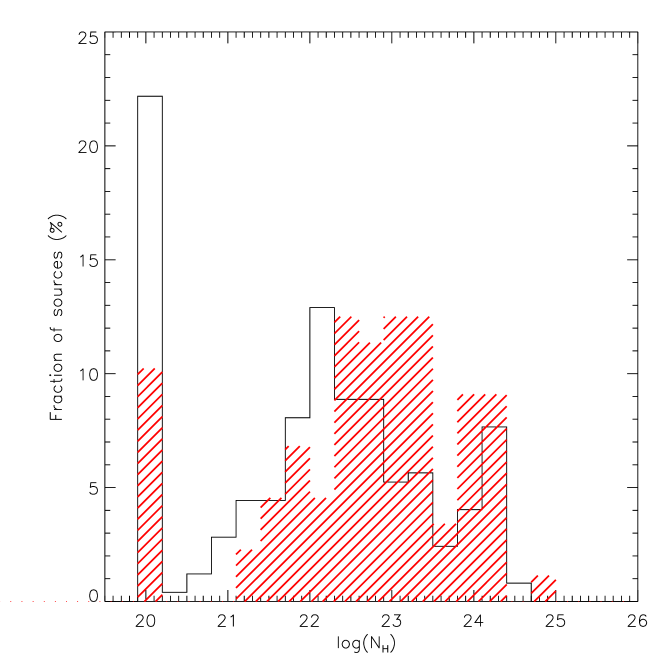
7 X-ray spectroscopy
To further investigate the characteristics of the OFS we have performed an X-ray spectral analysis of our sample. We use the X-ray data accumulated in the 1 Msec Chandra exposure and XSPEC (v11.1) for the fitting procedure. The spectral model adopted is a power-law with an intrinsic absorber at the source redshift. An additional photoelectric absorption component is fixed to the Galactic column density in the CDF-S region of the sky ( cm-2). For sources with less than 100 net counts in the [0.5-10] keV band, we fix the photon index at 1.8 and derive the column density NH (see Tozzi et al. tozzi05 (2005)). To estimate the intrinsic absorption that is affecting the X-ray source, its redshift is needed: we use the spectroscopic redshift if known otherwise we adopt the photometric redshift (Table 1). Thus, we are able to estimate the NH value for 336131313The remaining sources are either without a redshift estimate (four) or are stars (six). () of the 346 X-ray sources in the CDF-S. We show in Figure 11 the derived NH distribution. The open histogram is the distribution for optically bright sources while the hatched histogram refers to OFS. A K-S test of the two distributions gives a probability of that they are draw from the same population. We have already deduced from other diagnostics (X/O, hardness ratios, optical/near-IR colours) that a large fraction of these faint sources are absorbed. Figure 11 confirms and reinforces this picture since, in this case, we are measuring directly the absorption from the X-ray spectrum. Of the OFS have a column density larger than cm-2; for comparison the fraction of bright sources with such high NH value is . X-ray unabsorbed sources (the first bin in Figure 11) are approximatly three times more numerous between the optically bright than the optically faint sources.
8 X-ray absorbed QSOs
As mentioned in Section 5, a fraction of OFS could be made of X-ray absorbed QSOs. We find that 11 () of the OFS for which we have computed photometric redshifts have an X-ray luminosity in the [0.5-10] keV band larger than erg s-1 and a N cm-2, and consequently X-ray absorbed QSOs according to our definition in Section 4.1.
Several synthesis models of the XRB require a large population of obscured QSOs. To compare our results with the Gilli, Salvati & Hasinger (gilli01 (2001)) and Ueda et al. (ueda03 (2003)) models, we need to use the following definition of a X-ray absorbed QSO: rest-frame L keV erg s-1 and N cm-2. We find that 44 sources of the 336 X-ray sources (optically bright and faint) for which we were able to determine NH, satisfy these criteria. These X-ray absorbed QSOs contribute to the [2-10] keV XRB for a fraction of (if we adopt the HEAO-1 measure of the total flux of the XRB in the keV band)141414We note that at the depth of the CDF-S survey the whole hard XRB has been resolved according to the HEAO-1 measure (Rosati et al. rosati02 (2002)).. Model B of Gilli, Salvati & Hasinger (gilli01 (2001)) predicts a contribution from Type II QSOs to the hard XRB, while the recent model by Ueda et al. (ueda03 (2003)) requires a lower contribution from these sources () in good agreement with what we have found.
9 Ultra Deep Field
The Hubble Ultra Deep Field (UDF) is a 400-orbit program to image one
single field inside the ’GOODS area’ with the ACS camera on board of
HST (see Figure 1). Images have been taken in the
same four filters that were used for the GOODS survey: F435W (b), F606W (v), F775W (i) and F850LP (z). The data
have been recently released and go and magnitude deeper
than GOODS in the b and z band,
respectively.151515http://www.stsci.edu/hst/udf/
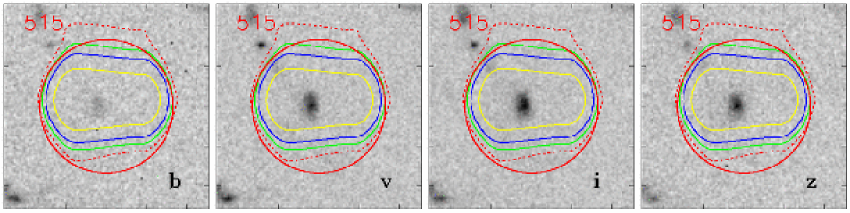
Inside the UDF
area there are sixteen X-ray sources in the Giacconi et al.
(giacconi02 (2002)) catalogue and three of them are OFS: CDFS/XID
79,515,605.161616We have also checked the Alexander et al.
(alexander03 (2003)) catalogue, which includes all of the sixteen
sources of Giacconi et al. (giacconi02 (2002)) plus one extra source
with counts in the full Chandra energy band and with
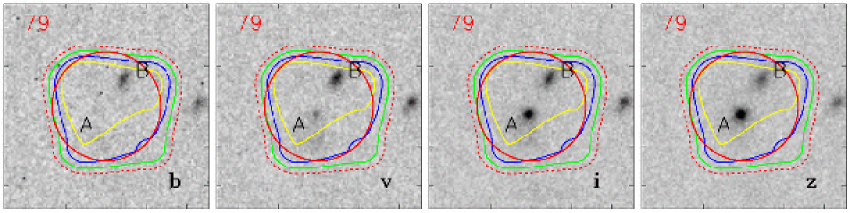
an optically bright counterpart. We have extracted cutouts for
these faint sources in the four UDF bands and show them in Figure
12. The unprecedented depth and resolution
of these images allows us to observe the optical properties of OFS
with sub-arcsecond resolution. We indicate in the cutouts the
positional error circle obtained in Giacconi et al.
(giacconi02 (2002)), which takes into account the strong effect of
off-axis angle in the X-ray PSF and centroid. For CDFS/XID 79 two
different counterparts are clearly present. We name these sources 79A
and 79B ( see Figure 12). They have
different colours: 79A is undetected in the b band and is
brighter than 79B in the i and z bands. In the cutouts of
CDFS/XID 515 there is only one optical counterpart inside the Chandra
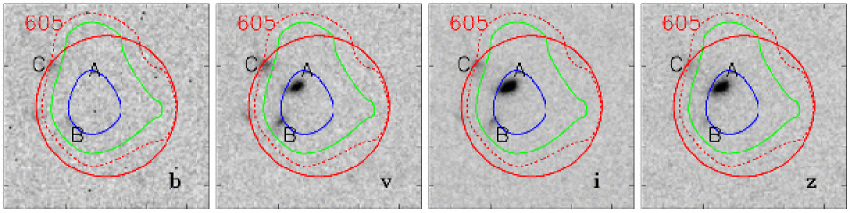
error circle. Finally, for CDFS/XID 605 we find three optical
counterparts ( A, B, C) of which two are extremely faint in all four
bands ( B and C). We have selected from the publicly available
catalogue of the UDF ( h_udf_wfc_V1_cat.txt) source magnitudes in
the four bands for each of the optical counterparts. The magnitudes
available from this catalogue where computed using the i band
isophotes of each source, thereby producing isophotally matched
magnitudes that are suitable to compute colours. Combining these
colours with our near-IR photometry, we estimated photometric
redshifts as decribed in Section 4.2 (Figure
13). We provide individual notes on each source
below.
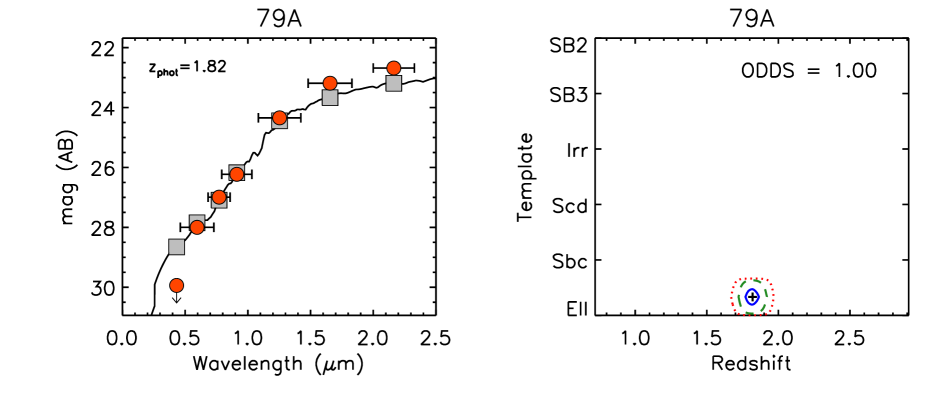
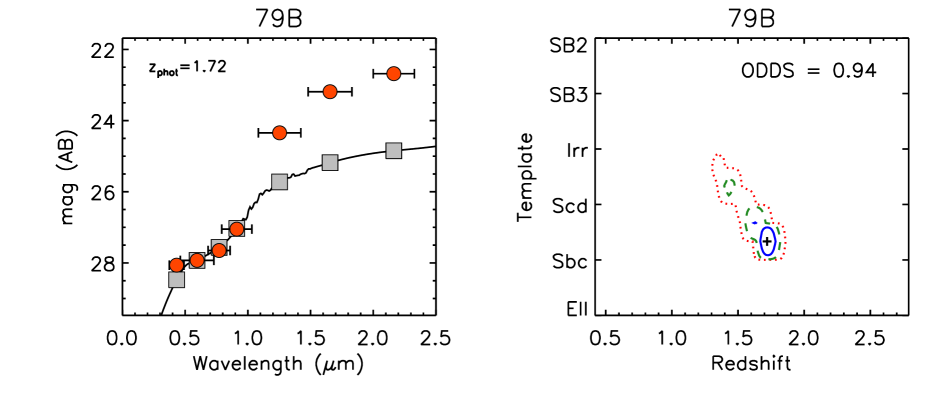
Source CDFS/XID 79: the A counterpart is well fitted with an
early-type SED at redshift z, similar to that
obtained using the GOODS photometry ( see Figure
14). However, we could not obtain a reasonable
fit to source 79B, probably because the near-IR photometry (which does
not resolve the two counterparts) is dominated by 79A.
Source
CDFS/XID 515: we obtain z and the confidence
contours are in good agreement with the value found with the GOODS
photometry ( see Figure 14).
Source CDFS/XID
605: in this case the depth of the UDF data is really a step forward
for the redshift determination. With the GOODS photometry we obtained
a “double” solution with a peak in the probability distribution at
low ( z) and high ( z)
redshift ( see Figure 14). With the UDF data we
have smaller errors on the photometry and can put a more stringent
upper limit in the b band where CDFS/XID 605 is undetected: this
source is now a strong candidate at high redshift with z, with a small uncertainty ().
10 Conclusions
In this paper, we have taken advantage of the unique multi-wavelength
coverage of the GOODS survey in the Chandra Deep Field South to
constrain the nature and redshift distribution of optically faint
X-ray sources (R). It is important to study their properties
since they are a significant fraction () of the whole
X-ray sample.
Our study extends the earlier analysis by Alexandet et
al. (alexander01 (2001)) by determining photometric redshifts for the
optically faint sources without spectroscopic redshifts. The
reliability of these photometric redshifts has been tested against the
spectroscopic redshifts available for the optically faint fources (
see Figure 5). We find that a larger
fraction of the optically faint ( ) sources are at redshift z
compared to the optically bright sample ( ). This finding
reduces the disagreement between the observed redshift distribution in
Chandra deep fields (Barger et al. barger03 (2003), Szokoly et
al. szokoly04 (2004)) and that predicted by XRB models based on the
ROSAT X-ray luminosity function, as the majority of the still
unidentified X-ray sources in these deep fields are optically faint.
However, the redshift distribution that we obtain including our best
photometric redshifts still peaks at z, while the current
XRB models predict z. One solution would involve
implementing a new X-ray luminosity function for AGN in the XRB
synthesis models, by combining Deep Chandra and XMM-Newton
fields with shallower surveys (Gilli et al. gilli03b (2004); Fiore et
al. fiore03 (2003)). This new X-ray luminosity function will be able
to reproduce better the evolution with redshift of Seyfert-like
objects which make a large fraction of the observed peak at
z.
Several diagnostics indicate that the majority of the optically faint sources are absorbed. Their hardness ratio distribution is harder ( significance level) than that of the optically bright sample indicating a large fraction of optically faint fources with a flat X-ray spectrum which implies intrinsic absorption. Their optical/near-IR photometry is dominated by the emission of the host galaxies and their colours are in average redder that the optically bright sources [ are EROs, (R-K) as compared to of the optically bright sources]. We have performed an X-ray spectral analysis and the distribution of NH values shows that of OFS have column densities larger than cm-2 (for optically bright sources the fraction is of ).
We find that of the optically faint X-ray sources are
X-ray absorbed QSOs ( L erg
s-1 and N cm-2). Synthesis models of the
XRB include a significant contribution from X-ray absorbed QSOs
to the hard XRB (i.e. for model B of Gilli, Salvati &
Hasinger gilli01 (2001)). From the CDF-S survey we find a much lower
contribution from obscured QSOs, . This difference can not
be ascribed to the remaining fraction of the as yet unresolved XRB:
both the model and observational values are derived assuming the
HEAO-1 measure of the total flux of the XRB in the keV band
and the hard XRB has been resolved (using the HEAO-1 value) to the
depth of the CDF-S (Rosati et al. rosati02 (2002)).
Our value is in
good agreement with the prediction () based on the recent
model by Ueda et al. (ueda03 (2003)).
Approximatly of the OFS have high X-ray-to-optical ratios (X/O). of them are strongly X-ray absorbed ( N cm-2) and their photometry is well reproduced by the SED of an early-type galaxy with z. The remaining is on average less absorbed ( N cm-2) and has bluer colours reproduced by irregular or starburst galaxies with a mean redshift of . Among this second group we find a candidate at redshift z. Finally, of the sources with high X-ray-to-optical ratios are X-ray absorbed QSOs.
Acknowledgements.
We are grateful to Narciso Benitez for his assistance with BPZ. We thank the referee, B.J. Wilkes, for a very detailed and useful report that improved the manuscript. DMA thanks the Royal Society for financial support. CN gratefully acknowledge support under NASA grants NAG-8-1527 and NAG-8-1133.References
- (1) Alexander, D.M., Brandt, W.N., Hornschemeier, A.E.,et al. 2001, AJ, 122, 2156
- (2) ALexander, D.M., Vignali, C., Bauer, F.E., et al. 2002, AJ, 123, 1149
- (3) Alexander, D.M., Bauer, F.E., Brandt, W.N., et al. 2003, AJ, 126, 539
- (4) Barger, A.J., Cowie, L.L., Trentham, N., et al. 1999, AJ, 117, 102
- (5) Barger, A.J., Cowie, L.L., Capak, P., et al. 2003, AJ, 126, 632
- (6) Benitez, N. 2000, ApJ, 536, 2000
- (7) Bertin, E., & Arnouts, S. 1996, A&A Supplement, 117, 393
- (8) Brandt, W.N., Alexander, D.M., Hornschemeier, A.E., et al. 2001, AJ, 122, 2810
- (9) Coleman, G.D., Wu, C.C., & Weedman, D.W. 1980, ApJS, 43, 393
- (10) De Luca, A., & Molendi, S. 2004, A&A, 419, 837
- (11) Dickinson, M. & Giavalisco, M.: 2002 Proc. of the Workshop, The Mass of Galaxies at Low and High Redshift, eds. R. Bender and A. Renzini, in press [astro-ph/0204213]
- (12) Fernández-Soto, A., Lanzetta, K.M., & Yahil, A. 1999, ApJ, 513, 34
- (13) Fabian, A.C., Smail, I., Iwasawa, K., et al. 2000, 315 , L8
- (14) Fiore, F., Brusa, M., Cocchia, F., et al. 2003, A&A, 409, 79
- (15) Furusawa, H., Shimasaku, K., Doi, M., et al. 2000, ApJ, 534, 624
- (16) Giacconi, R., Gursky, H., Paolini, F.R., Rossi, B.B. 1962, Phys.Rev.Letters, 9, 439
- (17) Giacconi, R., Zirm, A., Wang, J.X., et al. 2002, ApJS, 139, 369
- (18) Giavalisco, M., Ferguson, H.C., Koekemoer, A.M., et al. 2004, ApJL, 600, 93
- (19) Gilli, R., Salvati, M., & Hasinger, G. 2001, A&A, 366, 407
- (20) Gilli, R., Cimatti, A., Daddi, E., et al. 2003, ApJ, 592, 721
- (21) Gilli, R. 2004, Adv. Sp. Res., 34, 2470
- (22) Gonzalez, A.H. & Maccarone, T.J. 2002, ApJ, 581, 155
- (23) Hasinger, G., Altieri, B., Arnaud, M., et al. 2001, A&A 365, L45
- (24) Hasinger, G. 2002, Proceedings of the Symposium ‘New Visions of the X-ray Universe in the XMM-Newton and Chandra Era’, ESA SP-488, ed. F. Jansen, in press, astro-ph/0202430
- (25) Kim, D.W., Wilkes, B.J., Green, P.J., et al. 2004, ApJ, 600, 59
- (26) Kinney, A.L., Calzetti, D., Bohlin, R.C., et al. 1996, ApJ, 467, 38
- (27) Koekemoer, A.M., Alexander, D.M., Bauer, F.E., et al. 2004, ApJL, 600, 123
- (28) Maccacaro, T., Gioia, I.M., Wolter, A., et al. 1988, ApJ, 326, 680
- (29) Mainieri, V., Bergeron, J., Hasinger, G., et al. 2002, A&A, 393, 425
- (30) Marshall, F., et al. 1980, ApJ, 235, 4
- (31) Mignoli, M., Pozzetti, L., Comastri, A., et al. 2004, A&A, accepted (astro-ph/0401298)
- (32) Mobasher, B., Idzi, R., Benitez, N., et al. 2004, ApJL in press
- (33) Revnivtsev, M., Gilfanov, M., Johoda, K., Sunyaev, R. 2004, submitted to A&A [astro-ph/0412304]
- (34) Rosati, P., Tozzi, P., Giacconi, R., et al. 2002, ApJ, 566, 667
- (35) Schlegel, D.J., Finkbeiner D.P., Davis, M. 1998, ApJ, 500, 525
- (36) Szokoly, G.P., Bergeron, J., Hasinger, G., et al. 2004, ApJS, 155, 271
- (37) Tozzi, P., Rosati, P., Nonino, M., et al. 2001, ApJ, 562, 42
- (38) Tozzi, P., Gilli, R., Mainieri, V., et al. 2005, A&A submitted
- (39) Ueda, Y., Akiyama, M., Ohta, K., Miyaji, T. 2003, ApJ, 598, 886
- (40) Vandame, B., Olsen, L.H., Jorgensen, H.E., et al. 2001, astro-ph/0102300
- (41) Vanden Berk, D.E., Richards, G.T., Bauer, A., et al. 2001, AJ, 122, 549
- (42) Vanzella, E., Cristiani, S., Dickinson, M., et al. 2004, submitted to A&A, astro-ph/0406591
- (43) Vecchi, A., Molendi, S., Guainazzi, M., Fiore, F., & Parmar, A.N. 1999, A&A, 349, L73
- (44) Yan, H., Windhorst, R., Röttgering, H., et al. 2003, ApJ, 585, 67
- (45) Zheng, W., Mikles, V.J., Mainieri, V., et al. 2004, ApJS, 155, 73
![[Uncaptioned image]](/html/astro-ph/0502542/assets/x26.png)
![[Uncaptioned image]](/html/astro-ph/0502542/assets/x27.png)
![[Uncaptioned image]](/html/astro-ph/0502542/assets/x28.png)
![[Uncaptioned image]](/html/astro-ph/0502542/assets/x29.png)
![[Uncaptioned image]](/html/astro-ph/0502542/assets/x30.png)
![[Uncaptioned image]](/html/astro-ph/0502542/assets/x31.png)
![[Uncaptioned image]](/html/astro-ph/0502542/assets/x32.png)
![[Uncaptioned image]](/html/astro-ph/0502542/assets/x33.png)
![[Uncaptioned image]](/html/astro-ph/0502542/assets/x34.png)
![[Uncaptioned image]](/html/astro-ph/0502542/assets/x35.png)
![[Uncaptioned image]](/html/astro-ph/0502542/assets/x36.png)
![[Uncaptioned image]](/html/astro-ph/0502542/assets/x37.png)
![[Uncaptioned image]](/html/astro-ph/0502542/assets/x38.png)
![[Uncaptioned image]](/html/astro-ph/0502542/assets/x39.png)
![[Uncaptioned image]](/html/astro-ph/0502542/assets/x40.png)
![[Uncaptioned image]](/html/astro-ph/0502542/assets/x41.png)
![[Uncaptioned image]](/html/astro-ph/0502542/assets/x42.png)
![[Uncaptioned image]](/html/astro-ph/0502542/assets/x43.png)
![[Uncaptioned image]](/html/astro-ph/0502542/assets/x44.png)
![[Uncaptioned image]](/html/astro-ph/0502542/assets/x45.png)
![[Uncaptioned image]](/html/astro-ph/0502542/assets/x46.png)
![[Uncaptioned image]](/html/astro-ph/0502542/assets/x47.png)
![[Uncaptioned image]](/html/astro-ph/0502542/assets/x48.png)
![[Uncaptioned image]](/html/astro-ph/0502542/assets/x49.png)
![[Uncaptioned image]](/html/astro-ph/0502542/assets/x50.png)
![[Uncaptioned image]](/html/astro-ph/0502542/assets/x51.png)
![[Uncaptioned image]](/html/astro-ph/0502542/assets/x52.png)
![[Uncaptioned image]](/html/astro-ph/0502542/assets/x53.png)
![[Uncaptioned image]](/html/astro-ph/0502542/assets/x54.png)
![[Uncaptioned image]](/html/astro-ph/0502542/assets/x55.png)
![[Uncaptioned image]](/html/astro-ph/0502542/assets/x56.png)
![[Uncaptioned image]](/html/astro-ph/0502542/assets/x57.png)
![[Uncaptioned image]](/html/astro-ph/0502542/assets/x58.png)
![[Uncaptioned image]](/html/astro-ph/0502542/assets/x59.png)
![[Uncaptioned image]](/html/astro-ph/0502542/assets/x60.png)