VPMS J1342+2840 – an unusual quasar from the variability and proper motion survey
We report the discovery of the highly peculiar, radio-loud quasar VPMS J1342+2840 (1.3) from the variability and proper motion survey. We present spectroscopic, imaging and photometric observations. The unusual spectrum shows a strong depression of the continuum over a wide wavelength range in the blue part without the typical structures of broad absorption line (BAL) troughs. The image of the quasar is unresolved and there is no evidence for a foreground object on the line of sight. The broad-band spectral energy distribution is not consistent with obvious dust reddening with the standard SMC extinction curve. The downturn of the continuum flux of VPMS J1342+2840 at short wavelengths can be caused by dust reddening only if the reddening curve is steeper then the SMC curve in the ultraviolet and is very flat at longer wavelengths. Alternatively, the dominant spectral features can be explained by low-ionization BALs forming unusually wide, overlapping absorption troughs.
Key Words.:
quasars: absorption lines – quasars: individual: VPMS J1342+28401 Introduction
An important class of active galactic nuclei are quasars with broad absorption lines (BAL), usually subdivided into low- and high-ionization (LoBAL, HiBAL) quasars. BAL quasars constitute about 15% of the quasar population (Reichard et al. Rei03 (2003)) and only about 10% of the BAL quasars are LoBALs. A rare subclass of the LoBALs are the iron LoBALs (FeLoBALs) with absorption from metastable excited states of Fe II and Fe III (Hazard et al. Haz87 (1987)). BALs are naturally explained by powerful, non-isotropic, subrelativistic outflows (Weymann et al. Wey91 (1991)), possibly related to disk winds (Murray & Chiang Mur98 (1998)). LoBALs probably have higher gas column densities and at least some LoBAL quasars are thus expected to represent either young systems expelling a thick shroud of gas and dust (Voit et al. Voi93 (1993); Canalizo & Stockton Can01 (2001)) or a transition stage between radio-loud and radio-quiet BAL quasars (Becker et al. Bec97 (1997)).
Quasars with unconventional spectra are obviously overlooked in quasar surveys based on optical/UV colour or objective prism selection. They are also under-represented in radio surveys with high flux density limits because only a small percentage seems to be radio-loud. Unusual BAL quasars from the Sloan Digital Sky Survey (SDSS) First Data Release were analyzed in detail by Hall et al. (Hal02 (2002); hereafter H02) and the most unconventional quasars from the SDSS Second Data Release were presented by Hall et al. (Hal04a (2004)a). Menou et al. (Men01 (2001)) discuss SDSS BAL quasars with radio detection in the VLA FIRST survey. Other quasars with unconventional spectra, e.g. unusual reddening in the UV (Hines Hin01 (2001)) or without obvious metal-line emission (Hall et al. Hal04b (2004)b), have been the subject of a variety of studies. The data base is clearly growing, nevertheless every single odd quasar is an interesting object that may hold clues to various open questions of the structure and the evolution of quasars. Here, we present one of the most unusual quasars from the variability and proper motion survey (VPMS). The VPMS is an optical quasar search project based upon long-term variability and zero proper motion (Scholz et al. Sch97 (1997); Meusinger et al. Meu02 (2002), Meu03 (2003)). The quasar selection does not explicitly make use of assumptions on the spectral energy distribution (SED) of quasars and thus the VPMS is expected to be less biased against quasars with unusual SEDs than more conventional optical quasar surveys.
2 Spectroscopy and imaging
VPMS J1342+2840 ( +28, J2000.0) is a faint () VPMS quasar, discovered during regular spectroscopic follow-up observations of high-priority quasar candidates in spring 2003. Subsequently, several spectra of moderately higher resolution were taken with CAFOS at the 2.2 m telescope on Calar Alto, Spain, and with DOLORES at the 3.6 m Telescopio Nazionale Galileo (TNG) on the island of La Palma, Spain, respectively (Table 1). All observations were done in good atmospheric conditions. The spectra were reduced using the optimal extraction algorithm of Horne (Hor86 (1986)).
| instrument | grism | range | FWHM | epoch | |
|---|---|---|---|---|---|
| (Å) | (Å) | (ks) | (year) | ||
| CAFOS | B400 | 3 600-8 000 | 34 | 3.9 | 2003.3 |
| CAFOS | R200 | 6 300-11 000 | 19 | 1.2 | 2003.6 |
| CAFOS | G200 | 5 200-9 000 | 15 | 5.4 | 2004.6 |
| DOLORES | LR-B | 3 600-8 000 | 22 | 1.8 | 2004.7 |
| DOLORES | LR-R | 5 200-9 000 | 15 | 1.2 | 2004.7 |
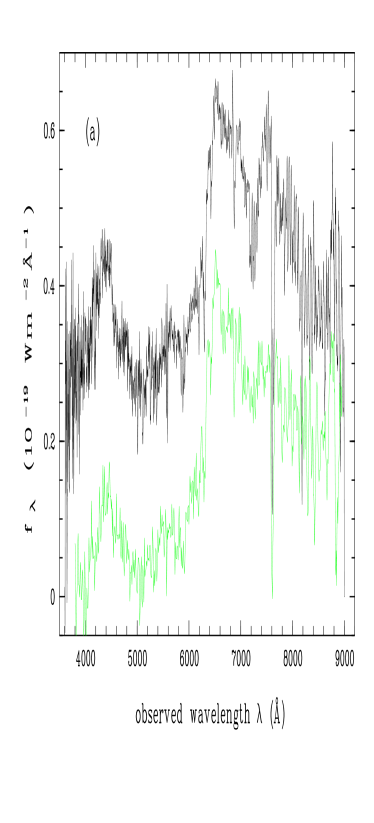
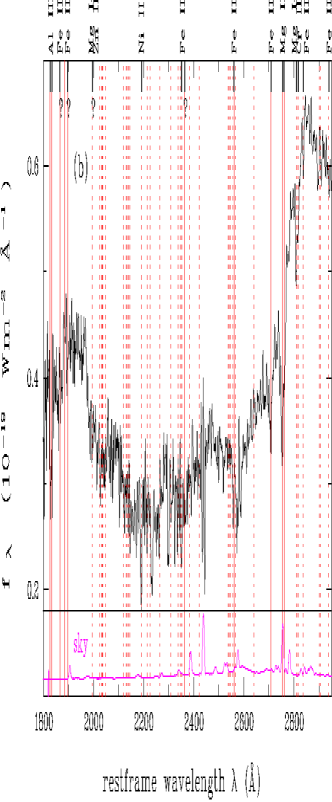
With its strong depression of the continuum over the whole wavelength interval shortward of 6500Å (Fig. 1a), the spectrum of VPMS J1342+2840 is remarkably different from the typical quasar spectrum (see Fig. 3a). It is tempting to interpret this depression as due to strong absorption from a blend of iron lines in the spectral region 2300-3050Å and to identify the bump at 4400 Å with emission from C III] corresponding to an (uncertain) systemic redshift of 1.288 (i.e., , after correction for absorption). This interpretation is supported by the identification of several narrow absorption lines (Fig. 1b) at =1.2535, most notably Al III 1860, Ni II(UV12,UV13) 2225, Fe II(UV1) 2600, Fe II(UV62,UV63) 2750, Mg II 2800, Mg I 2853, Fe II(UV61) 2880. The Fe II 2750 line seems to be unphysically strong compared to the iron lines at 2400 and 2600 Å. The comparison with the CAFOS G200 spectrum shows that the line is possibly slightly enhanced by noise in the TNG spectrum. Nevertheless, the detection of Fe II lines is beyond doubt. There might be also other absorption line systems at slightly different redshifts, yet evidence for them is not as clear as for the =1.2535 system. The abrupt drop-off in flux near Mg ii 2800 is of course not explained by one narrow-line system. Such a drop-off is known from several FeLoBAL quasars. However, there are no obvious BAL troughs in VPMS J1342+2840. In this respect, VPMS J1342+2840 resembles SDSS J0105-0033 and SDSS J2204+0031, which were classified by H02 as “mysterious objects”.
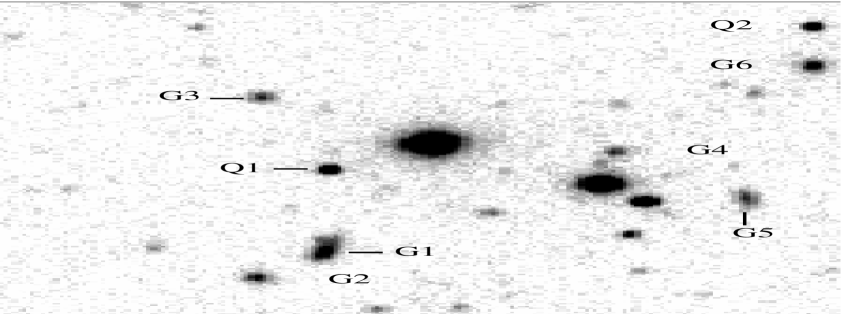
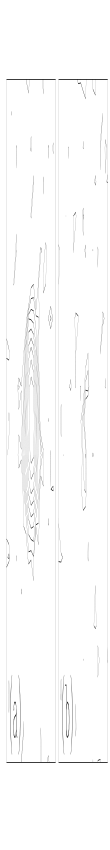
Unusual spectral properties can be the result of a positional coincidence with a foreground object in combination with gravitational lensing (Irwin et al. Irw98 (1998); Chartas Cha00 (2000)). A deep (23) R band image taken with CAFOS (Fig. 2) reveals several faint galaxies within and faint, fuzzy structures within . Granted that the faintest structures are associated with the quasar environment, their absolute magnitudes would be , i.e. 2…3.5 mag brighter than the Schechter magnitude (e.g., Gaidos Gai97 (1997); Chen et al. Che03 (2003); Christlein & Zabludoff Chr03 (2003); =65 km s-1 Mpc=0.5, =0). Such bright galaxies are extremely rare and thus we conclude that the “fuzz” is more likely to represent foreground galaxies. For the galaxy G1 we measured a spectroscopic redshift of =0.142. However, there is no indication for foreground absorption at this redshift in the spectrum of VPMS J1342+2840. Furthermore, the image of VPMS J1342+2840 is unresolved; there is no indication for a superposition with another object (see inset of Fig.2). The faint residuals in the PSF-subtracted image are comparable with the residuals typically found for the PSF-stars. Finally, the photometric variability of VPMS J1342+2840 (see below) is common in quasars but is inexplicable for a lensed background galaxy.
3 Broad-band spectral energy distribution
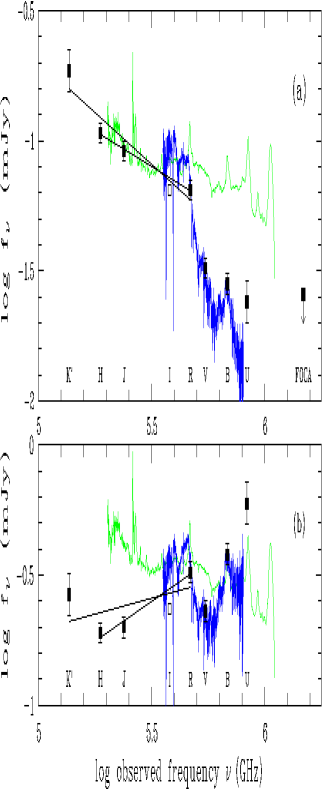
To study the SED over a broader spectral range we consider photometric data from several bands: photometry in the JHK′ bands was performed with MAGIC at the 2.2 m telescope on Calar Alto. BVR magnitudes are from images taken with CAFOS at the same telescope. The U magnitude comes from the VPMS measurements on Schmidt plates taken later than 1990 (see below). The field has been observed with the balloon-borne ultraviolet imaging telescope FOCA (Laget et al. Lag92 (1991)) at 2000 Å; the flux limit at half completeness is 0.026 mJy. As expected, there is no significant detection of VPMS J1342+2840 since the Lyman limit comes close to the FOCA band for . Finally, an I magnitude, without error bar, is available from the USNO-B1.0 catalogue (Monet et al. Mon03 (2003)) measured on a POSS II iv-N plate taken in 1997.
The resulting broad-band SED is shown in Fig. 3a. The uncertainty due to variability is expected to be small. However, we caution that changes in flux cannot be ruled out. The B band lightcurve from the VPMS data shows a dimming by 0.8 mag between 1970 and 1990 but only small fluctuations between 1990 and 2003. A similar behaviour is indicated by the UVR data. (The dimming is stronger at shorter wavelengths, as is typical for quasars, cf. Trévese et al. Tre01 (2001)). Fig. 3 reflects the depression of the continuum seen in Fig.1 a. We restrict the power-law approximation to Å (observed) and find = from the linear regression of the K′HJR magnitudes. If we exclude the K′ data point (it is not clear whether the turnup at 2.2 m is real), the fit is considerably improved and the slope = comes close to the slope of the composite spectrum from all VPMS quasars.
We found a positionally coincident ( 1″) radio source on the image cutout from the NRAO Very Large Array FIRST survey (Becker et al. Bec95 (1995)) with a peak flux density of 0.7 mJy and an integrated flux density of 2.3 mJy at 1.4 GHz. The source is not listed in the FIRST catalogues because of the hard detection limit of 1 mJy, which applies to the peak flux density rather than to the integrated flux density. In the NRAO 1.4 GHz VLA Sky Survey (NVSS; Condon et al. Con98 (1998)), a source with a peak flux density of 1.6 mJy is seen at a distance of 5″. According to NED111The NASA/IPAC Extragalactic Database is operated by the Jet Propulsion Laboratory, California Institute of Technology, under contract to NASA., VPMS J1342+2840 is not detected at other radio bands; thus the radio spectral index is not available. We use the K-corrected ratio of the 5 GHz radio flux density to the 2500 Å optical flux density in the quasar rest frame as a measure of radio-loudness. Using the standard definition with = and = (Stocke et al. Sto92 (1992)), we find =. If we consider that (a) the observed flux at 2500 Å (rest frame) is reduced and (b) = or (Fig. 3a), we get = or 1.56, respectively, for the FIRST radio flux. With = (White et al. Whi00 (2000)), the corresponding values are = and 1.60. Adopting a divide between radio-quiet and radio-loud quasars at 1 (e.g., Stocke et al. Sto92 (1992)), VPMS J1342+2840 has to be classified as radio-loud.
4 Discussion
Is the peculiar spectrum of VPMS J1342+2840 due to strong dust extinction? The reddening associated with mildly obscured quasars has typically been found to be consistent with that of the Small Magellanic Cloud (SMC; Hopkins et al. Hop04 (2004)). On the other hand, Gaskell et al (Gas04 (2004)) argue that most quasars are affected by extinction with a reddening curve which is distinct from the SMC-curve. To de-redden the spectrum of VPMS J1342+2840 we adopt three different reddening curves: (a) SMC-like, (b) relation from Gaskell et al., (c) Galactic curve. The colour excess is used as a free parameter to fit the blue end of the corrected TNG spectrum to the composite spectrum from all VPMS quasars which was normalized before to the red end of the corrected TNG spectrum. For SMC-like reddening, the de-reddened blue (2000 Å) end of the corrected continuum matches the mean quasar spectrum for 0.3 (Fig. 3b). However, there is a strong discrepancy in the intermediate part of the spectrum (2000 to 2800 Å rest frame). Moreover, the de-reddened broad-band SED has a very untypical shape and does not fit the mean quasar spectrum over a broader spectral range. The fit is even worse for Galactic extinction with its 2175Å bump and it is much worse for the curve from Gaskell et al. which is too flat at short wavelengths. Given that the slope of the red and near-IR part of the uncorrected broad-band SED is well matched by the usual power-law, we conclude that dust can be a major reason for the peculiar spectrum of VPMS J1342+2840 only for an unusual extinction curve which must be very flat at 2900Å and steeply rising at shorter wavelengths. Stronger than SMC-like reddening in the UV has been suggested by H02. Hines et al. (Hin01 (2001)) argue that the downturn at 2500Å in the spectra of two IRAS quasars might be produced by dusty scattering.
Another likely explanation for the depression at Å (rest frame) are wide, overlapping BAL troughs. Such an interpretation requires absorption that increases in strength when BALs overlap. This problem has been discussed at length by H02 in the context of the two “mysterious objects” SDSS J0105-0033 and SDSS J2204+0031. These authors argue that barely plausible fits can be achieved with wide troughs detached by 12 000 km s-1 if there is partial covering of different regions of the continuum source as a function of velocity. Partial covering seems not implausible for VPMS J1342+2840: it is known that absorption in BAL outflows is saturated, even though the troughs rarely reach zero flux. This nonblack saturation can be due to scattered light that bypasses the absorbing region or due to partial covering of the continuum source (Arav et al. Ara99 (1999)). Because of the strong variability on timescales of a few years it seems unlikely that the observed blue continuum of VPMS J1342+2840 is dominated by scattered light. Following H02, the only object known to definitely exhibit spatially distinct velocity-dependent partial covering is FBQS 1408+3054. If our interpretation is true, VPMS J1342+2840 would be another representative of these extremely rare objects. Moreover, it is tempting to speculate that VPMS J1342+2840 is a “missing link” (perhaps transitional) between FBQS 1408+3054 and the “mysterious” SDSS quasars.
5 Conclusion
VPMS J1342+2840 is an unresolved radio-loud quasar at 1.3 with a very peculiar spectrum. Both the optical spectrum and the broad-band SED are not consistent with obvious reddening by SMC-like dust. Either the reddening curve is (a) much steeper between 2000 and 2900Å and (b) flat at longer wavelengths, or the absorption comes from unusual BAL features dominated by wide, overlapping troughs with velocity-dependent partial covering of the central source. The dusty scattering hypothesis can be tested by spectropolarimetry (e.g. Hines et al. Hin01 (2001)). With its high variability index VPMS J1342+2840 is one of the highest priority quasar candidates at the faint end of the VPMS. Obviously, the VPMS provides a useful tool for the detection of unconventional quasars.
Acknowledgements.
We are grateful to the anonymous referee and to Patrick Hall for helpful comments. This research is based on observations made with the Italian Telescopio Nazionale Galileo (TNG) operated on the island of La Palma by the Centro Galileo Galilei of the INAF (Istituto Nazionale di Astrofisica) at the Spanish Observatorio del Roque de los Muchachos of the Instituto de Astrofisica de Canarias and with the 2.2 m telescope of the German-Spanish Astronomical Centre, Calar Alto, Spain. We acknowledge the staff members of these telescopes for their kind assistance. HM acknowledges financial support from the European Optical Infrared Coordination Network for Astronomy, OPTICON, and from the Deutsche Forschungsgemeinschaft under grants Me1350/17-1 and Me1350/18-1. DF received funding by the Cosmo Grid project, funded by the Irish Higher Education Authority. MH thanks for grants from the Nordrhein-Westfälische Akademie der Wissenschaften.References
- (1) Arav, N., Becker, R. H., Laurent-Muehleisen, S. A., et al., 1999, ApJ 524, 566
- (2) Becker, R. H., White, R. L., Helfand, D. J., 1995, ApJ 450, 559
- (3) Becker, R. H., Gregg, M. D., Hook, I. M., et al., 1997, ApJ 479, L93
- (4) Canalizo, G. & Stockton, A., 2001, ApJ 555, 719
- (5) Chartas, G., 2000, ApJ 531, 81
- (6) Chen, H.-W., Marzke, R., McCarthy, P., et al., 2003, ApJ 586, 745
- (7) Christlein, D. & Zabludoff, A., 2003, AJ 591, 764
- (8) Condon, J. J., Cotton, W. D., Greisen, E. W., et al., 1998, AJ 115, 1693
- (9) Gaidos, E. J., 1997, AJ 113, 117
- (10) Gaskell, C., Goosmann, R., Antonucci, R., et al., 2004, ApJ 616, 147
- (11) Hall, P., Anderson, S., Strauss, M., et al., 2002, ApJS 141, 267 (H02)
- (12) Hall, P., Knapp, G. R., Richards, G. T., et al., 2004a, astro-ph/0403347
- (13) Hall, P., Hoversten E., Tremonti, C., et al., 2004b, AJ 127, 3146
- (14) Hazard, C., McMahon, R. G., Webb, J. K., et al., 1987, ApJ 323, 263
- (15) Hines, D. C., Schmidt G. D., Gordon, K. D., et al., 2001, ApJ 563, 512
- (16) Hopkins, P. F., Strauss, M. A., Hall, P. B., et al., 2004, AJ 128, 1112
- (17) Horne, K., 1986, PASP 98, 609
- (18) Irwin, M. J., Ibata, R. A., Lewis, G. F., et al., 1998, ApJ 505, 529
- (19) Laget, M., Burgarella, D., Milliard, B., et al., 1992, A&A 259, 510
- (20) Menou, K., Vanden Berk, D. E., Ivezić, Ž., et al. 2001, ApJ 561, 645
- (21) Meusinger, H., Scholz, R.-D., Irwin, M., et al., 2002, A&A 392, 851
- (22) Meusinger, H., Brunzendorf, J., Laget, M., 2003, Astron. Nachr. 324, 474
- (23) Monet, D. G., Levine, S. E., Casian, B., et al., 2003, AJ 125, 984
- (24) Murray, N. & Chiang, J., 1998, ApJ 494, 125
- (25) Pei, Y. C., 1992, ApJ 395, 130
- (26) Reichard, T. A., Richards, G. T., Hall, P. B., et al., 2003, AJ, 126, 2594
- (27) Richards, G. T., Hall, P. B., Vanden Berk, D. E., 2003, AJ 126, 1131
- (28) Schlegel, D., Finkbeiner, D., Davis, M., 1998, ApJ 500, 525
- (29) Scholz, R.-D., Meusinger, H., Irwin, M., 1997, A&A 325, 457
- (30) Stocke, J. T., Morris, S. L., Weymann, R. J., et al., 1992, ApJ 396, 487
- (31) Trévese, D., Kron R. G., Bunone, A. 2001, ApJ 551, 103
- (32) Voit, G. M., Weymann, R. J., Korista, K. T., 1993, ApJ 413, 95
- (33) Weymann, R. J., Morris, S. L., Foltz, C. B., et al., 1991, ApJ 373, 23
- (34) White, R. L., Becker, R. H., Gregg, M. D., et al., 2000, ApJS 126, 133