HCN and HC Observations of the Galactic Circumnuclear Disk
Abstract
We present high spatial resolution (5.1″ 2.7″) Owens Valley Radio Observatory (OVRO) millimeter array observations of HCN (J=1-0) and HC (J=1-0) emission in the inner 3 pc of the Galaxy (0.04 pc 1″). The HCN and HC emission of the Circumnuclear Disk (CND) is distributed in a well-defined ring with a peak at a radius of 1.6 pc. The observed radial velocities are generally consistent with rotation at km (except along the western edge of the CND). The HC/HCN emission ratio is typically 0.4 but with significant variations. The variations in the HC/HCN emission and absorption ratios can be attributed to greater abundances of HC in lower density regions both within the CND and along the line-of-sight. The HCN emission is well correlated with the H2 emission at 2.12 m both in the main emission lobes of the CND and also in four H2 and HCN filaments. Multiple areas of interaction between the ionized gas and the CND are also seen – the western arm of the minispiral is spatially and kinematically consistent with being the ionized inner edge of the CND, and the northern arm may be connected to the CND northeast extension.
With the enhanced spatial resolution of the HCN maps, we resolve numerous dense molecular gas cores within the CND with characteristic diameter (0.25 pc). For 26 of the more isolated cores, we have measured sizes, velocity widths, and integrated fluxes. From these properties we estimated 3 masses for each core: a virial mass assuming the cores are gravitationally bound, an optically thick mass from observed column densities of HCN, and a lower limit mass assuming the HCN emission is optically thin and shock-excitation is negligible. The virial and optically thick masses are in good agreement with a typical mass of (2-3) and a total CND gas mass of 106 . The internal densities implied by these core masses (assuming a uniform density distribution for each core) are on average (3-4). The core densities are high enough to be stable against tidal disruption from and the central stellar concentration. This tidal stability suggests a longer lifetime for the CND. The high densities and masses within the cores might support star formation either in the CND itself or within a core infalling towards the inner parsec, thus providing a mechanism for the formation of the young stellar population observed in the inner arcseconds of the galaxy.
1 Introduction
At a distance of only 8 kpc (Reid, 1993), the Galactic Center presents a unique opportunity to study in exquisite detail a supermassive black hole and its interactions with the surrounding medium. Extensive observations of the inner 3 parsecs of the Galaxy have revealed an extremely complicated, highly interacting region. Found within these inner parsecs are: a black hole (Ghez et al., 2005) coincident with the non-thermal radio source (Backer & Sramek, 1999; Reid et al., 1999); a dense stellar population, including a central cluster of bright, young (less than a few Myr) emission-line stars (Morris & Serabyn, 1996; Krabbe et al., 1995); X-ray emission, both in hundreds of point sources and in diffuse emission (Muno et al., 2003); streamers of ionized gas and dust, dubbed the “minispiral” (Ekers et al., 1983; Lo & Claussen, 1983; Lacy et al., 1991; Scoville et al., 2003); and a clumped ring of molecular gas, the Circumnuclear Disk (CND), surrounding , the minispiral, and the central star cluster (e.g. Becklin et al., 1982; Guesten et al., 1987; Wright et al., 2001).
The CND was first detected by Becklin et al. (1982) as double-lobed emission at and ; it has subsequently been observed extensively at radio to infrared wavelengths (see Vollmer & Duschl (2001)). These observations indicate that the CND is a ring-like structure of molecular gas and dust with an inclination of and a position angle of (Jackson et al., 1993). The ring is nearly complete in HCN but has noticeable gaps, especially to the north (Wright et al., 2001). The inner radius of the CND is well-defined at pc (deprojected). Early single dish observations traced HCN, CO, and HC out to more than 7 pc (Genzel et al., 1985; Lugten et al., 1986; Serabyn et al., 1986; Guesten et al., 1987), but a recent interferometric study suggests an outer edge at 3 - 4 pc (Wright et al., 2001). The CND has a thickness of pc at the inner edge (Guesten et al., 1987; Jackson et al., 1993) and may expand to 2 pc at larger distances from (Vollmer & Duschl, 2001). CND kinematics are consistent with rotation at 110 km (Marr et al., 1993) with deviations in some regions, most notably to the west. These deviations are consistent with a warped disk created from the collision of two large clouds (Guesten et al., 1987) or a ring of multiple dynamically distinct streamers (Jackson et al., 1993).
To understand the behavior of the CND in the complexity of the Galactic Center, and in particular to evaluate its stability, lifetime, and potential for star formation, it is critical to constrain the physical conditions of the CND molecular gas. Previous observations have found a total mass within the CND of only M⊙ (Genzel et al., 1985) and indicated densities of - (Marr et al., 1993). These densities are sufficiently low that the gas cores would be unstable to tidal disruption from and the central stellar population. However, Jackson et al. (1993) calculate densities within the CND cores of 106 - from models of the HCN emission, noting that such densities would significantly increase the expected core lifetime. They do point out that modeling of other molecular and atomic tracers yields lower densities in keeping with the values of Marr et al. (1993). Here we present new observations of the CND in HCN (J=1-0) and HC (J=1-0) at a resolution of 5.1″ 2.7″, a factor of 2-3 gain in spatial resolution over previous studies. With this enhanced resolution, we resolve substantial core structure within the CND and calculate typical core densities of - , in agreement with the results of Jackson et al. (1993). In addition,, we measure typical gas core masses of a few M⊙, larger than previous estimates.
2 Observations
The observations described here were taken from 1999 November to 2000 April at the Owens Valley Radio Observatory (OVRO) millimeter array. We obtained 10 tracks in four configurations (Table 1), resulting in a naturally-weighted synthesized beam FWHM of . The observations used a 10 pointing mosaic to cover a () region centered on . Because of the low declination (-29°) of , each track was only 3-4 hr in length. In total, 115 minutes were spent on each pointing during the observations, resulting in a noise rms of in each 6.7 km spectral channel and in the 1 GHz wide continuum band.
We simultaneously imaged the HCN (J=1-0) and HC (J=1-0) transitions in the upper sideband at 88.63 and 89.19 GHz, respectively. HCN (J=1-0) and HC (J=1-0) are both tracers of high density (- ) molecular gas and are therefore ideal molecules for probing the dense CND cores. Each line was observed in 64 channels of 2 MHz (6.8 km ) width centered on V km . The total velocity range was -213 to 206 km , easily covering the -150 to 150 km region where emission was detected in previous observations.
In addition, we obtained a single track in the L configuration of the H13CN line at 86.34 GHz. We observed the two pointings covering the northeastern and southwestern emission lobes of the CND and used these observations to estimate the HCN optical depth () for the CND (§4.2.2).
A bright quasar was observed twice in each track for passband and flux calibration. The quasar fluxes, derived from comparisons with observations of Uranus and Neptune in nearby tracks, varied slowly over the six months of the observation by as much as 20% (Table 1), but this variation was accounted for in the individual flux calibration of each track. We estimate a total uncertainty in the flux measurements of 10%. NRAO 530 was observed every 15 minutes for gain calibration, and based on the NRAO 530 observations, periods of low coherence on each baseline were removed. All of the calibration and editing was done with MMA (Scoville et al., 1993), while all cleaning and mapping used the Miriad software package (Sault et al., 1995).
The dominant noise in these interferometer images is misplaced flux of bright emission peaks resulting from residual atmospheric and instrumental phase fluctuations. Using the strong signal from the continuum source and the closure phase relationship (see Cornwell & Wilkinson (1981)), the random phase fluctuations are corrected. Such iterative phase self-calibration was performed on the five pointings containing in the primary beam (diameter for 89 GHz) using line free channels to produce the continuum model by cleaning down to the first negative clean component. The continuum model is dominated by point source emission from . The typical time interval for self-calibration was 30 minutes, corresponding to the period between repetitions of the same map position. The self-calibration reduced the noise in the images by 20 - 30 and increased the total recovered flux for by 50%. Since the self-calibration was based on line-free channels and contained only in the model, the CND emission line fluxes were increased negligibly by the self-calibration (typically by only 5% with a maximum increase of 15%). As noted above, the self-calibration was used to reduced the noise due to mis-calibrated and/or scattered flux of . Therefore, the lack of self-calibration on the five positions at the northern and southern edges of the field without in the primary beam did not significantly affect our determination of the CND line flux.
The 10 pointings were mosaicked in the UV plane using the Miriad invert command with the “systemp” option, which gives low statistical weights to visibilities with high system temperatures. The maps were cleaned to a 1.5 level in each individual channel using Miriad routine mossdi2, which is designed for mosaicked observations and cleans to a given level of the theoretical noise at each point in a mosaic rather than to a set flux level. We then subtracted the 85.91 GHz continuum map (Fig. 1) in the image plane from each channel map to produce the line emission maps.
3 Results
3.1 Continuum Observations
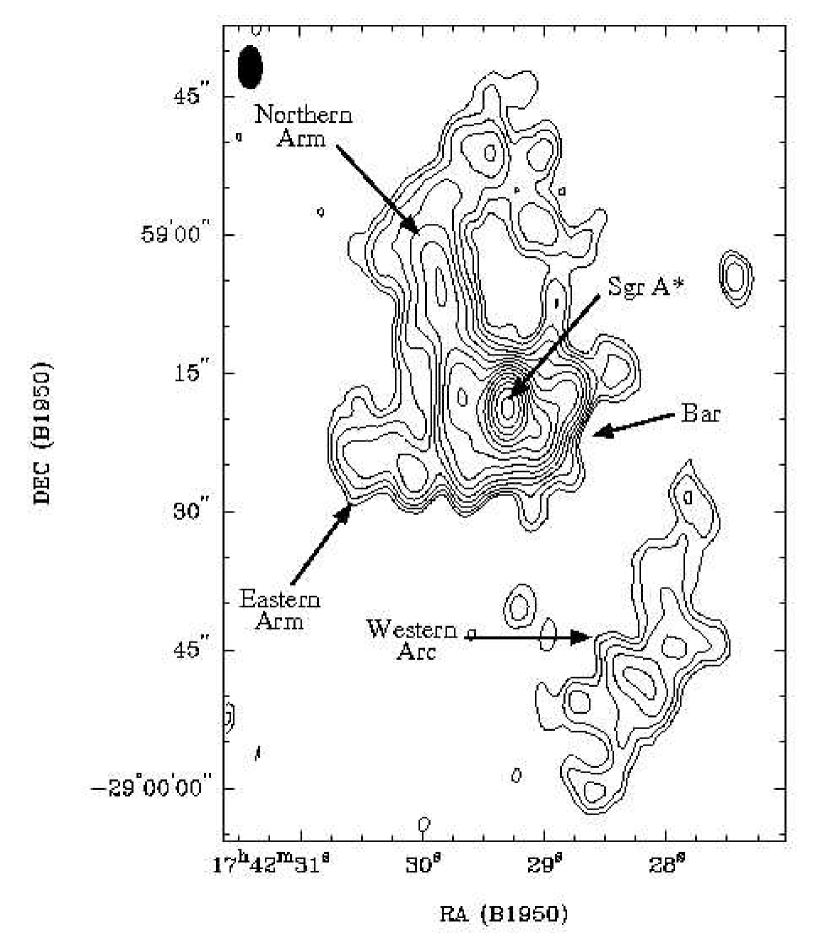
The 85.9 GHz continuum map (Fig. 1) traces the ionized thermal emission of the minispiral and the non-thermal emission of . We adopt a location for at the peak of the 85.9 GHz continuum emission (17:42:29.3, -28:59:18.7, B1950). All the features of the minispiral are detected at level and are labeled in the figure. The peak continuum emission is 1.6 Jy in the beam. Wright et al. (2001) measure a peak flux of 2.14 Jy for a beam. Convolving our observations to match their resolution, we obtain a peak flux of 2.02 Jy , consistent with their results. For an aperture of 30″ radius centered on , our map contains 5.38 Jy of continuum emission, compared with 8.9 Jy from Wright et al. (2001). This difference is likely due to the shorter baselines available in the Berkeley-Illinois-Maryland Association (BIMA) data, which enable detection of a greater fraction of the spatially extended components of the thermal emission. Tracing recovered flux as a function of distance from , we find very little additional flux recovered in apertures larger than 30-40″. Nobeyama 45-m single dish observations (Tsuboi et al., 1988), free of the missing short spacings problem, likewise observe little emission beyond a 30-40″ radius from and measure 27 Jy within 60 of (Wright & Backer, 1993), compared with Jy from our observations, suggesting we recover 20% of the total 3mm continuum flux.
3.2 Line-of-sight Absorption
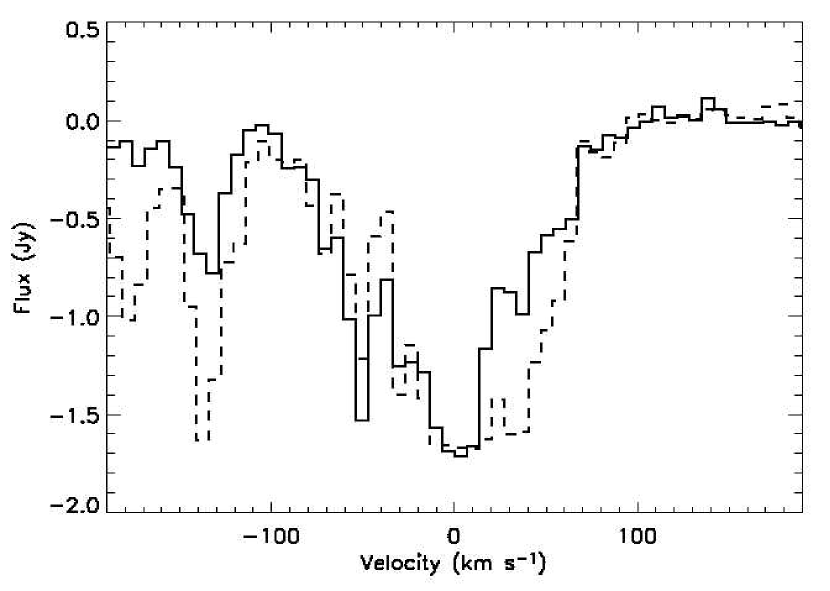
Absorption by molecular gas along the line of sight to the Galactic Center can significantly effect the observed HCN and HC emission at some velocities. Figure 2 shows HCN and HC spectra extracted from a 4″ diameter region centered on . Both spectra show broad absorption from -80 to +70 km from Galactic center gas and narrower absorption features at -135, -50, and -30 km due to foreground Galactic arms at radii of 250 pc (Scoville, 1972; Liszt & Burton, 1978; Bieging et al., 1980), 3 kpc (Oort, 1977), and 4 kpc (Menon & Ciotti, 1970) respectively.
Although the velocities of the HCN and HC absorption features are generally similar, the HC absorption is deeper than that of the HCN at -135 and 20 - 40 km . These deeper HC features suggest regions of lower density gas along the line of sight where the fractional abundance of HC has been enhanced because of deeper penetration by cosmic rays (Marr et al., 1993).
3.3 HCN and HC Emission from the CND
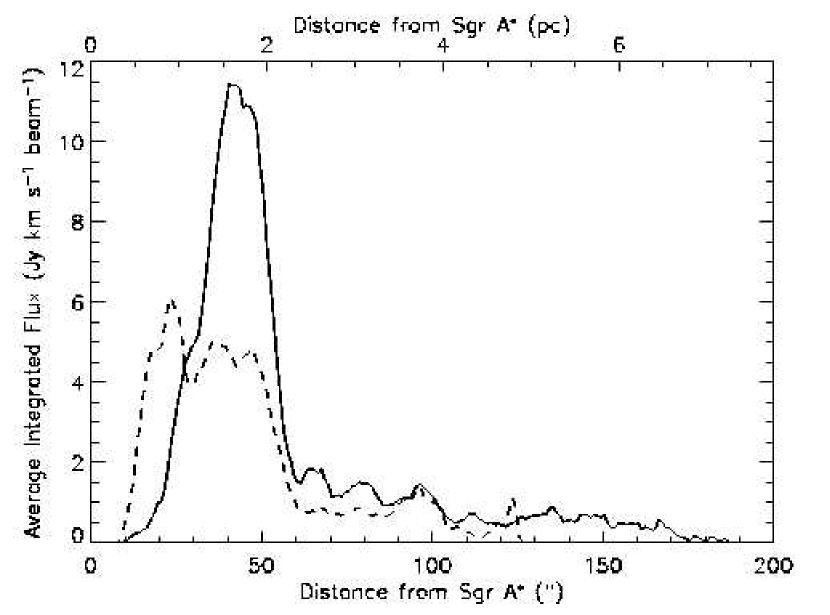
The integrated HCN and HC intensity maps (Figs. 3 and 4) clearly show a ring-like CND with a gap in emission to the north of and reduced emission to the east. The overall CND gas distribution is similar to that seen in previous imaging, but these observations detect more significant emission to the east of and because of the enhanced spatial resolution reveal much greater internal structure within the CND ring. The HCN flux is on average 2 - 3 times the HC flux (see §3.4). The CND flux distribution as a function of distance from (deprojected assuming an inclination angle of 60°) has a sharp inner edge at 40 (1.6 pc), an equally steep decline around 50 (2.0 pc), followed by a slowly declining, non-zero flux out past 150 (Fig. 5). The sharp inner and outer edges strongly suggest the CND has a ring-like morphology (Wright et al., 2001). Despite its ring-like nature, we nevertheless maintain the traditional nomenclature of circumnuclear disk (CND).
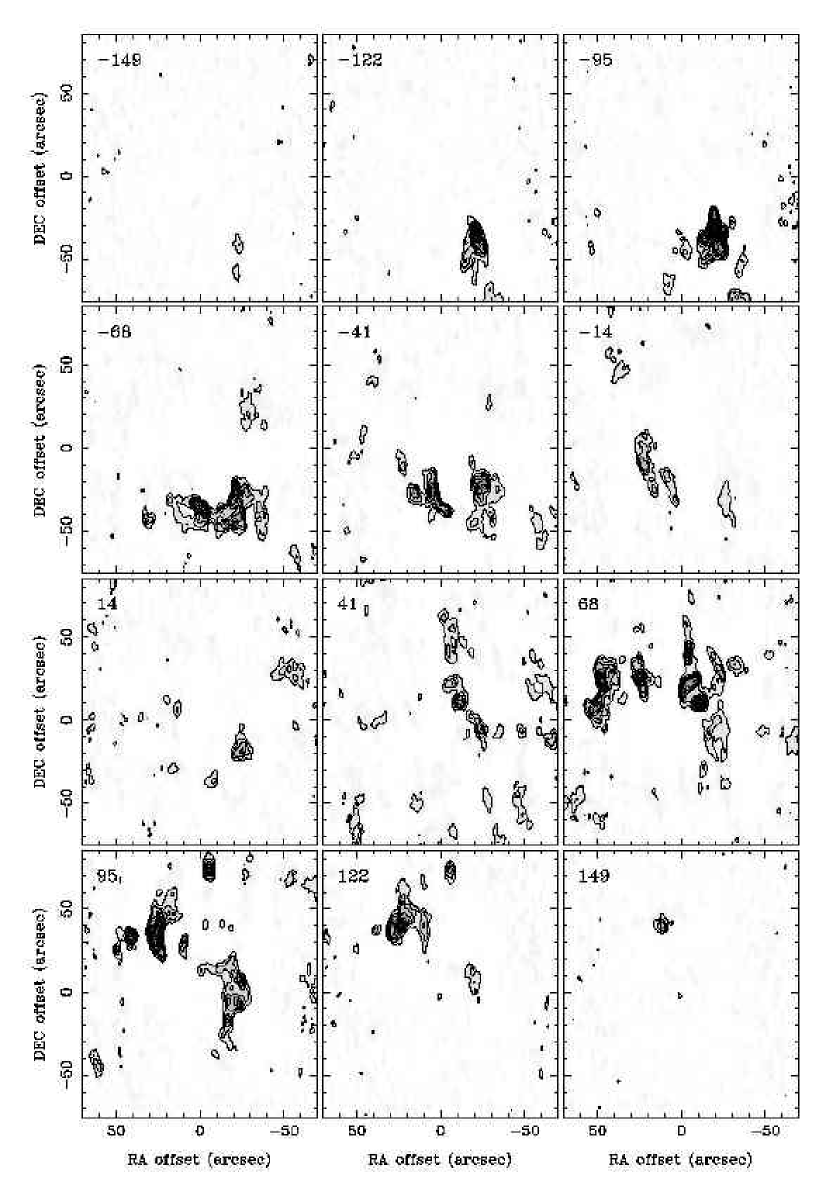
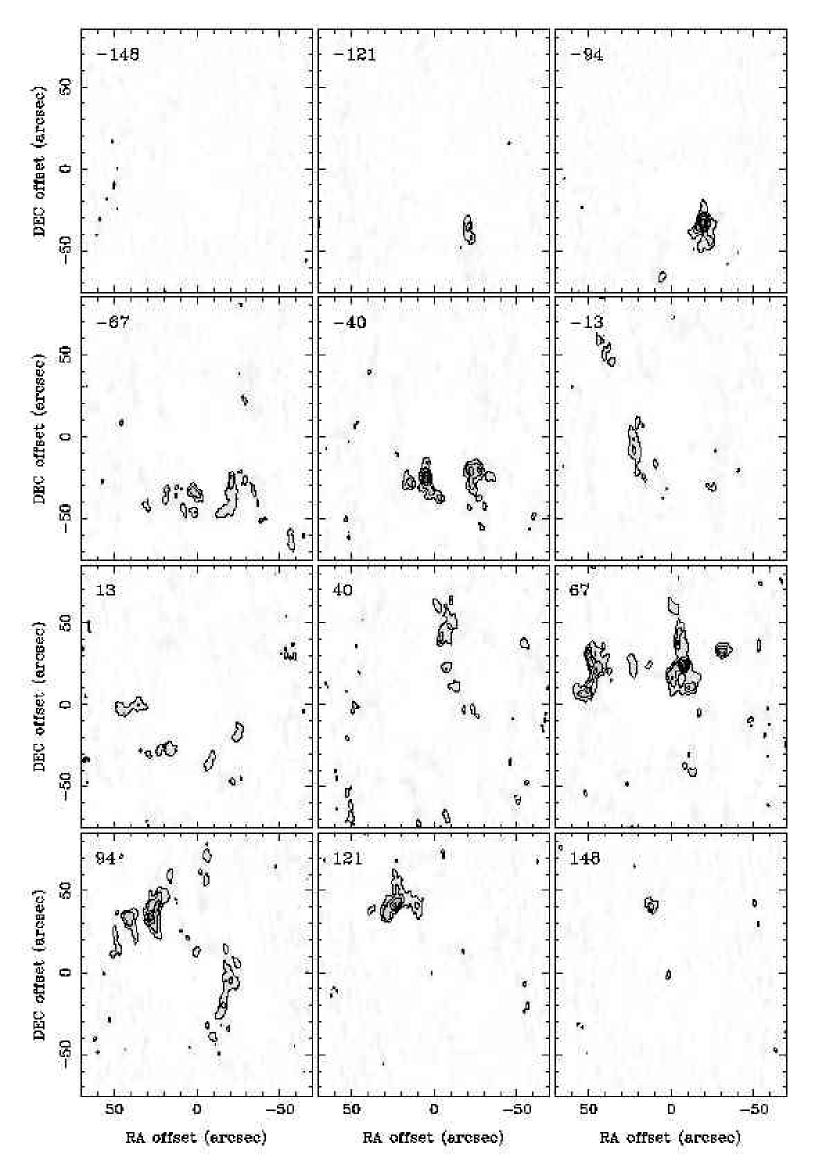
Channel maps of the HCN and HC emission binned in 27 km (four channel) intervals are shown in Figures 6 and 7. The rotation of the CND is clearly evident, as the dominant negative velocity emission arises southwest of and loops around to the northeast of , where the emission is primarily at positive velocities. The channel maps also clearly show locations with multiple velocity components. Perhaps the most prominent example is 20 west and 20 south of , where significant emission is seen around and 70 - 100 km .
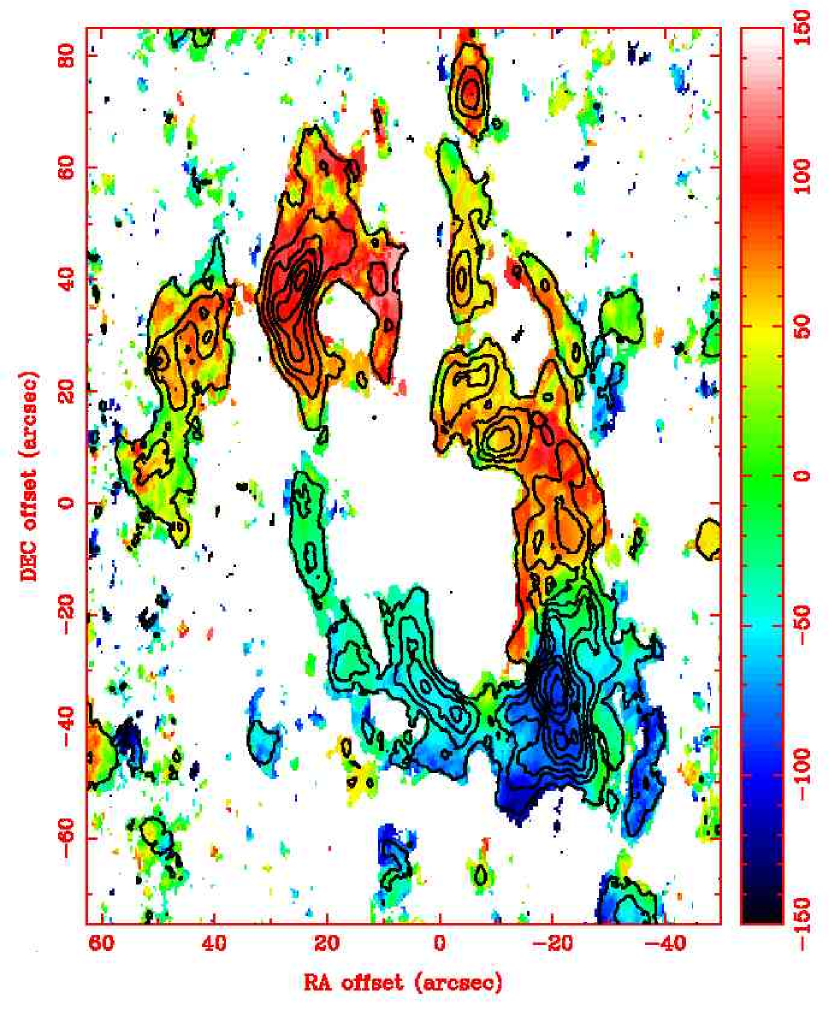
The rotation of the CND is additionally apparent in the flux-weighted average velocity map (Fig. 8). The velocity structure is continuous around the ring with the greatest negative (approaching) velocity near the southwestern emission lobe and the greatest positive (receding) velocity near the northeastern emission lobe. The sharp velocity gradient along the western side of the CND is a result of the spatial coincidence of -50 and 70 - 110 km emission and the presence of strong absorption at velocities near 0 km . The region to the east of has a velocity near 0 km and also suffers from large amounts of absorption, which explains the reduction in observed emission. We note that the primary velocities expected in the northern gap (km ) do not suffer from severe line of sight absorption, thereby suggesting a true dearth of molecular emission in the northern gap.
3.4 Comparing HC to HCN Emission in the CND
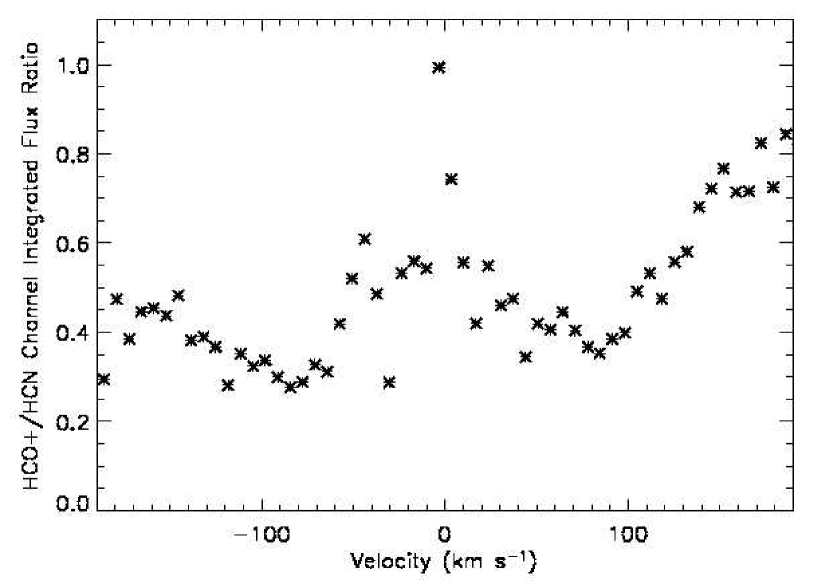
The HC/HCN abundance ratio is 1 for typical Galactic molecular clouds (Nyman, 1983; Vogel & Welch, 1983; Blake et al., 1987). Previous observations of the CND found that the HC emission traces the same regions as the HCN emission, but with HC/HCN as low as 0.06 - 0.2 (Marr et al., 1993). As seen in the integrated maps (Figs. 3 and 4), the relative strength of HCN versus HC emission in our observations is largely consistent with these previous measurements. For locations with emission in both HCN and HC, the mean HC/HCN ratio is 0.74. However, this result is misleading because we are only considering points with 3 emission in both tracers. There are almost 3 times as many locations with HCN emission without 3 HC emission as there are locations with 3 HC emission and HCN emission. Therefore, the true average HC/HCN emission ratio is significantly lower. Comparing the ratio of total HC to total HCN emission in each channel, we find a typical channel HC/HCN ratio of 0.4 (Fig. 9).
Examining the variation of the HC/HCN ratio with velocity we find that the lowest ratios are found in the channels corresponding to the northeastern and southwestern emission lobes of the CND with the highest ratios around 0 km (Fig. 9). This region of enhanced HC emission relative to the HCN emission corresponds roughly to the broad absorption trough around 0 km (Fig. 2). While there are velocity ranges in which HC absorption on is more significant than HCN absorption, especially around -140 and 20-40km (Fig. 2), the HC/HCN ratio in these regions is neither significantly enhanced nor reduced from the values in surrounding channels, suggesting that the differential line of sight absorption between HCN and HC does not significantly affect the analysis of the HC/HCN ratio in each channel. As we will see in §4, the southwestern and northeastern lobes include some of the most massive cores, while cores in our sample that are found at velocities around 0 km tend to be the least massive. This suggests a trend where the lowest HC/HCN ratios correspond to high mass regions while the highest HC/HCN ratios are found in the lower mass regions. We estimate the mass of each core (see §4.2) in three independent ways. Two of these techniques do have a dependence upon the level of the HCN emission (or the abundance of HCN relative to H2), which potentially biases us towards high mass cores in regions with high HCN flux (and thus low HC/HCN ratios). However, the third tracer, requiring an assumption that the cores are virialized, is independent of the observed HCN flux (and as we shall see provides density and mass estimates in good agreement with estimates from assuming the cores to be optically thick to HCN emission), thus strengthening the support for the correlation of low HC/HCN ratios in high mass regions. This correlation could result from the CND having enhanced HCN emission in more massive regions because of increased shock processing of the gas (perhaps in core-core collisions). Alternatively, if the lower mass regions have less shielding from cosmic ray ionization than do high mass regions, the fractional ionization rate would be higher in the low mass regions, leading to an enhanced HC abundance relative to HCN (Marr et al., 1993).
One significant region of HCN emission without significant HC emission is the linear filament, the swath of HCN emission approximately 20″ west and 35″ north of (see location in Fig. 10). We discuss this feature in more detail below (§3.5) and argue that the HCN abundance may be enhanced relative to HC because of shocks in the linear filament. In contrast, there is a single region where HC emission dominates that of HCN. Between 17 and 30 km in a region centered at 45″ east and 5″ south of , the median HC/HCN ratio is 1.22. The molecular gas cores found within this region tend to be some of the lowest mass and density cores in the CND, supporting the argument of higher HC abundance relative to HCN in lower mass and density regions due to enhanced cosmic ray ionization.
3.5 CND and H2 Emission
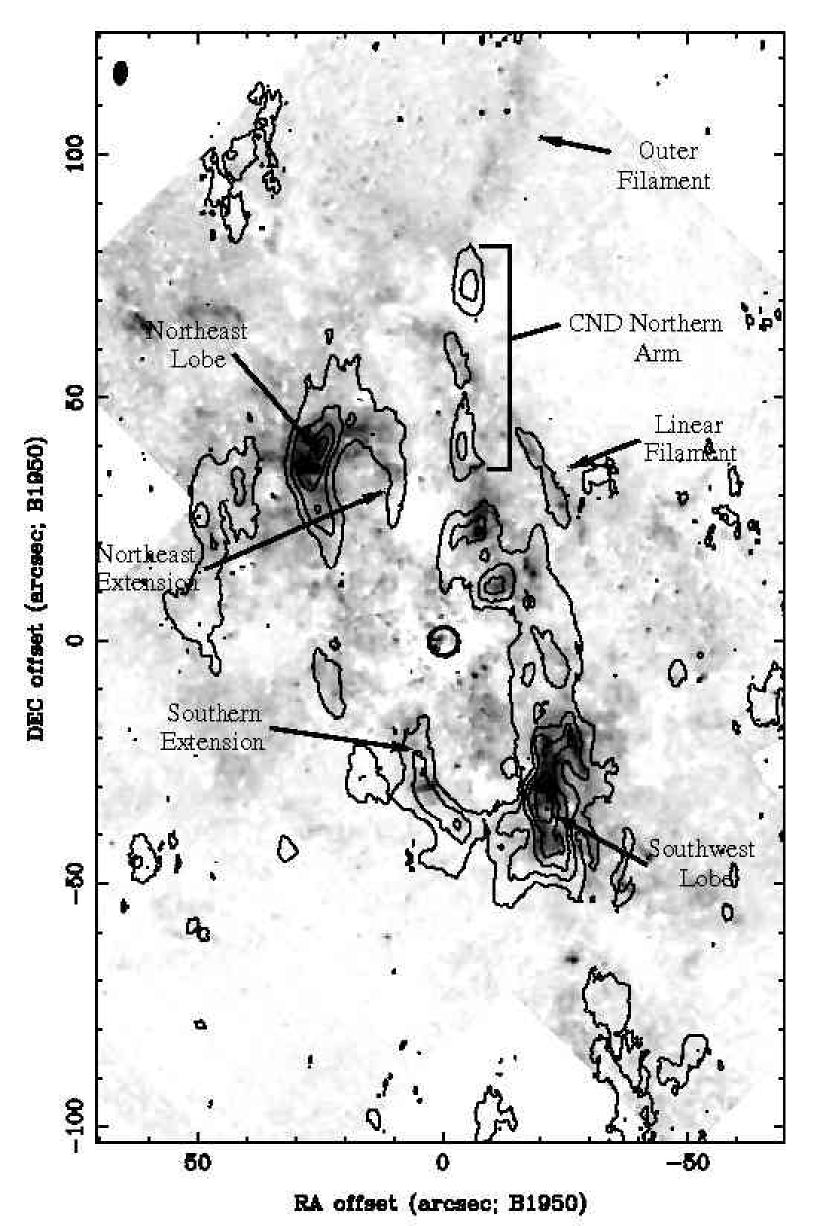
In Figure 10 we overlay our integrated HCN emission map in contours upon a gray-scale image of the H2 (1-0) S(1) emission at 2.12m from Yusef-Zadeh et al. (2001). H2 can be excited by shocks or UV fluorescence. The H2 emission is most prominent in the CND in the northeastern and southwestern lobes (as a likely result of limb brightening) where the integrated HCN emission is also the greatest. Yusef-Zadeh et al. (2001) argue that the most likely excitation sources for the H2 emission in the CND are UV radiation or the dissipation of energy from collisions of dense molecular gas cores within the CND. This core collision mechanism requires core densities of , confirmed by our density measurements below (§4.3). Core collisions and/or shocks could also create regions with low HC/HCN ratios, as shocks can help fuel HCN emission and additionally increase HCN abundance relative to HC (Mitchell & Deveau, 1983).
The linear filament is strongly detected in H2 emission with two primary emission peaks coincident with two HCN cores (cores X and Y in Fig. 13 below). This feature is extremely narrow in H2 (1″) and contains an OH maser near the northern end. The emission may arise from shocks generated by the supernova shell of Sgr A East hitting the 50 km molecular cloud (Yusef-Zadeh et al., 2001). Such shocks may explain the extremely low HC/HCN ratio in the linear filament.
A similar situation exists for the outer filament, which begins at the northern end of the CND northern arm. Weak HCN emission is seen coincident with the H2 emission of the outer filament, but there is no accompanying HC emission. We note that this emission is weaker and does not appear in contours in the integrated emission HCN map in Figure 10 but peaks around 10-15″ W, 90″ N. In addition, the outer filament coincides spatially and kinematically (peaking around 50 km ) with [SiII] emission at 34.8 m (Stolovy, 1997). The [SiII] emission and the HCN emission without accompanying HC flux both suggest a shock excitation mechanism for H2.
Two additional regions of good spatial agreement between the H2 and HCN are the northeastern and southern extensions. Both of these regions are unshielded from the radiation of the central stellar cavity, suggesting that the H2 emission is caused by UV excitation. We discuss the northeastern extension in greater detail in Section 3.6.
3.6 CND and the Minispiral
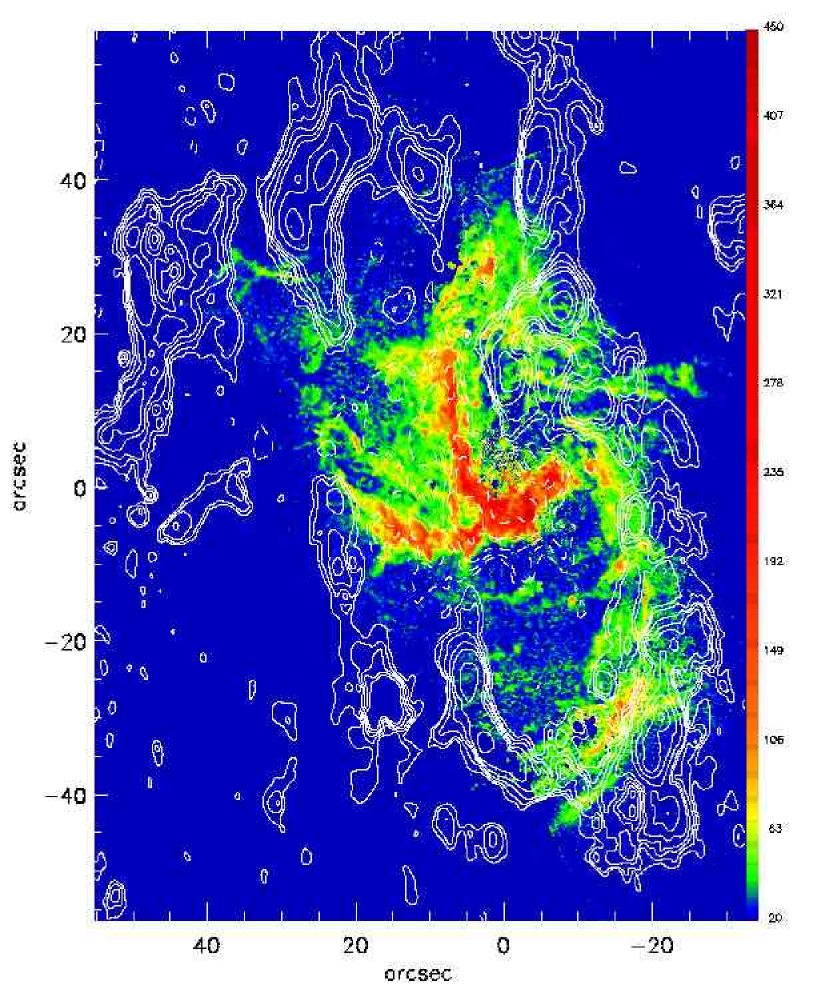
To understand the relationship of the CND to the ionized minispiral, we utilized two maps of the ionized emission. The first, a Hubble Space Telescope (HST) NICMOS Pa map (Scoville et al., 2003) has an exquisite spatial resolution of 0.2″. The second, a Very Large Array (VLA) H92 radio recombination line map (Roberts & Goss, 1993) combines 1″ spatial resolution with 14 km spectral resolution to provide kinematic detail of the inner parsecs.
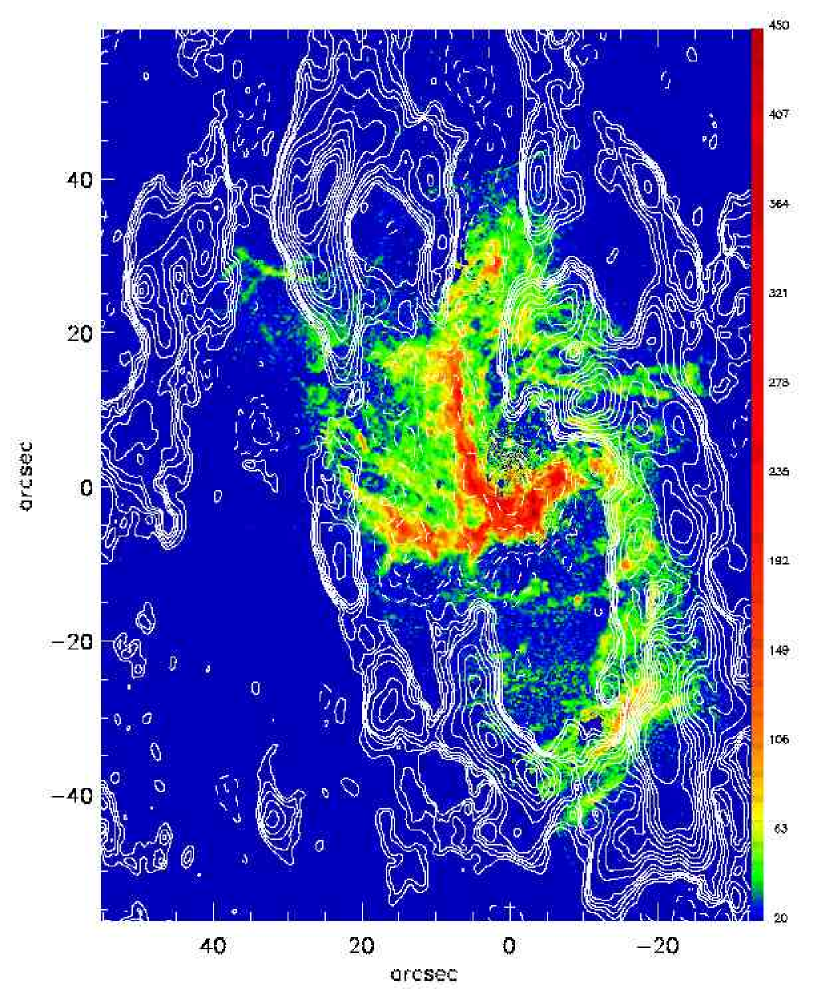
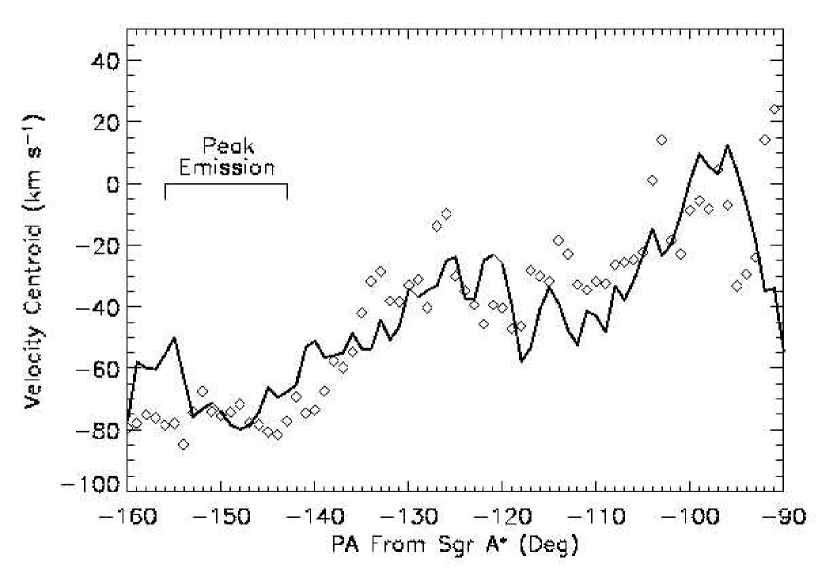
Figure 3 shows our integrated HCN emission map in contours on the color-scale Pa image. The most obvious interaction is along the minispiral’s western arc, where the ionized gas is consistently immediately interior to the CND. The western arc has been suggested as the inner edge of the CND, ionized by the strong UV radiation field of the stars in the central cluster (Lo & Claussen, 1983; Genzel et al., 1985; Serabyn & Lacy, 1985; Guesten et al., 1987). We confirm this relationship kinematically through examining the velocity centroids of the ionized and molecular emission along the western arc (Fig. 11). The velocities are in close agreement, particularly at a position angle of approximately -145°, at which both the HCN and H92 emission peak. While some overlap between the western arc and the CND exists, the ionized emission always lies interior to the peak HCN emission. The high column densities that we measure for the HCN emission along the western side of the CND correspond to visual extinctions of up to 700 magnitudes (Scoville et al., 2003), suggesting that in regions where the ionized emission observed in Pa overlaps the CND emission, the ionized emission must lie near the foreground side of the molecular gas.
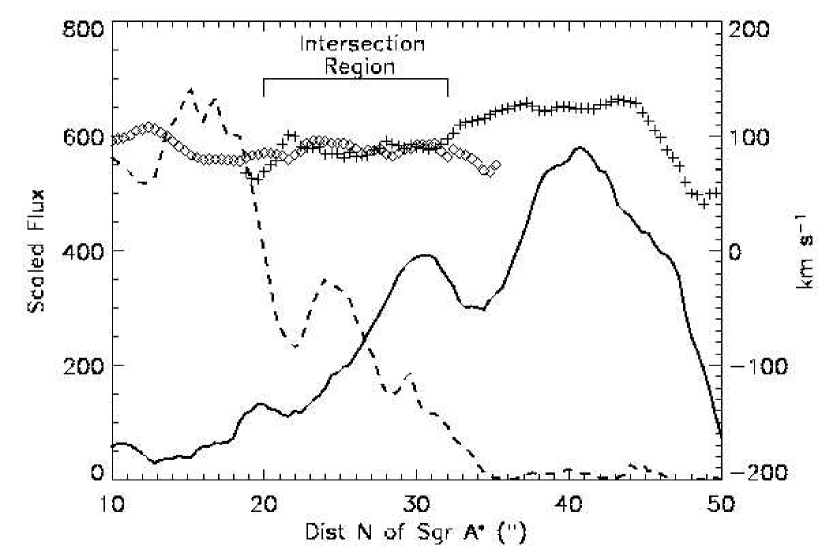
In addition, Figure 3 suggests that the peak emission from the northern arm of the minispiral may connect with the northeastern extension from the CND at 5″ E, 20″ N. The enhanced spatial resolution of our observations reveals the northeast extension to be a longer and more sharply collimated feature than previously observed. The strong collimation in the molecular and ionized gas can be explained by pressure of mass-loss winds from emission-line stars in the inner parsec (Scoville et al., 2003). At the intersection between the northern arm and the northeastern extension the velocities are in remarkable agreement (Fig. 12). On the other hand, the northernmost parts of the northern arm appear to bend to the west slightly after meeting the northeastern extension and pass through the northern gap in the CND, and based on an increase in CND linewidths on either side of the northern gap and the presence of an OH maser within the gap (Yusef-Zadeh et al., 1999), Wright et al. (2001) suggest that the minispiral northern arm is infalling and creates the gap as it pushes through the CND. A definite conclusion on the relationship between the northern arm and the CND is not possible with these observations, but our improved spatial resolution allows us to suggest for the first time that the northeastern extension and the northern arm may be part of a single, highly collimated feature.
4 Cores within the CND
The enhanced spatial resolution of our HCN and HC observations resolves a great deal of internal gas structure within the CND, enabling us to analyze the molecular gas properties there using techniques similar to those used to derive the properties of Galactic giant molecular clouds (GMCs) and their cloud cores.
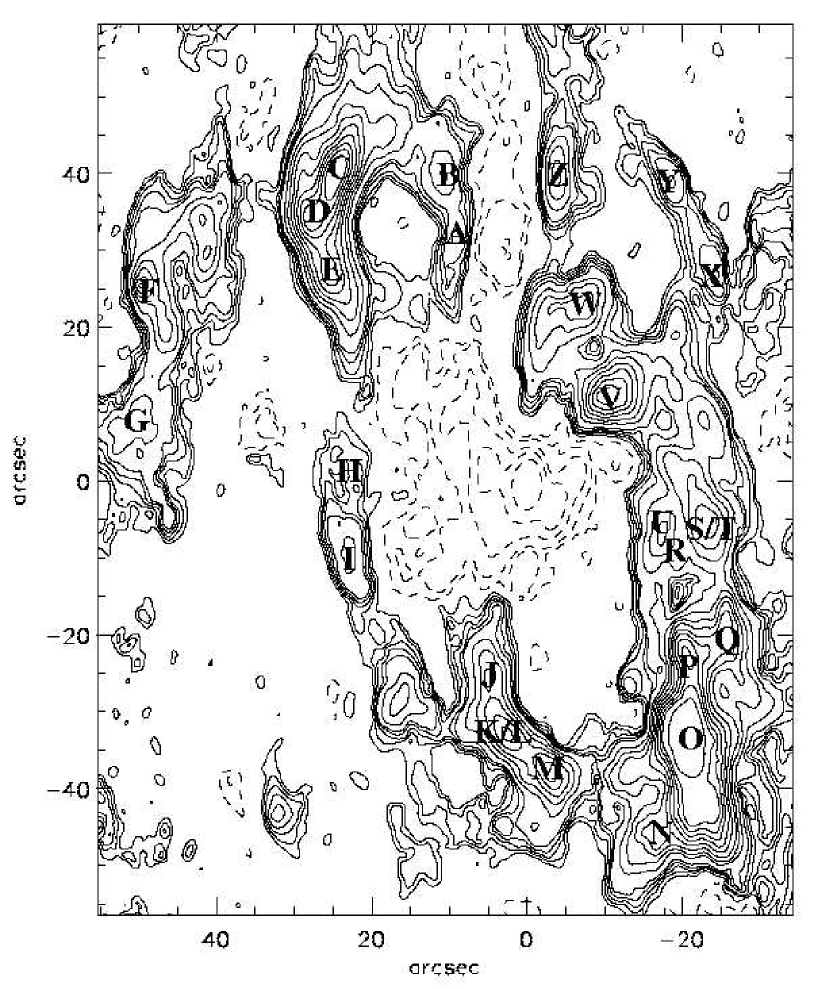
4.1 Core Identification and Measurements
From the HCN maps we have identified 26 bright, isolated emission features, each a dense molecular gas core within the CND. These features, labeled A-Z, are marked in Figure 13. We required that each core included in this analysis be isolated in both position and velocity space from other emission peaks down to at least 50% of the peak emission for the core. Included in this sample are the vast majority of the brightest emission cores that met our requirements for isolation, as well as a number of lower emission level cores; however, we do not claim completeness to any particular flux level but rather intend the sample to be representative of the range of bright cores found within the CND. Some peaks in the integrated HCN emission map (Fig. 3), such as that 10″ west of core F, are too close spatially and kinematically and thus are not included in our core sample. There are additional emission cores at larger distances from (e.g., 5″ W, 80″ N in Fig. 8), but we restricted our sample to cores contained in the main CND emission.. In Table 2 we detail the properties of the 26 cores, including location, size, velocity center and FWHM, and mass and density estimates. Each of these core properties is discussed in greater detail below.
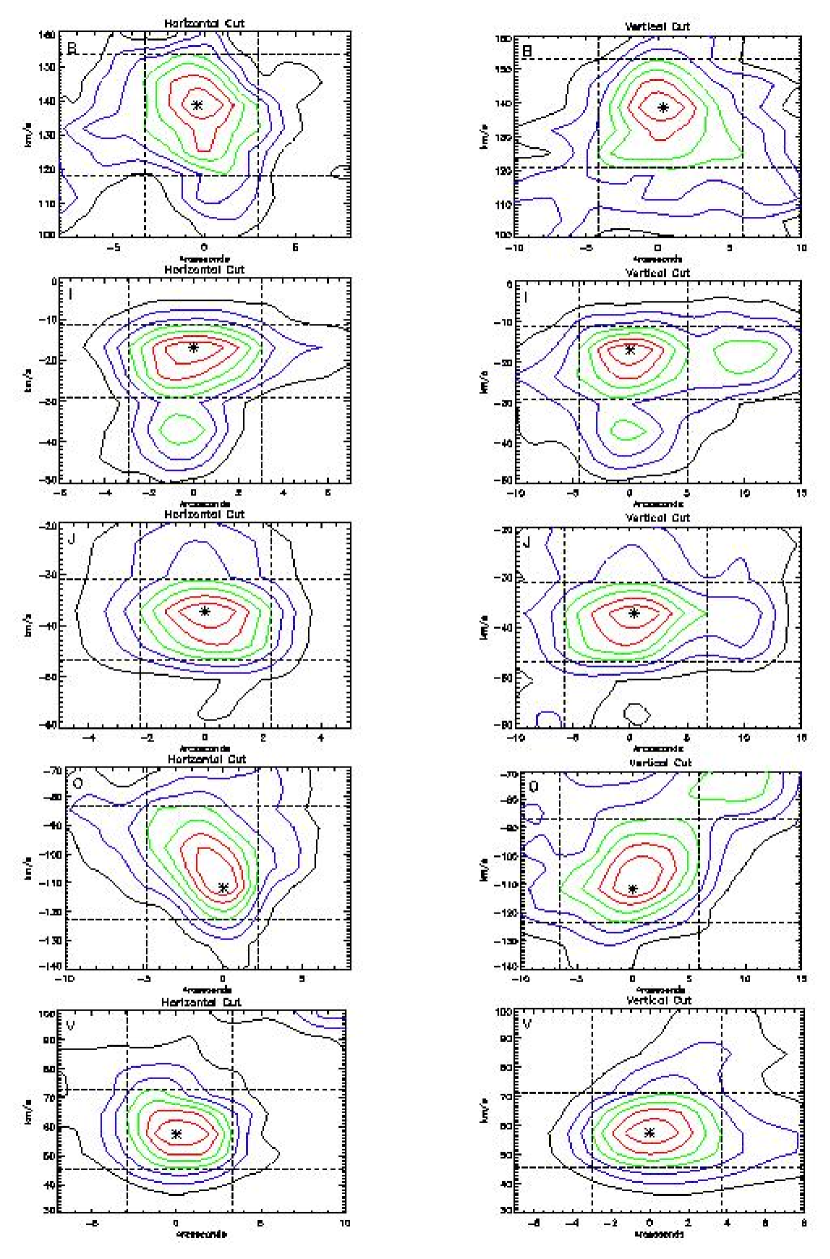
For each of the cores, position-velocity strip maps were generated in the north-south and east-west directions to use for measurements of core size and velocity width. In addition, the strip maps allowed us to reduce line of sight blending and separate multiple kinematic components (such as core pairs K/L and S/T). Examples of these position-velocity maps are given in Figure 14 for cores B, I, J, O, and V. In each of these plots we indicate the adopted half-power size and velocity FWHM estimates by the dashed lines. The measured apparent size FWHMs were deconvolved for the instrumental spatial resolution (beamsize) using the Gaussian approximation (i.e. ). The mean core FWHM (corrected for the instrumental resolution) is or pc. Approximating the average diameter of each core by the geometric mean of its north-south and east-west FWHMs, we find that the mean core diameter is (0.25 pc).
In Table 2, we also include the projected and deprojected distance of each core from . To deproject, we assumed an inclination angle of 60° for the CND (Jackson et al., 1993). The median and mean deprojected core distances are 1.67 pc and 1.80 pc respectively, and the distribution of the 26 core distances follows very closely the deprojected flux distribution found in Figure 5.
HCN (J=1-0) has three hyperfine lines with relative intensities of 1:5:3 and relative velocities of -7.07:0:4.8 km (Park et al., 1999). This velocity separation is on the order of the width of each channel (6.8 km ). We modeled the increase in measured velocity FWHM due to the hyperfine structure, as well as the instrumental velocity resolution (taken to be one channel width) and found it to be a minor effect for velocity FWHMs km but substantial for smaller widths. The simulations were used to correct the measured velocity widths of the CND cores. We find median and mean velocity FWHMs for the 26 cores of 28.1 and 26.1 km respectively, corresponding to approximately 4 channels in our observations. It should be noted that the 1:5:3 intensity ratio of the three HCN (J=1-0) hyperfine lines was derived for optically thin emission and so may not be the exact ratio applicable in this situation, because the HCN emission is optically thick. However, comparison with linewidths measured from our HC observations for a smaller sample of cores suggests that the linewidths measured from the HCN emission and contained in Table 2 are in agreement with the HC linewidths to within 15 - 20%.
4.2 Core Masses
We use three independent approaches to estimate or constrain the masses of the molecular gas cores in the CND: virial estimates assuming the cores are gravitationally bound, an optically thick estimate obtained by integrating the gas column density over the projected area of each core, and a lower limit obtained under the assumptions that the HCN in the cores is optically thin and the contribution from shocks to the HCN flux is minimal. Each of these approaches has its own limitations (eg. the cores may not be in virial equilibrium and the HCN to H2 abundance ratio is very poorly known for the CND). In addition, the optically thin and optically thick estimates are affected by the uncertainty in the role that shock processing plays in producing the observed HCN emission. Shocks, particularly from core-core collisions, could substantially enhance the HCN abundance and hence the observed HCN flux per unit mass of gas. If the true HCN abundance is in fact enhanced, our estimates of the core masses and densities under both the optically thin and optically thick assumptions would be overestimated. The optically thin calculations therefore can be considered a lower limit to the core mass and density only under the assumption that the shock contribution to the HCN emission is negligible.
Keeping in mind these assumptions and their possible effects, we find that the virial and optically thick methods yield substantially higher masses and densities for the CND than previously derived from lower resolution HCN imaging.
4.2.1 Virial Masses
Virial mass estimates for the cores were computed from the measured sizes and velocity widths using
| (1) |
where Rpc is the radius (pc) of the core (taken as the geometric mean of the deconvolved half widths in the north-south and east-west directions) and is the velocity line-width (FWHM) in km . We model the core as a uniform density sphere, introducing the factor of in eq. 1.
4.2.2 Molecular Column Density () Masses
The core masses can also be estimated by integrating the molecular gas column densities over the surface area of each core. The optical depth of the observed HCN emission can be estimated from the observed flux ratio of HCN and H13CN emission. Using the lowest resolution but highest signal-to-noise ratio data (L configuration tracks in Table 1) of the HCN line and the additional L configuration observation of the H13CN line we obtain a mean HCN (J=1-0) optical depth () of 4 for the southwestern and northeastern CND emission lobes (assuming a isotopic ratio of 30 for the Galactic center). This measured optical depth is in excellent agreement with previous estimates for the CND (Marr et al., 1993).
The total column density of H2 can be derived from the HCN (J=1-0) optical depth () by:
| (2) |
where Tx is the excitation temperature of the HCN rotational levels, XHCN is the abundance of HCN relative to H2, A sec-1 is the Einstein A coefficient for the HCN J=(1-0) transition and f, for which B0 = 44.316 GHz is the rotational constant for the HCN (J=1-0) transition. The CND dust temperature is between 20 and 80 K (Becklin et al., 1982; Mezger et al., 1989). Since at the very high densities encountered in the CND, the dust and gas should be in thermal equilibrium, we have scaled the HCN excitation temperature to 50 K, the midpoint of the dust temperature range.
Integrating the column density ( 2 R) over the surface area () of the core and multiplying by a factor of 1.36 to account for the expected He mass fraction within the core, one obtains the total mass of gas Mcol,
| (3) |
The major uncertainties in the column density mass estimate lie in the adopted abundance of HCN relative to H2 and in the excitation temperature. Here we have scaled the equations and used a value of . This value has been derived for a number of high density cores in Galactic GMCs (Blake et al., 1987) and also for the CND by Marshall et al. (1995) from analysis of multi-transition HCN observations. We should note that much higher values for such as and have been adopted by Marr et al. (1993) and Jackson et al. (1993), respectively. However, Marr et al. (1993) considered only T, compared with 50 K adopted here based on the CND dust emission. Previous works have taken a wide range of values for Tx from 20 - 450 K (see Table 2 of Jackson et al. (1993)), although most atomic and molecular studies have taken a value of T 100 K. Since the derived column densities and masses scale as T X, adoption of the higher HCN abundance and the higher Tx by Marr et al. (1993) largely offset each other in their effect on the derived masses. Shock processing of the molecular gas would also increase the value of , leading to an overestimate of the core masses.
4.2.3 Optically Thin Masses
Lastly, we obtain a lower limit to the core mass under the assumptions that shock-excitation is negligible and the HCN emission is optically thin and thus every spontaneous decay from the J = 1 rotational level yields an escaping line photon. The observed line flux then translates directly into a total rate of HCN photons (pphotons) by:
| (4) |
However assuming a rotational temperature and HCN abundance, we can also express the total rate of HCN photons by:
| (5) |
where m is the mass of a hydrogen molecule, and by equating eqs. 4 and 5, calculate a minimum H2 mass for each core. The optically thin assumption is clearly not true based on our measurements of for parts of the CND, but it does allow for an estimate of the lower limit to the mass (assuming negligible shock contribution). After correcting for the mass fraction of He, we obtain
| (6) |
where S is the total emission line flux of the core. We have assumed a distance to the CND of 8 kpc. If there were significant shock processing, then the actual masses and densities would be lower.
4.3 Derived Masses and Densities
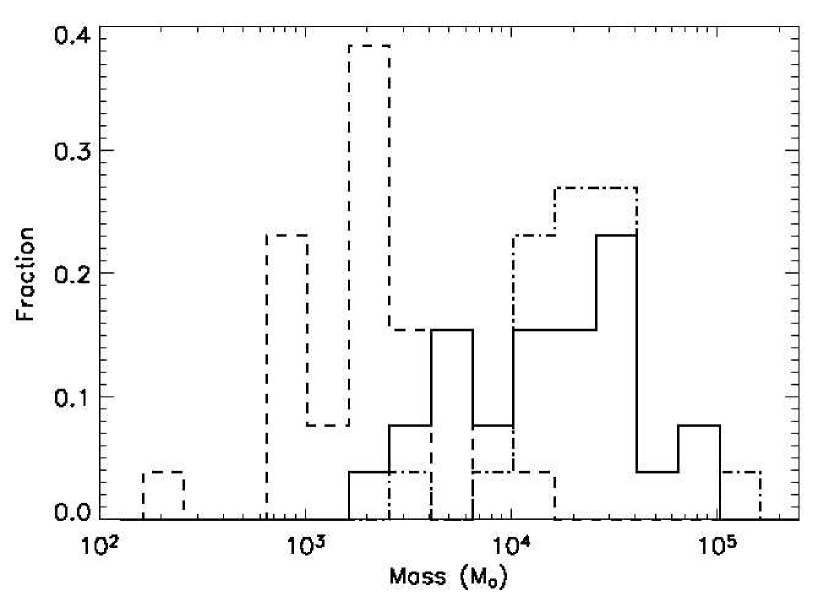
In Table 2 we list the estimated masses (virial, , and optically thin) for the 26 CND cores identified in Figure 13. In Figure 15 we plot the distribution of these core masses. In these calculations, we assume T 50 K and X. The virial and mass estimates are in good agreement, ranging from 2000 to 1.36 for the selected cores with a median mass of 1.65 and 2.43 , respectively. The lower limit, optically thin masses are typically a factor of 10 lower. The total mass contained within the 26 cores is 5.5, 7.90, and 6.79 assuming virial, , and optically thin densities respectively. The 26 cores included in our sample cover a significant fraction of the dense HCN emission from the CND; therefore we estimate a total mass within the cores of the CND of 106 . We note that Shukla et al. (2004) estimated virial masses for a sample of nine cores in the CND based on separate ″ OVRO HC imaging range from to , similar to our virial mass estimates. The close similarity between the virial and mass distributions (Fig. 15) supports the assumption that the cores are in virial equilibrium.
The internal densities of the CND cores can be obtained from their mass estimates by:
| (7) |
where we again assume a uniform density sphere. The density estimates for each core under the three different mass estimates are contained in Table 2.
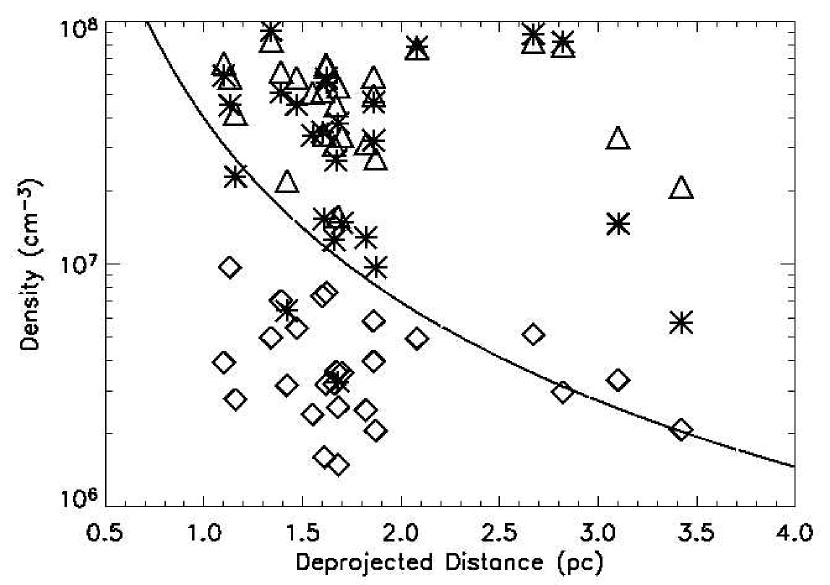
We graphically show the derived core densities as a function of deprojected distance from in Figure 16. The core densities are significantly larger than the - previously estimated for the CND (Genzel et al., 1985; Marr et al., 1993). Indeed our mean virial and densities are 3.8 and 5.0 , respectively. All of the optically thin density estimates are . Our density estimates are, in fact, similar to those ( cm-3) derived by Jackson et al. (1993) from single dish, multi-transition HCN measurements; their estimates are obtained from analysis of molecular excitation and hence are entirely independent of the virial and column density () techniques used here. Similarly, Shukla et al. (2004) find virial densities of to for their sample of nine CND cores. As we will discuss later, the high densities of our large core sample have important implications for core stability in the tidal field of and for the possible role of these cores in the formation of stars in the inner parsecs.
A final independent check on our mass and density estimates of the CND is provided by millimeter and sub-millimeter dust emission measurements from the CND (Mezger et al., 1989; Dent et al., 1993). Mezger et al. (1989) detected the CND dust at mm. After subtracting substantial radio continuum from the ionized gas, they estimate a total mass of cold dust (at 20 K) and gas in the northeastern and southwestern CND lobes. In 450 m James Clerk Maxwell Telescope (JCMT) observations at 7″ resolution, the flux of the CND is approximately 100 Jy in a distribution that closely follows that of the HCN observations of the CND (compare Fig. 3 in this work to Fig. 10a of Dent et al. (1993)). For a mass opacity coefficient of 24 gr cm-3 at 450 m (Hildebrand, 1983) this implies a mass of for Td = 50 K. These estimates are more than a factor of 10 less than our measurements of the molecular gas mass within the CND. However, mass estimates based on observed dust emission require assumptions for the dust opacity coefficient and dust-to-gas abundance ratio – both of which could be quite different in the high density CND – and the assumption that the dust was optically thin at 450 m. We note that the typical densities and sizes estimated in Table 2 for the cores yield typical mass column densities of 50 to 100 gr cm-2. For standard dust properties and abundances (Hildebrand, 1983), these column densities imply optical depths of at 450m. Thus the observed 450m fluxes may considerably underestimate the CND mass because of opacity effects. Our 3 mm continuum maps show no evidence of dust emission associated with the CND molecular gas cores, but this is below our detection limit even for the very high column densities estimated above.
One factor that could affect our measurements of the core masses and densities is the resolving out of substantial extended HCN flux. However, we compared our HCN maps to Nobeyama 45m HCN observations (Kaifu et al., 1987) and find that for the CND lobes we recover % of the total HCN flux.
4.4 Tidal Stability
The tidal shear on CND cores from the gravitational potential of and the central stellar population is extremely large. The total mass enclosed as a function of Galactic radius (L) can be modeled as:
| (8) |
This expression for total enclosed mass is taken from Vollmer & Duschl (2000) and modified to account for new measurements of the mass of (Ghez et al., 2005).
Therefore the mean internal density required for a core to be tidally stable is :
| (9) |
We list the minimum densities for tidal stability () for each core in Table 2. The mean value is cm-3.
Comparing the calculated core densities with the minimum densities required for tidal stability, we find that the vast majority of cores are dense enough to be tidally stable. Indeed, all 26 cores have densities sufficient for tidal stability, and 23 of the 26 cores have sufficient virial densities. We note that there is no correlation between measured core densities and deprojected distance from and that the virial and densities are often 3-5 times greater than the minimal tidal stability density (Fig. 16). This is strong observational support for widespread tidal stability and virial equilibrium within the CND cores because if the cores were being tidally disrupted, their apparent virial densities would always approach the tidal stability limit as the cores gradually become tidally stripped.
5 Discussion: Implications of CND Core Stability
5.1 Lifetime of the CND
The core densities that we measure for the CND are not only substantially higher than previous estimates but also on average 3-5 times larger than necessary for tidal stability. Thus the lifetime of the CND cores may be considerably longer than their internal dynamical timescales of yrs.
The ionized gas within the minispiral has been estimated at 100 (Sanders, 1998). We calculate a total molecular mass within the CND cores of , giving an mass ratio of . Estimates for the infall time of the ionized material are yr (Scoville et al., 2003; Vollmer & Duschl, 2001; Sanders, 1998). If even 10% of the molecular gas in the CND ultimately fell into the central parsec and became the ionized material now visible in the minispiral, the mass ratio between the CND and the minispiral and the minispiral infall time argue for a typical lifetime for the material in the CND of . This time frame is a factor of 10-100 larger than previous estimates and is also much longer than the dynamical/orbital time for the CND.
The neutral, atomic gas contained in the inner parsec has been estimated at 300 M⊙ (Jackson et al., 1993). The bulk of this gas has been modeled as an infalling atomic cloud with the northern and eastern arms of the minispiral as the photoionized inner edges of this cloud. If this atomic mass is included in the mass conservation arguments above, this reduces the lifetime of the CND by a factor of 4, which is still significantly longer than previous estimates.
The sharpness in the dropoff of the distribution of HCN flux and CND cores as a function of deprojected distance from (Fig. 5 and §4.1) has implications for the lifetime of the CND. More than 70% of the HCN emission from our observations is contained within the inner 2 pc. If the CND has a yr lifetime, as suggested from the mass conservation argument, then there are sufficient molecular gas cores at radii beyond the CND that over yr could migrate to the CND, providing a means of maintaining its mass. Coil & Ho (1999, 2000) find evidence for such feeding of the CND from the 20 km molecular cloud at a 10 pc projected distance from and even detect cores within the streamer feeding the CND. In contrast, a short lifetime for the cores of the CND would suggest that the CND itself is a short-lived structure, as there is insufficient additional material (as traced either by the cores or by the raw HCN emission) outside the CND but within the inner few parsecs for replenishment.
5.2 Formation of the Massive Young Stars Found in the Inner Parsec
Several stellar populations are observed within the central parsec (Genzel, 2001). These include a 1-10 Gyr stellar population dominated by emission from red giants (Genzel et al., 2003), tens of blue supergiants tracing a very recent (2 - 7 Myr) burst of star formation (Forrest et al., 1987; Allen et al., 1990; Krabbe et al., 1991, 1995; Morris & Serabyn, 1996; Tamblyn et al., 1996; Blum et al., 1996; Paumard et al., 2001), and a population of presumably young, dust-enshrouded stars (Becklin et al., 1978; Krabbe et al., 1995; Genzel et al., 1996, 2003). Genzel et al. (2003) describe the stellar population of the inner parsec as a metal-rich older star cluster, interspersed with a number of young stars, which dominate the emission in the inner 10″. Scoville et al. (2003) detect a drop in the stellar surface brightness within 0.8″ of , likely due to the interaction of the black hole with the surrounding stellar environment.
Understanding the formation mechanism of the young stars within the inner parsec has proven extremely difficult. The enormous gravitational potential of prevents in situ formation without the aid of shocks or collisions unless molecular clouds have densities greater than 109 - 1010 . While we measure high densities within the cores of the CND, our measured densities are still 100-1000 times below this in situ formation threshold. On the other hand, star formation at greater distances (ie. pc) from and subsequent inward migration is also unfeasible because the time for two-body relaxation of a star to the inner arcseconds is greater than the observed age of the young stars.
Our discovery of the high densities and masses within the CND cores provides a possible source for the young stars of the central parsec. While the transport of individual stars to the central region is impossible within the observed age of these young stars, star clusters can more quickly migrate to the inner parsec via dynamical friction. Portegies Zwart et al. (2003) estimate that a or greater cluster with a diameter of 0.3 pc or less could reach the inner parsec from a radius of 5 pc or less in the 2 - 7 Myr age of the young stars. This formation mechanism had been previously dismissed in part because of the lack of massive cloud cores that could produce such clusters in the inner 5 pc (Genzel et al., 2003). However, within our sample of 26 massive CND cores, almost all have diameters less than 0.3 pcs and masses greater than 104 . Indeed the most massive core has a mass in excess of 105 . These most massive cores could potentially form a stellar cluster in the CND with high star formation efficiency and migrate to the Galactic center within 2 - 7 Myr, producing the observed young stellar population. For example, evidence suggests that IRS13 may be a remnant of one such cluster (Maillard et al., 2004). In addition, simulations of the CND suggest that the CND cores we observe are able to collapse and form stars before being shredded in the tidal field of the Galactic center (R. Coker 2004, private communication). Furthermore, numerical simulations have found that a cluster at the radius of the CND (or a less massive cluster harboring an intermediate mass black hole) could spiral into the inner parsec within the lifetime of the 2-7 Myr stars (Kim & Morris, 2003; Kim et al., 2004; Hansen & Milosavljevic, 2003). Mid-infrared imaging of the CND (Telesco et al., 1996) has revealed significant emission at 10, 20, and 30 m, especially along the western arc of the minispiral and more diffusely over the entire western side of the CND. There are no significant peaks of mid-infrared emission coincident with the cores visible in the CND. Such a coincidence could have been an indication of active star formation. Sensitive high spatial resolution observations in the mid to far infrared (ie. 10-100m) would allow for a more precise search for ongoing star-formation within the CND cores.
Cores within the CND reach densities of a few , making them tidally stable at distances less than 1 pc from the Galactic center (Fig. 16). An alternate explanation, therefore, for the young nuclear star cluster is that a massive core remains tidally stable for the majority of its infall from the CND onto and forms stars during this infall. These new stars would then reach the inner parsec in less than 2 - 7 Myr. Depending on the efficiency of the star formation in the infalling core, multiple infall events might be necessary. These infall events could be spread over a period of a few Myr, explaining the observed age spread within the nuclear stellar cluster.
6 Conclusions
We have presented OVRO millimeter observations of HCN and HC emission from the CND at a spatial resolution of , a significant improvement in spatial resolution over existing observations. With this enhanced resolution, we were able to study in great detail the behavior of the CND in the gravitational potential of the Galactic Center and the possible role of the CND in the formation of the young stellar population of the inner parsec. In particular we find:
1. The CND, as traced by HCN and HC emission is a well-defined structure with an inner radius of (1.6 pc) from and a sharp drop past (2.0 pc), suggesting a ring-like morphology. The main HCN and HC emission is consistent with rotation at km , although emission at multiple velocities is found in some locations, particularly along the western edge of the CND. There is a lack of observed emission in the eastern part of the ring where radial velocities are near 0 km because of strong line of sight absorption.
2. The HCN flux is typically a factor of 2 - 3 greater than the HC flux within the CND. However, there is substantial variation in this HC/HCN flux ratio with density, likely because of a higher fractional ionization from cosmic rays and thus greater abundance of HC in lower density regions. In addition, shocks may play a role in enhancing the HCN abundance and flux.
3. There is good spatial agreement between the H2 and HCN emission in the northeastern and southwestern CND lobes, as well as in the southern and northeastern extensions. In these regions, the H2 is likely UV excited or excited by collisions of the dense CND cores. The linear and outer filaments are also seen significantly in H2 and HCN (but not HC) and are likely shock-excited.
4. There are a number of interactions between the ionized gas of the minispiral and the CND. In particular, the western arc of the minispiral is both spatially and kinematically consistent with being the ionized inner edge of the CND. In addition,, the minispiral northern arm may connect with the northeastern extension of the CND to form a single collimated structure.
5. We identify a sample of 26 resolved molecular gas cores within the CND. These cores trace the overall HCN emission and have a characteristic diameter of 6.7″ (0.25 pc). The cores have a typical density of (3-4) , and a typical mass of (2-3) . The total mass within the CND is estimated at . Some of the HCN emission may be enhanced by shock chemistry, implying that our estimates of the optically thick and optically thin core masses and densities (assuming a standard HCNabundance) are overestimates.
6. The CND core densities are sufficient for tidal stability in almost all of the detected cores. Based on mass conservation arguments, a 107 yr lifetime for the CND is predicted.
7. The core density estimates under the assumption of virialization and under the assumption of an optical depth are similar and often 3-5 times the minimum density for tidal stability, suggesting that many of the cores are indeed gravitationally bound.
8. The enhanced core densities and masses may explain the formation of the massive young (2-7 Myr) stars found in the inner parsec. The cores are tidally stable and can undergo star cluster formation while within the CND. Alternatively, these cores are stable even at closer distances to and could form stars during an infall process. In either scenario stars can be transported to the inner arcseconds within the observed age of the stars.
We thank Rob Coker, Sungsoo Kim, Milos Milosavljevic, and Farhad Yusef-Zadeh for their discussions, comments, and insights on this project. We thank the anonymous referee for comments and suggestions that improved this work. In addition, we thank Doug Roberts and Bill Dent for sharing their data on H92 emission from the minispiral and 450 m CND emission respectively. Research at the Owens Valley Radio Observatory is supported by the National Science Foundation through NSF grant AST99-81546. M.H.C. is supported through NSF grant AST02-28955.
References
- Allen et al. (1990) Allen, D. A., Hyland, A. R., & Hillier, D. J. 1990, MNRAS, 244, 706
- Backer & Sramek (1999) Backer, D. C. & Sramek, R. A. 1999, ApJ, 524, 805
- Becklin et al. (1982) Becklin, E. E., Gatley, I., & Werner, M. W. 1982, ApJ, 258, 135
- Becklin et al. (1978) Becklin, E. E., Matthews, K., Neugebauer, G., & Willner, S. P. 1978, ApJ, 219, 121
- Bieging et al. (1980) Bieging, J., Downes, D., Wilson, T. L., Martin, A. H. M., & Guesten, R. 1980, A&AS, 42, 163
- Blake et al. (1987) Blake, G. A., Sutton, E. C., Masson, C. R., & Phillips, T. G. 1987, ApJ, 315, 621
- Blum et al. (1996) Blum, R. D., Sellgren, K., & Depoy, D. L. 1996, AJ, 112, 1988
- Coil & Ho (2000) Coil, A. L. & Ho, P. T. P. 2000, ApJ, 533, 245
- Coil & Ho (1999) —. 1999, ApJ, 513, 752
- Cornwell & Wilkinson (1981) Cornwell, T. J. & Wilkinson, P. N. 1981, MNRAS, 196, 1067
- Dent et al. (1993) Dent, W. R. F., Matthews, H. E., Wade, R., & Duncan, W. D. 1993, ApJ, 410, 650
- Ekers et al. (1983) Ekers, R. D., van Gorkom, J. H., Schwarz, U. J., & Goss, W. M. 1983, A&A, 122, 143
- Forrest et al. (1987) Forrest, W. J., Shure, M. A., Pipher, J. L., & Woodward, C. E. 1987, in AIP Conf. Proc. 155: The Galactic Center, 153–+
- Genzel (2001) Genzel, R. 2001, in ASP Conf. Ser. 228: Dynamics of Star Clusters and the Milky Way, 291–+
- Genzel et al. (1985) Genzel, R., Crawford, M. K., Townes, C. H., & Watson, D. M. 1985, ApJ, 297, 766
- Genzel et al. (2003) Genzel, R., Schödel, R., Ott, T., Eisenhauer, F., Hofmann, R., Lehnert, M., Eckart, A., Alexander, T., Sternberg, A., Lenzen, R., Clénet, Y., Lacombe, F., Rouan, D., Renzini, A., & Tacconi-Garman, L. E. 2003, ApJ, 594, 812
- Genzel et al. (1996) Genzel, R., Thatte, N., Krabbe, A., Kroker, H., & Tacconi-Garman, L. E. 1996, ApJ, 472, 153
- Ghez et al. (2005) Ghez, A. M., Salim, S., Hornstein, S. D., Tanner, A., Lu, J. R., Morris, M., Becklin, E. E., & Duchêne, G. 2005, ApJ, 620, ?
- Guesten et al. (1987) Guesten, R., Genzel, R., Wright, M. C. H., Jaffe, D. T., Stutzki, J., & Harris, A. I. 1987, ApJ, 318, 124
- Hansen & Milosavljevic (2003) Hansen, B. M. S., & Milosavljevic, M. 2003, ApJ, 593, L77
- Hildebrand (1983) Hildebrand., R. H. 1983, QJRAS, 24, 267
- Jackson et al. (1993) Jackson, J. M., Geis, N., Genzel, R., Harris, A. I., Madden, S., Poglitsch, A., Stacey, G. J., & Townes, C. H. 1993, ApJ, 402, 173
- Kaifu et al. (1987) Kaifu, N., Hayashi, M., Inatani, I., & Gatley, I. 1987, in AIP Conf. Proc. 155: The Galactic Center, 106-
- Kim et al. (2004) Kim, S. S., Figer, D. F., & Morris, M. 2004, ApJ, 607, L123
- Kim & Morris (2003) Kim, S. S., & Morris, M. 2003, ApJ, 597, 312
- Krabbe et al. (1991) Krabbe, A., Genzel, R., Drapatz, S., & Rotaciuc, V. 1991, ApJ, 382, L19
- Krabbe et al. (1995) Krabbe, A., Genzel, R., Eckart, A., Najarro, F., Lutz, D., Cameron, M., Kroker, H., Tacconi-Garman, L. E., Thatte, N., Weitzel, L., Drapatz, S., Geballe, T., Sternberg, A., & Kudritzki, R. 1995, ApJ, 447, L95+
- Lacy et al. (1991) Lacy, J. H., Achtermann, J. M., & Serabyn, E. 1991, ApJ, 380, L71
- Liszt & Burton (1978) Liszt, H. S. & Burton, W. B. 1978, ApJ, 226, 790
- Lo & Claussen (1983) Lo, K. Y. & Claussen, M. J. 1983, Nature, 306, 647
- Lugten et al. (1986) Lugten, J. B., Genzel, R., Crawford, M. K., & Townes, C. H. 1986, ApJ, 306, 691
- Maillard et al. (2004) Maillard, J. P., Paumard, T., Stolovy, S. R., & Rigaut, F. 2004, å, 423, 155
- Marr et al. (1993) Marr, J. M., Wright, M. C. H., & Backer, D. C. 1993, ApJ, 411, 667
- Marshall et al. (1995) Marshall, J., Lasenby, A. N., & Harris, A. I. 1995, MNRAS, 277, 594
- Menon & Ciotti (1970) Menon, T. K. & Ciotti, J. E. 1970, Nature, 227, 579
- Mezger et al. (1989) Mezger, P. G., Zylka, R., Salter, C. J., Wink, J. E., Chini, R., Kreysa, E., & Tuffs, R. 1989, A&A, 209, 337
- Mitchell & Deveau (1983) Mitchell, G. F. & Deveau, T. J. 1983, ApJ, 266, 646
- Morris & Serabyn (1996) Morris, M. & Serabyn, E. 1996, ARA&A, 34, 645
- Muno et al. (2003) Muno, M. P., Baganoff, F. K., Bautz, M. W., Brandt, W. N., Broos, P. S., Feigelson, E. D., Garmire, G. P., Morris, M. R., Ricker, G. R., & Townsley, L. K. 2003, ApJ, 589, 225
- Nyman (1983) Nyman, L.-A. 1983, A&A, 120, 307
- Oort (1977) Oort, J. H. 1977, ARA&A, 15, 295
- Park et al. (1999) Park, Y.-S., Kim, J., & Minh, Y. C. 1999, ApJ, 520, 223
- Paumard et al. (2001) Paumard, T., Maillard, J. P., Morris, M., & Rigaut, F. 2001, A&A, 366, 466
- Portegies Zwart et al. (2003) Portegies Zwart, S. F., McMillan, S. L. W., & Gerhard, O. 2003, ApJ, 593, 352
- Reid (1993) Reid, M. J. 1993, ARA&A, 31, 345
- Reid et al. (1999) Reid, M. J., Readhead, A. C. S., Vermeulen, R. C., & Treuhaft, R. N. 1999, ApJ, 524, 816
- Roberts & Goss (1993) Roberts, D. A. & Goss, W. M. 1993, ApJS, 86, 133
- Sanders (1998) Sanders, R. H. 1998, MNRAS, 294, 35
- Sault et al. (1995) Sault, R. J., Teuben, P. J., & Wright, M. C. H. 1995, in ASP Conf. Ser. 77: Astronomical Data Analysis Software and Systems IV, Vol. 4, 433–+
- Scoville (1972) Scoville, N. Z. 1972, ApJ, 175, L127+
- Scoville et al. (1993) Scoville, N. Z., Carlstrom, J. E., Chandler, C. J., Phillips, J. A., Scott, S. L., Tilanus, R. P. J., & Wang, Z. 1993, PASP, 105, 1482
- Scoville et al. (2003) Scoville, N. Z., Stolovy, S. R., Rieke, M., Christopher, M. H., & Yusef-Zadeh, F. 2003, ApJ, 594, 294
- Serabyn et al. (1986) Serabyn, E., Guesten, R., Walmsley, J. E., Wink, J. E., & Zylka, R. 1986, A&A, 169, 85
- Serabyn & Lacy (1985) Serabyn, E. & Lacy, J. H. 1985, ApJ, 293, 445
- Shukla et al. (2004) Shukla, H., Yun, M. S., & Scoville, N. Z. 2004, ApJ, 616, 231
- Stolovy (1997) Stolovy, S. R. 1997, Ph.D. Thesis
- Tamblyn et al. (1996) Tamblyn, P., Rieke, G. H., Hanson, M. M., Close, L. M., McCarthy, D. W., & Rieke, M. J. 1996, ApJ, 456, 206
- Telesco et al. (1996) Telesco, C. M., Davidson, J. A., & Werner, M. W. 1996, ApJ, 456, 541
- Tsuboi et al. (1988) Tsuboi, M., Handa, T., Inoue, M., Ukita, N., & Takano, T. 1988, PASJ, 40, 665
- Vogel & Welch (1983) Vogel, S. N. & Welch, W. J. 1983, ApJ, 269, 568
- Vollmer & Duschl (2000) Vollmer, B. & Duschl, W. J. 2000, New Astronomy, 4, 581
- Vollmer & Duschl (2001) —. 2001, A&A, 367, 72
- Wright & Backer (1993) Wright, M. C. H. & Backer, D. C. 1993, ApJ, 417, 560
- Wright et al. (2001) Wright, M. C. H., Coil, A. L., McGary, R. S., Ho, P. T. P., & Harris, A. I. 2001, ApJ, 551, 254
- Yusef-Zadeh et al. (1999) Yusef-Zadeh, F., Roberts, D. A., Goss, W. M., Frail, D. A., & Green, A. J. 1999, ApJ, 512, 230
- Yusef-Zadeh et al. (2001) Yusef-Zadeh, F., Stolovy, S. R., Burton, M., Wardle, M., & Ashley, M. C. B. 2001, ApJ, 560, 749
| Configuration | Largest | Date | Usable | Source | 3c273 | 3c354.4 |
|---|---|---|---|---|---|---|
| Baseline | Baselines | Integration Time | Flux | Flux | ||
| (m) | (minutes) | (Jy) | (Jy) | |||
| L | 115.0 | 1999 Nov 13 | 15 | 114 | - | 7.0 |
| 2000 Apr 25 | 14 | 140 | 9.0 | 6.0 | ||
| E | 119.3 | 2000 Mar 16 | 15 | 140 | 9.1 | 7.2 |
| 2000 Mar 17 | 15 | 136 | 9.1 | 7.2 | ||
| H | 241.7 | 1999 Dec 17 | 15 | 140 | 9.8 | 8.5 |
| 2000 Jan 4 | 8 | 70 | 9.8 | 8.5 | ||
| 2000 Jan 5 | 15 | 139 | 9.8 | 8.5 | ||
| 2000 Jan 8 | 15 | 140 | 9.8 | 8.5 | ||
| U | 483.3 | 2000 Feb 6 | 15 | 130 | 9.5 | 9.0 |
| 2000 Feb 8 | 15 | 120 | - | 9.0 |
| (1) | (2) | (3) | (4) | (5) | (6) | (7) | (8) | (9) | (10) | (11) | (12) | (13) | (14) | (15) |
|---|---|---|---|---|---|---|---|---|---|---|---|---|---|---|
| Core | RA | Dec | Proj. | Deproj. | Size | Cent. | Vel. | Virial | Opt. Thin | Virial | Opt. Thin | Min Stable | ||
| ID | Offset | Offset | Dist. | Dist. | FWHM | Vel. | FWHM | Mass | Mass | Mass | Dens | Dens | Dens | Dens |
| (″ from ) | (pc) | (pc) | (pc) | (km/s) | () | () | ||||||||
| A | 9.2 | 32.0 | 1.29 | 1.34 | 0.17 | 107 | 30.9 | 16.55 | 15.04 | 0.90 | 91.60 | 83.23 | 4.98 | 18.83 |
| B | 10.8 | 40.0 | 1.61 | 1.68 | 0.27 | 139 | 31.6 | 27.33 | 38.53 | 1.85 | 38.04 | 53.64 | 2.57 | 10.70 |
| C | 24.0 | 40.8 | 1.84 | 1.86 | 0.34 | 105 | 43.7 | 65.63 | 83.82 | 8.24 | 46.37 | 59.22 | 5.82 | 8.30 |
| D | 27.6 | 34.8 | 1.72 | 1.86 | 0.43 | 101 | 45.5 | 88.84 | 135.96 | 10.92 | 32.29 | 49.41 | 3.97 | 8.34 |
| E | 25.2 | 26.8 | 1.43 | 1.62 | 0.22 | 78 | 30.8 | 20.92 | 24.32 | 2.85 | 55.97 | 65.06 | 7.62 | 11.59 |
| F | 48.8 | 26.0 | 2.14 | 3.10 | 0.28 | 72 | 20.0 | 11.22 | 25.49 | 2.55 | 14.65 | 33.28 | 3.33 | 2.55 |
| G | 50.0 | 8.8 | 1.97 | 3.42 | 0.29 | 65 | 13.1 | 4.98 | 18.05 | 1.80 | 5.76 | 20.87 | 2.08 | 2.05 |
| H | 22.0 | -0.8 | 0.85 | 1.61 | 0.24 | -17 | 17.3 | 7.10 | 15.78 | 0.74 | 15.33 | 34.05 | 1.60 | 11.87 |
| I | 22.0 | -10.0 | 0.94 | 1.87 | 0.26 | -18 | 15.0 | 5.77 | 16.12 | 1.23 | 9.68 | 27.06 | 2.06 | 8.15 |
| J | 4.8 | -25.2 | 0.99 | 1.42 | 0.25 | -37 | 11.7 | 3.41 | 11.72 | 1.69 | 6.41 | 22.01 | 3.16 | 16.29 |
| K | 2.4 | -32.8 | 1.28 | 1.67 | 0.25 | -71 | 24.5 | 15.27 | 25.67 | 2.06 | 26.76 | 44.99 | 3.60 | 10.81 |
| L | 1.6 | -33.2 | 1.29 | 1.66 | 0.19 | -38 | 12.6 | 3.06 | 7.51 | 0.78 | 12.52 | 30.77 | 3.21 | 11.02 |
| M | -3.2 | -37.6 | 1.46 | 1.70 | 0.26 | -64 | 19.0 | 9.49 | 21.47 | 2.29 | 14.78 | 33.43 | 3.56 | 10.28 |
| N | -16.4 | -43.6 | 1.81 | 1.82 | 0.22 | -64.5 | 14.7 | 4.78 | 11.59 | 0.93 | 12.83 | 31.15 | 2.50 | 8.73 |
| O | -21.2 | -34.4 | 1.57 | 1.60 | 0.33 | -108 | 36.5 | 43.96 | 64.58 | 9.23 | 35.04 | 51.48 | 7.36 | 12.04 |
| P | -21.2 | -24.8 | 1.27 | 1.39 | 0.21 | -73 | 28.2 | 16.80 | 20.49 | 2.34 | 50.82 | 62.00 | 7.06 | 16.93 |
| Q | -26.8 | -20.0 | 1.3 | 1.68 | 0.37 | -38 | 12.6 | 5.97 | 28.69 | 2.72 | 3.28 | 15.74 | 1.49 | 10.69 |
| R | -18.0 | -7.6 | 0.76 | 1.16 | 0.14 | -37 | 12.2 | 2.02 | 3.66 | 0.24 | 22.91 | 41.63 | 2.77 | 27.06 |
| S | -23.2 | -6.0 | 0.93 | 1.55 | 0.32 | 89 | 34.4 | 37.56 | 56.18 | 2.67 | 33.81 | 50.57 | 2.40 | 12.96 |
| T | -24.0 | -5.6 | 0.96 | 1.62 | 0.24 | 44 | 33.5 | 26.39 | 30.08 | 1.45 | 58.23 | 66.36 | 3.19 | 11.73 |
| U | -16.8 | -5.6 | 0.69 | 1.10 | 0.24 | 79 | 34.7 | 29.01 | 32.65 | 1.91 | 59.71 | 67.20 | 3.93 | 30.90 |
| V | -10.8 | 10.8 | 0.59 | 1.13 | 0.19 | 58 | 24.2 | 11.27 | 14.59 | 2.42 | 45.11 | 58.41 | 9.70 | 28.95 |
| W | -7.6 | 23.2 | 0.95 | 1.47 | 0.22 | 56 | 27.9 | 17.25 | 22.30 | 2.07 | 45.28 | 58.52 | 5.44 | 14.89 |
| X | -24.4 | 27.2 | 1.42 | 2.67 | 0.16 | 64 | 28.4 | 13.04 | 12.05 | 0.75 | 88.59 | 81.85 | 5.12 | 3.57 |
| Y | -18.8 | 39.2 | 1.69 | 2.82 | 0.21 | 78 | 35.3 | 25.90 | 24.88 | 0.94 | 91.92 | 78.71 | 2.97 | 3.15 |
| Z | -3.6 | 40.4 | 1.57 | 2.08 | 0.24 | 58 | 39.6 | 37.63 | 37.00 | 2.37 | 78.22 | 76.91 | 4.93 | 6.33 |
| Mean Core | 1.32 | 1.80 | 0.25 | 26.1 | 21.20 | 30.70 | 2.61 | 37.92 | 49.91 | 4.09 | 12.26 | |||