SPECTROSCOPIC IDENTIFICATION OF A PROTO-CLUSTER AT : ENVIRONMENTAL DEPENDENCE OF GALAXY PROPERTIES AT HIGH REDSHIFT
Abstract
We have discovered a highly significant over-density of galaxies at in the course of a redshift survey designed to select star-forming galaxies in the redshift range in the field of the bright QSO HS1700+643. The structure has a redshift-space galaxy over-density of and an estimated matter over-density in real space of , indicating that it will virialize by with a mass scale of M☉, that of a rich galaxy cluster. Detailed modeling of the spectral energy distribution– from the rest-far-UV to the rest-near-IR – of the 72 spectroscopically confirmed galaxies in this field for which we have obtained and Spitzer/IRAC photometry, allows for a first direct comparison of galaxy properties as a function of large-scale environment at high redshift. We find that galaxies in the proto-cluster environment have mean stellar masses and inferred ages that are times larger (at ) than identically UV-selected galaxies outside of the structure, and show that this is consistent with simple theoretical expectations for the acceleration of structure formation in a region that is over-dense on large scales by the observed amount. The proto-cluster environment contains a significant number of galaxies that already appear old, with large stellar masses ( M☉), by .
Subject headings:
cosmology: observations — galaxies: evolution — galaxies: high-redshift — galaxies: clusters1. Introduction
The process of galaxy formation is almost universally acknowledged to be dependent on large-scale environment, with the regions of the universe that are most dense on large scales expected to be the sites of the earliest galaxy formation. In the present-day universe, regions that were over-dense on Mpc scales at high redshift have virialized to become rich galaxy clusters, harboring much more than their fair share of galaxies with the largest stellar masses and (apparently) the oldest luminosity-weighted stellar ages (e.g., Hogg et al. 2003). Measurements of galaxy clustering statistics at low (e.g., Budavári et al. 2003), intermediate (e.g., Coil et al. 2004) and high (e.g., Daddi et al. 2003; Adelberger et al. 2004a, 2005) redshift all indicate highly significant differences in clustering amplitude as a function of galaxy color and/or rest-frame optical luminosity, in the sense that redder (older) and more optically luminous (larger stellar mass) galaxies are more strongly clustered. There has been a vast literature over the past years focused on the properties of early type galaxies, both in clusters (e.g., Faber 1973; Bower et al. 1992; Ellis et al. 1997; Stanford et al. 1998; van Dokkum et al. 2001; Holden et al. 2004) at low and intermediate redshifts and in the “field” (e.g., Treu et al. 1999; Kochanek et al. 2000; van Dokkum et al. 2003), attempting to establish the formation epochs of these galaxies and the differences, if any, as a function of environment (e.g., Thomas et al. 2005). Virtually all of these studies find that early type galaxies must have formed most of their stars early () and that they have evolved largely passively since that time. There is less agreement about the extent to which the galaxies’ history depends on environment, and what low or intermediate redshift results imply about the scatter in ages within clusters or the difference between clusters and lower density environments. One of the issues that undoubtedly clouds the debate is what constitutes an “early-type” galaxy or even a “cluster”. Most of the galaxies studied have been selected to have the morphological appearance of early type galaxies, possibly leading to different subsets of galaxies being selected at different epochs (called “progenitor bias” by van Dokkum et al. 2000).
Very recently, considerable attention has been directed to photometric and spectroscopic surveys of galaxies at high redshifts () that are bright and/or red at rest-frame optical wavelengths (e.g., Franx et al. 2003; Abraham et al. 2004; Cimatti et al. 2004; McCarthy et al. 2004), as might be expected for passively evolving galaxies at high redshifts. A general conclusion seems to be that passively evolving galaxies with large stellar masses ( M☉) are present out to with a number density roughly similar to that observed locally. The inferred star formation histories for these galaxies imply that most of the stars formed prior to , in good agreement with inferences based on the evolution in the fundamental plane of cluster ellipticals to (e.g., Holden et al. 2004). However, the number of spectroscopically identified massive galaxies in these new spectroscopic surveys is far too small to establish their large-scale context.
At present, the only spectroscopic samples of galaxies at that are large enough for a direct comparison of galaxy properties as a function of environment are those that are selected by color in the rest-UV (e.g., Steidel et al. 2003, 2004). Obviously, such samples depend on galaxies having enough current (relatively unobscured) star formation to be identified as a candidate for spectroscopy, which will produce a bias against both passively evolving galaxies and galaxies that are heavily reddened by dust (cf. Daddi et al. 2004). However, the rest-UV-selected surveys do turn up substantial numbers of galaxies with M☉ whose physical properties are plausibly consistent with those observed in the rest-optically selected surveys (Shapley et al. 2004, 2005; Adelberger et al. 2005). Adelberger et al. (2004a) have argued, based on their number density and clustering properties, that the galaxies present in the spectroscopic UV-selected samples at are likely to be the general progenitors of what would be called “red” galaxies at and “early-type” galaxies by , independent of environment. Moreover, the surveys are tuned to be sensitive to star-forming galaxies during the epoch when the bulk of star formation in massive early-type cluster galaxies is inferred to have occurred. With the advent of the Spitzer Space Telescope and its capability of obtaining high-quality photometry in the rest-frame near-IR at using the IRAC instrument (Fazio et al. 2004), it is now possible to obtain relatively reliable measures of stellar population parameters, particularly stellar masses, when combined with information available from large ground-based telescopes.
In this paper, we analyze results from a spectroscopic survey in which we have discovered a significant redshift-space over-density of galaxies at . While the characterization of galaxy over-densities at high redshift is being pursued using similar spectroscopic samples (e.g., Steidel et al. 1998) and through targeted observations of likely proto-cluster regions marked by high redshift radio galaxies (e.g., Kurk et al. 2000; Venemans et al. 2002) or multiple sub-mm-selected galaxies (Blain et al. 2004), the combination of spectroscopic and photometric data available in the field of QSO HS1700+643 (notably, the availability of Spitzer data) provides an unprecedented view of the properties of both the proto-cluster galaxies and their larger-scale context at high redshift: because the selection function of our spectroscopic sample is broad and is roughly centered on the redshift of the over-density, we are able to directly compare the overall properties of similarly-selected galaxies within and outside of a structure that (we argue) will become a rich galaxy cluster by the present epoch. The relative insensitivity of our rest-UV selection criteria to stellar mass or star formation age offers a distinct advantage in this case: the spectroscopic sample, covering the redshift range (mean and standard deviation) in the HS1700+643 field, offers a relatively unbiased view of the progress of galaxy evolution within and outside of the large structure. We show, using the results of detailed modeling presented in Shapley et al. (2005), that there are already clear differences in the progress of galaxy evolution between the proto-cluster and “field” environment at , when the Universe was 2.8 Gyr old. Large scale environment, and not redshift, is likely to be the primary factor determining the maturity of massive galaxies in the distant universe.
We assume a cosmology with , , and throughout.
2. Observations and the Galaxy Sample
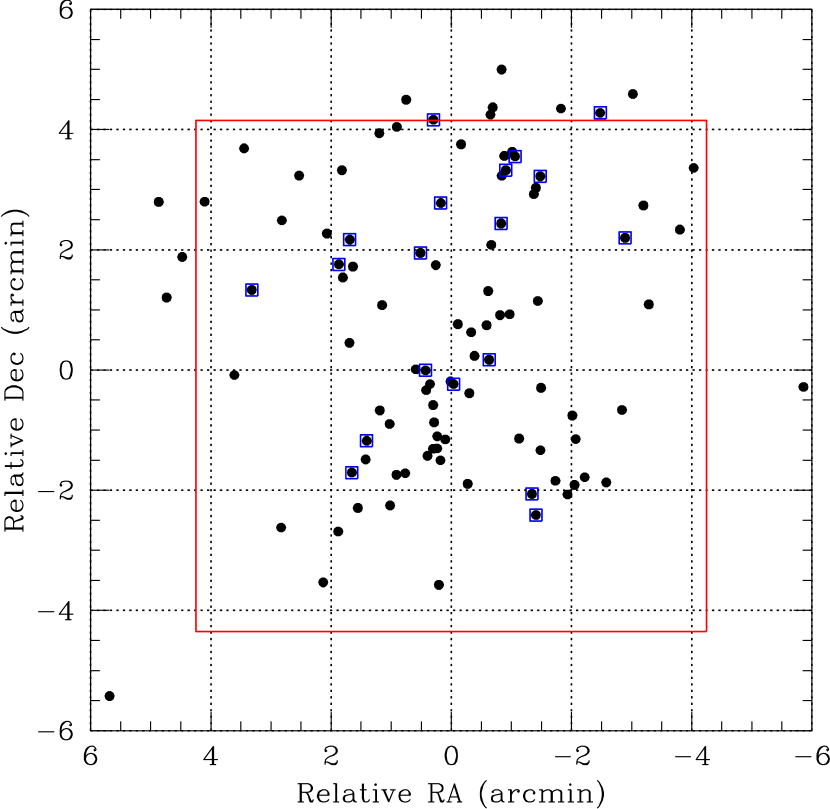
The spectroscopic observations in the HS1700+643 field were obtained as part of a survey designed to simultaneously explore both star-forming galaxies at and the interaction between the galaxies and the intergalactic medium (IGM) in the same volumes of space. The initial results of the general spectroscopic survey are described by Steidel et al. (2004), and the full results of the sub-sample in the HS1700 field, including a description of all of the photometric observations, are presented by Shapley et al. (2005). Because the redshift of HS1700+643 is , we used optical photometric criteria that would sample galaxies with , i.e., foreground to the QSO; thus we used a combination of the “BX” criteria of Adelberger et al. (2004b) () and the “MD” criteria of Steidel et al. (2003) (). Accounting for the 4.5:1 ratio in the number of spectroscopically identified BX and MD candidates to (the actual ratio of photometric candidates is 6:1 to the same apparent magnitude limit), the expected redshift distribution for a random spectroscopic sample would be , based on the overall observed redshift selection functions of BX and MD candidates in all survey fields. A total of 100 spectroscopic redshifts in the range has been obtained in this field to date, with the redshift distribution (shown in figure 1) of (mean and standard deviation), entirely consistent with the expectations based on the overall redshift selection functions of the BX/MD candidates. The distribution of observed galaxies on the plane of the sky is strongly concentrated within arcmin of the line of sight to HS1700+64, as shown in figure 2, largely dictated by geometric constraints of the LRIS slitmasks used for the spectroscopic observations given our emphasis on galaxies near the QSO sightline.
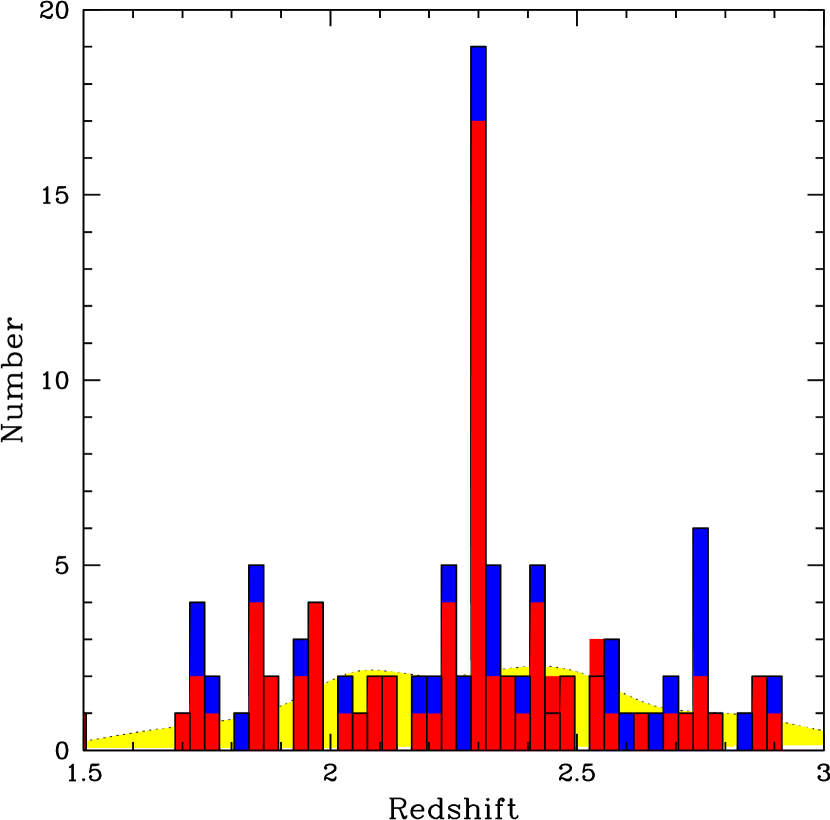
The galaxies with spectroscopic redshifts represent a very small fraction of the photometric candidates in the field, which total 1711 BX+MD objects to over the full 15 by 15 field. Within the region of the field that has also been observed in the band (figure 2), the fraction of candidates with spectroscopic identifications is % (98/508, of which 84 have 111Within the same region, a total of 162 objects was observed spectroscopically, so that 60.5% of objects attempted yielded redshifts. This fraction is very close to the overall fraction of “BX” candidates that yield redshifts in the full spectroscopic sample. As discussed by Steidel et al. (2004), failures to measure redshifts result from inadequate S/N after 90 minutes of integration (often dominated by masks observed under marginal conditions). Deeper spectroscopic observations show that the initial failures have the same redshift distribution as those that are successful on a first pass. and the fraction of -detected candidates with redshifts is % (92/389, of which 79 have ). Because the remainder of the discussion of the galaxies in the field depends on the longer wavelength and IRAC data, hereinafter we focus only on the sample of 72 galaxies with spectroscopic redshifts that are also detected in both and at least one IRAC band (see Shapley et al. (2005)). The redshift distribution for this sub-sample is shown in figure 1 as the red histogram in the foreground. It is important to note that the galaxies were chosen for spectroscopic observation without regard to anything but position relative to the QSO sightline and optical magnitudes and colors. Also shown in figure 1 is the redshift distribution expected for a sample of 72 galaxies drawn from a BX+MD-selected sample with the observed BX/MD ratio. This distribution, which is that expected in the absence of clustering, will be used to evaluate the significance of the over-density in §3.
All of the photometric measurements and inferred stellar population parameters for the 72 galaxies in the sample are taken directly from Shapley et al. (2005).
3. Results
3.1. Quantifying the Over-density
As shown in figure 1, there is an obvious galaxy concentration at in the HS170064 field, evident both in the subset of galaxies in the /IRAC observed region of the field and in the larger optical field. We estimate the significance of the spike using the method described in Steidel et al. (1998). Briefly, we consider every pair of galaxies in turn, calculate the redshift difference between them and count the number of additional galaxies whose redshifts lie between the redshifts of the pair. Regions where a large number of galaxies appear in a small redshift interval are identified as possible clusters. The strength of each cluster is quantified with a statistic, (see Steidel et al. 1998). We then focus our attention on the cluster candidate with the smallest value of (i.e., with redshifts that are most inconsistent with a random distribution), and calculate the significance of the cluster by analyzing numerous randomized galaxy catalogs in the same way and counting how frequently a value of so small (or smaller) appears.
This approach isolates the region between and (i.e., ) as the most significant over-density in our data, containing 17 galaxies within the region observed with IRAC. Over-densities with smaller values of occurred in only 28 of 50000 randomized catalogs, so we conclude with much greater than % confidence that this spike is inconsistent with a random distribution of galaxy redshifts. The shape of our selection function, also shown in figure 1, implies that we should expect an average of roughly 1.9 galaxies in this redshift interval. Our observed number, 17, therefore corresponds to a galaxy over-density in redshift space of if we assume Poisson uncertainties and neglect the two galaxies whose redshifts defined the cluster boundary (Steidel et al. 1998).
3.2. Environmental Dependence of Galaxy Properties
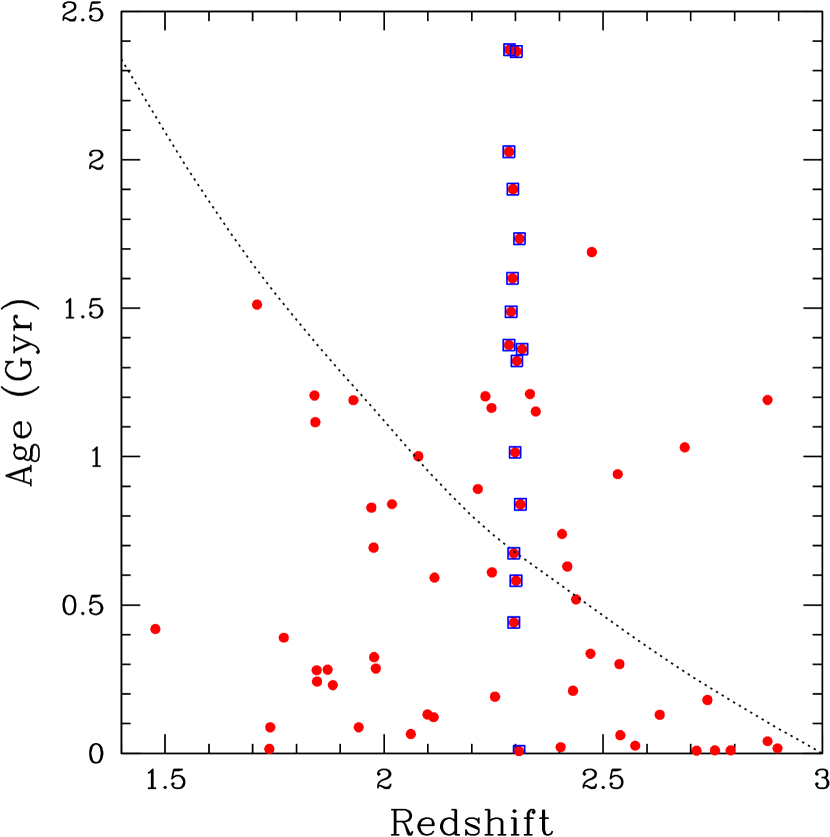
Shapley et al. (2005) present the full population synthesis modeling of the broad-band spectral energy distributions from rest-frame far-UV to the rest-frame near-IR for the full sample of 72 galaxies considered here, resulting in the most robust measurements of stellar population parameters to date for star-forming galaxies at . Using these results, we search for possible differences in the galaxy properties within and outside of the identified over-density. Figure 3 shows the inferred stellar masses and ages for the 72 galaxies in our sample as a function of redshift, taken from Shapley et al. (2005). The inferred ages of galaxies within the “spike” clearly stand out above the rest, with a much larger proportion of old ages compared to those outside the over-density. For constant star formation (CSF) models, the average galaxy age within the spike is Myr, compared to Myr in the “field”222By “field” we mean simply the 55 galaxies in the spectroscopic sample that lie outside of the redshift range containing the “spike”. , which if taken literally implies average “formation” redshifts of and , respectively. A 2-sample Kolmogorov-Smirnov test on the CSF model ages yields a probability of only that the age distributions are the same inside and outside of the “spike”. As discussed extensively in Shapley et al. (2005) in the context of the current galaxy sample, the luminosity-weighted age is not a quantity which is well-determined from population synthesis models, particularly for star-forming galaxies when the “current” star formation rate is high compared to the past average. It is generally possible to make the inferred age of a galaxy significantly younger by assuming an exponentially declining star formation rate with an e-folding time . For the best-fit model applied to each galaxy in the sample, the average galaxy ages are Myr inside the spike and Myr outside, and the K-S test returns a probability of that the age distributions are the same. Thus, while the true star formation histories of the galaxies both within and outside of the over-density are almost certainly more complicated than the assumed models, and the ages of individual galaxies remain uncertain (Shapley et al. 2005), there is a clear difference in the age-sensitive spectral signatures between the two sub-samples in the sense that proto-cluster galaxies are significantly older.
The differences in age are accompanied by significant differences in stellar mass, which are much less dependent on the assumed star formation histories (right-hand panel of figure 3)333As discussed extensively in Shapley et al. (2005), there remains the possibility of systematic underestimates of total stellar mass whose maximum amplitude depends on the observed galaxy color (under-estimates could be larger for bluer galaxies). In principle it is possible that the stellar masses are comparable inside and outside the over-density, but the observed differences instead reflect the level of dominance of the current episode of star formation over the integral of past star formation. However, since the UV luminosities and inferred star formation rates are similar inside and outside the “spike”, this interpretation would require more extreme differences in star formation history than the more plausible scenario that both the stellar masses and ages differ. with the bluest galaxies Both the CSF and fits imply that galaxies inside the spike have mean stellar masses roughly twice as large as those outside. A 2-sample K-S test rules out a similar stellar mass distribution at the % level. In contrast, as we will shortly show, the total masses of galaxies inside and outside the spike should be roughly the same. We can therefore conclude that galaxies inside the spike have converted a much larger fraction of their baryons into stars than have those outside, presumably because they have had more time to do so. A naive interpretation of figure 3 suggests that a typical “field” galaxy will reach the same level of maturity at that has been attained by a proto-cluster galaxy at .
3.3. Theoretical Expectations
A generic expectation of popular galaxy formation models is that galaxies inside large-scale over-densities should be older than those outside, since galaxy-scale matter fluctuations inside the over-densities are sitting on a large-scale pedestal and can more easily cross the threshold for collapse. The theoretically expected difference in galaxy ages can be crudely estimated as follows. Given the estimate (Adelberger et al. 2004) for the galaxy bias in the BX sample, we use the approach of Steidel et al. (1998) to estimate the true mass over-density . This quantity is related to the observed redshift-space over-density through the expression , where is an estimate of the effects of redshift-space distortions caused by peculiar velocities, which is itself a function of both and . In the present case, Mpc3 is the co-moving volume in which the measurement is being made, bounded by the 85 by 85 region on the plane of the sky and the co-moving distance, neglecting peculiar velocities, between and . A crude approximation for the volume correction factor (see Steidel et al. 1998) is given by where , which we take to be at . From these equations, one obtains for , and . To evaluate the linear over-density relevant to the rest of the discussion, we use the approximation for spherical collapse from Mo & White (1996) (their equation 18), which for gives as the linear matter over-density in real space of the spike.
If we imagine, for simplicity, that star formation begins at initial virialization, the Myr inferred age for field galaxies at (for constant star formation models; Shapley et al. (2005)) implies that their typical virialization redshift was . These galaxies therefore have a linear over-density at redshift of . The same galaxies would have linear over-densities of if they were within the spike. This corresponds to a virialization redshift for spike galaxies of , or . The implied typical age of spike galaxies would be expected to be Myr, or roughly twice the age of field galaxies. If the typical age of field galaxies is half as large, i.e., Myr, the same arguments imply an age for spike galaxies of Myr. We would therefore expect galaxies within the spike to be roughly 2–3 times older than those outside. As discussed above, the data support these naive expectations.
Our claim above that the total masses of the galaxies should be similar within and outside the over-density follows from the extended Press-Schechter formalism. If represents the Press-Schechter mass function in a large region with (Eulerian) over-density , then is related to the standard Press-Schechter mass function via
| (1) |
where , , and is the r.m.s. fluctuation when the linear density field is smoothed on mass-scale (e.g., Mo & White 1996; see their equations 19 and 20). If we assume that the galaxies in our survey are associated with halos with dark mass (Adelberger et al. 2004a), the expected mean halo mass inside and outside the spike differ by only % for .
3.4. The Fate of the Spike
We turn now to the question of what the spike will have become by redshift . Evolved forward in an , cosmology, its linear over-density of at corresponds to a linear over-density of at . Since this exceeds the collapse threshold , we expect the spike to have virialized by . The mass of the virialized object is easy to calculate. The approach of Steidel et al. (1998) implies that the spike is associated with an Eulerian matter over-density of at , so its mass is where is the mean co-moving matter density and Mpc3 is approximately the volume within the observed over-density, corrected for the effects of peculiar velocities using the factor from above. We conclude that the spike is likely to evolve into a relatively massive cluster by . Our observations therefore imply that at least some clusters already contained old galaxies with large stellar masses by , in good agreement with inferences based on studies of cluster ellipticals at zero-to-moderate redshifts.
3.5. Proto-Cluster Completeness
Our census of galaxies within the proto-cluster is far from complete. Because the spectroscopic completeness of BX/MD galaxy candidates detected to is only % within the arcmin2 region considered here, and the galaxies in the spectroscopic sample have been observed without regard to their near-IR properties, we expect that the total number of “spike” galaxies with properties similar to those observed and within the same solid angle is . It is difficult to estimate the number of galaxies that are within the “spike” but not selected by our rest-UV color criteria; crude estimates of the completeness with respect to all relatively massive galaxies present at suggest that there could be another factor of in galaxies that have similar masses to the ones that are selected (Shapley et al. 2005; Reddy et al. 2005). Redshift estimates based on photometry, even when the IRAC bands are included, are too uncertain () to assign galaxies to a particular structure in redshift space, and spectroscopy will be difficult or impossible for galaxies with no current star formation at using current-generation telescopes and instruments. It is possible that there could be a significant number of massive but quiescent red galaxies associated with the “spike” that would make the differences between the proto-cluster and “field” environments still more significant at .
The angular scale of the observed field was set (rather arbitrarily) by the size of the available field with the WIRC near-IR imager and LRIS. As shown in figure 2, the “spike” objects are not obviously distributed differently on the plane of the sky than the “field” objects–a 2-D, 2-sample K-S test gives a probability of 17% that the proto-cluster and “field” galaxy sky distributions are the same. There is no evidence that the observed region has included the whole structure, or even that it is roughly centered on the structure, although the angular extent of the observed field (corresponding to a co-moving transverse scale of Mpc at ) is roughly the co-moving scale expected for a proto-cluster. The current observational situation for the HS1700+64 over-density is similar to earlier observations of the structure in the SSA22 field (Steidel et al. 1998, 2000), where the field size for the initial discovery was also and where a similar redshift-space over-density in both LBGs and Lyman emitters was found. Subsequent analysis of narrow-band Lyman images over a much larger field by Hayashino et al. (2004) has shown that the initial SSA22 pointing was indeed the densest proto-cluster-sized sub-region within a large-scale structure extending over a Mpc co-moving scale.
The structure, which (as for the higher-redshift SSA22 example) was discovered serendipitously within a redshift survey, might also be compared to more “pointed” observations surrounding high-redshift radio galaxies. Perhaps most comparable is PKS 1138262 (), which has been studied using narrow-band Lyman imaging and spectroscopy (Kurk et al. 2000; Pentericci et al. 2000), narrow-band H imaging (Kurk et al. 2004a), and broad-band near-IR photometry (Kurk et al. 2004b). While a considerable number of objects associated with the radio galaxy have been identified, the pointed nature of the observations makes an evaluation of the significance of the numbers difficult to evaluate; Kurk et al. (2004b) estimate the over-density of Lyman emitters in redshift space to be somewhat smaller than that found in the SSA22 field at by Steidel et al. (2000), evaluated over a somewhat smaller field but a very similar redshift range. An evaluation of the implied mass scale of the 1138262 structure444There is an error in Kurk et al. (2004b) in calculating the value of , which for their assumed cosmology should be M☉, not M☉., calculated in a manner consistent with that used above for the HS170064 proto-cluster, yields M☉ for the PKS 1138262 structure, with an associated linear matter over-density of .
To date, the structure in SSA22 and the structure in the HS1700+643 field are the most statistically significant cluster-scale over-densities known at redshifts . While the implied over-densities may be somewhat larger than in the radio galaxy fields, the real difference is that identification of the structures within a controlled redshift survey provides a more direct means of measuring the redshift-space over-density and estimating the true matter over-density. These quantities require knowledge of both the mean density of objects that are being used as a “tracer”, and their bias with respect to matter fluctuations. The more general surveys also offer the possibility of examining galaxy properties over the full dynamic range of environment, from proto-cluster to proto-void.
4. Summary and Discussion
We have shown that the HS1700+643 field contains a highly significant over-density ( in redshift space) of galaxies at . A crude analysis of this structure indicates that it has a mass scale of M⊙and that it will become a rich cluster of galaxies by . While it is not the highest redshift “proto-cluster” identified to date, its significance is more easily established because the redshift survey in which it was discovered provides the context necessary for estimating the associated matter over-density. The presence of the “proto-cluster” embedded within the redshift survey allows us to make the first direct assessment of the differences in galaxy properties as a function of environment at high redshift, using mid-IR observations from Spitzer/IRAC together with extensive ground-based data. Galaxies within the proto–cluster have mean inferred stellar masses a factor of times higher and mean inferred ages times older than similarly-UV-selected galaxies in the “field”. This lends support to a simple theoretical picture in which the main difference between dense environments and the “field” is an earlier virialization time and hence a larger stellar mass fraction at a given cosmic time.
The differences in inferred age between the proto-cluster and “field” environment, while highly significant at , would be relatively subtle by , where (average) age differences of Gyr relative to ages in the range Gyr would probably be “in the noise” of spectroscopic or photometric age dating for local early-type galaxies (e.g., Hogg et al. 2004). Another complication in comparing the high redshift results with local ones is that even galaxies inhabiting environments that we call the “field” at may have descendants that find themselves in relatively dense environments (even if they are not in clusters) by (e.g., Baugh et al. 1998; Adelberger et al. 2004a); here it would be important to quantify the local density for “field” ellipticals in order to reconcile the high-redshift results with those based on the “fossil record”. It would require a substantial leap of faith to connect the galaxies with lower-redshift descendants of a particular morphology (e.g., “early type galaxies”); however, the ages and stellar masses of the UV-selected denizens of the HS1700+643 protocluster seem consistent both with expectations based on the empirical fossil record and with the generic expectations of hierarchical structure formation.
The results presented above show that, at least at , a significant fraction
of objects destined for rich cluster environments are still forming stars, and that
selection in the rest-UV, which is largely independent of past star formation
(Shapley et al. 2005),
is an effective and efficient means of assembling samples of galaxies that allow
quantitative assessment of the dependence of galaxy properties on environment.
Structures like the proto-cluster in the HS1700+643 field offer many
opportunities for focused follow-up observations aimed at better understanding
the physics of galaxy formation within cluster environments; in particular,
is a redshift at which both narrow-band Lyman (observed wavelength of 4012 Å)
and H (2.166m) are easily accessible from the ground, where a
combination of rest-frame optical and rest-frame far-UV spectroscopy offers
a wealth of information on the kinematics, chemistry, and stellar populations
of cluster galaxies in the pre-cluster environment, and where the impact of galaxy
formation on the proto-intracluster medium may be measured. The results of such
ongoing follow-up studies will be presented elsewhere.
We are indebted to the IRAC instrument team, particularly Pauline Barmby, Giovanni Fazio, Jiasheng Huang, and Peter Eisenhardt, for obtaining and reducing the Spitzer/IRAC data in the HS1700+643 field, and for allowing us early access to the data. We thank the referee, Paul Francis, for a constructive review of the original version of the paper. CCS, DKE, and NAR have been supported by grant AST03-07263 from the US National Science Foundation and by the David and Lucile Packard Foundation. KLA acknowledges support from the Carnegie Institution of Washington, and AES from the Miller Institute for Basic Research in Science.
References
- Abraham et al. (2004) Abraham, R. G., Glazebrook, K., McCarthy, P. J., Crampton, D., Murowinski, R., Jørgensen, I., Roth, K., Hook, I. M., Savaglio, S., Chen, H., Marzke, R. O., & Carlberg, R. G. 2004, AJ, 127, 2455
- Adelberger et al. (2005) Adelberger, K. L., Erb, D. K., Steidel, C. C., Reddy, N. A., Pettini, M., & Shapley, A. E. 2005, ApJ, submitted
- Adelberger et al. (2004a) Adelberger, K. L., Steidel, C. C., Pettini, M., Shapley, A. E., Reddy, N. A., & Erb, D. K. 2004a, ApJ, accepted (astro-ph/0410165)
- Adelberger et al. (2004b) Adelberger, K. L., Steidel, C. C., Shapley, A. E., Hunt, M. P., Erb, D. K., Reddy, N. A., & Pettini, M. 2004b, ApJ, 607, 226
- Baugh et al. (1998) Baugh, C. M., Cole, S., Frenk, C. S., & Lacey, C. G. 1998, ApJ, 498, 504
- Blain et al. (2004) Blain, A. W., Chapman, S. C., Smail, I., & Ivison, R. 2004, ApJ, 611, 725
- Bower et al. (1992) Bower, R. G., Lucey, J. R., & Ellis, R. S. 1992, MNRAS, 254, 601
- Budavári et al. (2003) Budavári, T., et al. 2003, ApJ, 595, 59
- Cimatti et al. (2004) Cimatti, A., Daddi, E., Renzini, A., Cassata, P., Vanzella, E., Pozzetti, L., Cristiani, S., Fontana, A., Rodighiero, G., Mignoli, M., & Zamorani, G. 2004, Nature, 430, 184
- Coil et al. (2004) Coil, A. L., Davis, M., Madgwick, D. S., Newman, J. A., Conselice, C. J., Cooper, M., Ellis, R. S., Faber, S. M., Finkbeiner, D. P., Guhathakurta, P., Kaiser, N., Koo, D. C., Phillips, A. C., Steidel, C. C., Weiner, B. J., Willmer, C. N. A., & Yan, R. 2004, ApJ, 609, 525
- Daddi et al. (2004) Daddi, E., Cimatti, A., Renzini, A., Vernet, J., Conselice, C., Pozzetti, L., Mignoli, M., Tozzi, P., Broadhurst, T., di Serego Alighieri, S., Fontana, A., Nonino, M., Rosati, P., & Zamorani, G. 2004, ApJ, 600, L127
- Daddi et al. (2003) Daddi, E., Röttgering, H. J. A., Labbé, I., Rudnick, G., Franx, M., Moorwood, A. F. M., Rix, H. W., van der Werf, P. P., & van Dokkum, P. G. 2003, ApJ, 588, 50
- Ellis et al. (1997) Ellis, R. S., Smail, I., Dressler, A., Couch, W. J., Oemler, A. J., Butcher, H., & Sharples, R. M. 1997, ApJ, 483, 582
- Faber (1973) Faber, S. M. 1973, ApJ, 179, 731
- Fazio et al. (2004) Fazio, G. G., et al 2004, ApJS, 154, 10
- Franx et al. (2003) Franx, M., Labbé, I., Rudnick, G., van Dokkum, P. G., Daddi, E., Förster Schreiber, N. M., Moorwood, A., Rix, H., Röttgering, H., van de Wel, A., van der Werf, P., & van Starkenburg, L. 2003, ApJ, 587, L79
- Hayashino et al. (2004) Hayashino, T., Matsuda, Y., Tamura, H., Yamauchi, R., Yamada, T., Ajiki, M., Fujita, S. S., Murayama, T., Nagao, T., Ohta, K., Okamura, S., Ouchi, M., Shimasaku, K., Shioya, Y., & Taniguchi, Y. 2004, AJ, 128, 2073
- Hogg et al. (2004) Hogg, D. W., Blanton, M. R., Brinchmann, J., Eisenstein, D. J., Schlegel, D. J., Gunn, J. E., McKay, T. A., Rix, H., Bahcall, N. A., Brinkmann, J., & Meiksin, A. 2004, ApJ, 601, L29
- Hogg et al. (2003) Hogg, D. W., Blanton, M. R., Eisenstein, D. J., Gunn, J. E., Schlegel, D. J., Zehavi, I., Bahcall, N. A., Brinkmann, J., Csabai, I., Schneider, D. P., Weinberg, D. H., & York, D. G. 2003, ApJ, 585, L5
- Holden et al. (2004) Holden, B. P., Stanford, S. A., Eisenhardt, P., & Dickinson, M. 2004, AJ, 127, 2484
- Kochanek et al. (2000) Kochanek, C. S., Falco, E. E., Impey, C. D., Lehár, J., McLeod, B. A., Rix, H.-W., Keeton, C. R., Muñoz, J. A., & Peng, C. Y. 2000, ApJ, 543, 131
- Kurk et al. (2004a) Kurk, J. D., Pentericci, L., Overzier, R. A., Röttgering, H. J. A., & Miley, G. K. 2004a, A&A, 428, 817
- Kurk et al. (2004b) Kurk, J. D., Pentericci, L., Röttgering, H. J. A., & Miley, G. K. 2004b, A&A, 428, 793
- Kurk et al. (2000) Kurk, J. D., Röttgering, H. J. A., Pentericci, L., Miley, G. K., van Breugel, W., Carilli, C. L., Ford, H., Heckman, T., McCarthy, P., & Moorwood, A. 2000, A&A, 358, L1
- McCarthy et al. (2004) McCarthy, P. J., Le Borgne, D., Crampton, D., Chen, H., Abraham, R. G., Glazebrook, K., Savaglio, S., Carlberg, R. G., Marzke, R. O., Roth, K., Jørgensen, I., Hook, I., Murowinski, R., & Juneau, S. 2004, ApJ, 614, L9
- Mo & White (1996) Mo, H. J. & White, S. D. M. 1996, MNRAS, 282, 347
- Pentericci et al. (2000) Pentericci, L., Kurk, J. D., Röttgering, H. J. A., Miley, G. K., van Breugel, W., Carilli, C. L., Ford, H., Heckman, T., McCarthy, P., & Moorwood, A. 2000, A&A, 361, L25
- Reddy et al. (2005) Reddy, N. A., Erb, D. K., Steidel, C. C., Adelberger, K. L., Shapley, A. E., & Pettini, M. 2005, ApJ, submitted
- Shapley et al. (2005) Shapley, A., Steidel, C. C., Erb, D. K., Reddy, N. A., Adelberger, L. L., Pettini, M., Barmby, P., & Huang, J.-S. 2005, ApJ, submitted
- Shapley et al. (2004) Shapley, A. E., Erb, D. K., Pettini, M., Steidel, C. C., & Adelberger, K. L. 2004, ApJ, 612, 108
- Stanford et al. (1998) Stanford, S. A., Eisenhardt, P. R., & Dickinson, M. 1998, ApJ, 492, 461
- Steidel et al. (1998) Steidel, C. C., Adelberger, K. L., Dickinson, M., Giavalisco, M., Pettini, M., & Kellogg, M. 1998, ApJ, 492, 428
- Steidel et al. (2000) Steidel, C. C., Adelberger, K. L., Shapley, A. E., Pettini, M., Dickinson, M., & Giavalisco, M. 2000, ApJ, 532, 170
- Steidel et al. (2003) —. 2003, ApJ, 592, 728
- Steidel et al. (2004) Steidel, C. C., Shapley, A. E., Pettini, M., Adelberger, K. L., Erb, D. K., Reddy, N. A., & Hunt, M. P. 2004, ApJ, 604, 534
- Thomas et al. (2005) Thomas, D., Maraston, C., Bender, R., & Mendes de Oliveira, C. 2005, ApJ, in press (astro-ph/0410209)
- Treu et al. (1999) Treu, T., Stiavelli, M., Casertano, S., Møller, P., & Bertin, G. 1999, MNRAS, 308, 1037
- van Dokkum et al. (2003) van Dokkum, P. G., Förster Schreiber, N. M., Franx, M., Daddi, E., Illingworth, G. D., Labbé, I., Moorwood, A., Rix, H., Röttgering, H., Rudnick, G., van der Wel, A., van der Werf, P., & van Starkenburg, L. 2003, ApJ, 587, L83
- van Dokkum et al. (2000) van Dokkum, P. G., Franx, M., Fabricant, D., Illingworth, G. D., & Kelson, D. D. 2000, ApJ, 541, 95
- van Dokkum et al. (2001) van Dokkum, P. G., Franx, M., Kelson, D. D., & Illingworth, G. D. 2001, ApJ, 553, L39
- Venemans et al. (2002) Venemans, B. P., Kurk, J. D., Miley, G. K., Röttgering, H. J. A., van Breugel, W., Carilli, C. L., De Breuck, C., Ford, H., Heckman, T., McCarthy, P., & Pentericci, L. 2002, ApJ, 569, L11