On the nature of bulges in general and of box/peanut bulges in particular. Input from -body simulations.
Abstract
Objects designated as bulges in disc galaxies do not form a homogeneous class. I distinguish three types. The classical bulges, whose properties are similar to those of ellipticals and which form by collapse or merging. Boxy and peanut bulges, which are seen in near edge-on galaxies and which are in fact just a part of the bar seen edge-on. Finally disc-like bulges, which result from the inflow of (mainly) gas to the center-most parts, and subsequent star formation. I make a detailed comparison of the properties of boxy and peanut bulges with those of -body bars seen edge-on and answer previously voiced objections about the links between the two. I also present and analyse simulations where a boxy /peanut feature is present at the same time as a classical spheroidal bulge and compare them with observations. Finally, I propose a nomenclature that can help distinguish between the three types of bulges and avoid considerable confusion.
keywords:
galaxies: bulges – galaxies: evolution – galaxies : structure – methods: -body simulations – galaxies: kinematics and dynamics – galaxies: photometry1 Introduction
Before studying any given class of objects, it is necessary to define it, in order to select its members and exclude intruders. This first step has not proven to be straightforward in the case of bulges in disc galaxies and two definitions have been used so far.
According to the Webster’s New Twentieth Century Dictionary of the English Language (1963), a bulge is ‘the protuberant or more convex portion of a thing; a part that swells out’. This led to the first definition of a bulge : a smooth light distribution that swells out of the central part of a disc viewed edge-on. The word ‘smooth’ stresses that the bulge should be constituted mainly of old stars, with little, if any, star formation and dust. This definition is used standardly in all morphological work. It can, and has, been used also in photometric studies. Then the bulge is defined as the central region where the ellipticity of the isophotes is lower than that of the disc (e.g. Kent 1986; Andredakis, Peletier & Balcells 1995).
A second definition stems from the analysis of radial photometric profiles. Here the bulge is identified as the extra light in the central part of the disc, above the exponential profile fitting the remaining (non-central) part. In earlier papers this component was fitted with an law, while more recent ones use its generalisation to an law, commonly known as Sérsic’s law (Sérsic 1968). This definition was adopted by Carollo, Ferguson & Wyse (1999) and has the advantage of being applicable to disc galaxies independent of their inclination. It has also the advantage of leading to quantitative results about the mass distribution. Nevertheless, it has the disadvantage of assigning to the bulge any extra central luminosity of the disc, above the inwardly extrapolated exponential, independent of its origin. I will show in this paper some cases where this can lead to confusion.
These two definitions, however, are too general and apply to more than one type of objects, with quite different physical properties and formation histories. Indeed bulges are not a homogeneous class of objects. A very large number of studies of the observational properties of bulges have stressed their similarity with ellipticals. This includes their structure, their photometry as well as their kinematics (see e.g. reviews by Illingworth 1983; Wyse, Gilmore & Franx 1997; and references therein). Yet, as more objects were considered and as the quality of the observations increased, discrepancies became clear. Illingworth (1983) argued that some bulges have shapes which are never seen in ellipticals, namely peanuts or strongly boxed shapes. He also stressed the different kinematic properties of a handful of bulges (Kormendy & Illingworth 1982; Davies & Illingworth 1983) from those of ellipticals, particularly with respect to their values. Kormendy (1993) argued that a number of central components, which by the above definitions would be considered as bulges, have many properties bringing them closer to discs than to spheroids. This includes their shape, their kinematics and the fact that they have inner spiral or ring structures, bright star-forming knots and dust lanes (e.g. Carollo, Stiavelli & Mack 1998; Carollo & Stiavelli 1998). The debate on the spheroid versus disc nature of bulges has continued in a large number of papers (see reviews and collection of papers in e.g. Dejonghe & Habing 1993; Wyse, Gilmore & Franx 1997; Carollo, Ferguson & Wyse 1999; Balcells 2003; Kormendy & Kennicutt 2004).
-body simulations have repeatedly shown that bars seen side-on111I call side-on the edge-on view in which the line-of-sight is along the bar minor axis and end-on the edge-on view in which the line of sight is along the bar major axis. have a boxy/peanut shape (e.g. Combes & Sanders 1981; Combes et al. 1990, hereafter CDFP90; Raha et al. 1991, hereafter RSJK91; Athanassoula & Misiriotis 2002, hereafter AM02; Athanassoula 2002, hereafter A02; Athanassoula 2003, hereafter A03; O’Neill & Dubinski 2003; Martinez-Valpuesta & Shlosman 2004). These simulations argued for a link between bars and peanut features and against the formation of peanuts from interactions (Binney & Petrou 1985, Rowley 1988), unless of course the interactions excite or strengthen a bar component. A very important argument in favour of this link comes from kinematical observations and their interpretation (Kuijken & Merrifield 1995; Merrifield & Kuijken 1999; Bureau & Freeman 1999; Bureau & Athanassoula 1999, 2005; Athanassoula & Bureau 1999; Chung & Bureau 2004).
Bulges, or more precisely bulge-to-disc ratios, are one of the three criteria for classifying disc galaxies (e.g. Sandage 1961). This makes it particularly crucial for us to understand what a bulge really is. The fact that this class of objects is so inhomogeneous has generated a number of misunderstandings and has hampered progress in the subject. Considerable confusion has also been brought by the fact that the formation scenarios presented in a number of papers include a mixture of the seemingly appropriate buzz-words, but are otherwise unclear as to the exact formation procedure they propose. It is thus time to get back to basics and examine what a bulge really is, and disentangle the different members of this class. This paper aims to contribute to this goal.
In section 2 I distinguish three different types of bulges. Section 3 presents -body results and compares them with observations of boxy/peanut bulges. It also summarises similar comparisons available in the literature. Section 4 addresses the objections presented so far to the argument that peanut/boxy bulges are just bars seen edge-on. I propose a nomenclature which can help distinguish between the various types of bulges and conclude briefly in section 5.
2 Three different types of bulges
Schematically, one can recognise three different types of bulges. I will here distinguish them via their formation histories and then discuss the observational properties these lead to. This approach is clearly limited by the fact that some scenarios have not been fully worked out yet. The opposite approach, namely distinguishing objects from their observational properties and then asking what formation scenarios could lead to such properties, would also suffer from the same limitation and would, furthermore, be more dependent on the incompleteness of the observational picture. I have thus chosen here the first approach. It should of course be kept in mind that the types presented here are schematic and that more than one process may have contributed to the formation of a given bulge. This will be discussed further at the end of the section.
Classical bulges. These are formed by gravitational collapse or hierarchical merging of smaller objects and corresponding dissipative gas processes. The formation process is generally fast and sometimes externally driven. It occurs early on in the galaxy formation process, before the present discs were formed.
Several versions of this scenario have been elaborated in simulations. In the simulations of Steinmetz & Müller (1995) the bulge is formed during the first starburst triggered by the collapse of small-scale density fluctuations and is composed mainly of old metal-rich stars. A bulge forms before the disc also in the simulations of Samland & Gerhard (2003) and Sommer-Larsen et al. (2003). In the simulation of Steinmetz & Navarro (2002) a disc was formed which at 3.3 merged with another galaxy of a similar size. This stirred the stars from the disc component and concentrated them into a bulge progenitor. It also triggered a burst of star formation that depleted most of the gas of the initial discs.
A further variant of this scenario involves the formation of a gaseous proto-disc which forms clumps via gravitational instabilities. These clumps spiral to the center by dynamical friction and merge to form a central bulge. This was first proposed by Noguchi (1998, 1999) and fully worked out, in more realistic multi-phase simulations, by Immeli et al. (2004a, 2004b). If the disc containing the clumps is viewed edge-on before the clumps merge, it resembles the chain galaxies, first observed by Cowie, Hu & Songaila (1995), who tentatively assigned them to redshifts between 0.5 and 3. Subsequent observations by Elmegreen et al. (2004a, 2004b) with the Hubble Space telescope gave a similar, but somewhat narrower, redshift range of 0.5 to 2. The time-scale for the clumps to spiral in is rather short, of the order of two disc rotation times. The star formation rate in the clumps and particularly in the bulge is very high, leading to a large overabundance of -elements of the bulge stars.
Bulges formed in this way should have several similarities to elliptical galaxies, including their photometric radial profiles, their kinematics and their stellar populations (e.g. Davies et al. 1983; Franx 1993; Wyse, Gilmore & Franx 1997; and references therein). Thus they should be composed of predominantly old stars, they should have predominantly ellipsoidal shapes and should have near- projected density profiles. A typical object in this category is e.g. the Sombrero galaxy (NGC 4594). Although a relatively large mass (compared to the disc), as in NGC 4594, is tell tale of a classical bulge, this is not a prerequisite.
The prevalent view is that formation of classical bulges should happen early on in the galaxy formation process, before the present discs were actually formed. Nevertheless, it may be possible to build a bulge by accretion at a much later stage, after the disc has grown, as suggested by the simulations of e.g. Pfenniger (1993), Athanassoula (1999) Aguerri, Balcells & Peletier (2001) or Fu, Huang & Deng (2003). Aguerri et al. consider the merging of a small elliptical with a disc galaxy which, before the merging, has a small bulge with an exponential radial density profile. After the merging the bulge has increased its mass, while its radial density profile has steepened considerably, reaching an if the satellite mass is equal to that of the proto-bulge. Athanassoula (1999 and in prep.) considers a similar event, but with an initially bulge-less disc. The merging can occur after the thin disc has formed, provided the angle of the equatorial plane of the disc galaxy with the orbital plane of the satellite is not big. The stellar populations of the bulge will be those of the small elliptical that formed it and the time necessary for the small elliptical to reach the center of the target will depend drastically on its mass, massive ellipticals spiraling in faster than less massive ones.
Box/peanut bulges. These objects are formed via the natural evolution of barred galaxies. Bars form spontaneously222Their formation may, in some cases, be helped by the gravitational interaction with a companion. in disc galaxies and then evolve at a slower rate. The time necessary for the initial bar formation is longer for galaxies whose halo within the inner few disc scale-lengths is relatively more massive (Athanassoula & Sellwood 1986; A02). Relevant time scales are of order of a few galaxy rotations. Somewhat after bar formation some of the material in the bar acquires stronger vertical motions and thus reaches larger distances from the equatorial plane. These distances increase with time. Viewed edge-on, this gives a characteristic box/peanut shape.
Objects formed in this way should have observed morphological, photometrical and kinematical properties that are the same as those of -body bars seen edge-on, as I will discuss in section 3. Since they form by rearrangement of disc material, they should be constituted of stellar populations that are similar to those of the inner disc at radii comparable to those of the box/peanut feature. Subsequent star formation in one, or both, of these components can introduce some young stars. The age of the bulk of the stars, however, can be considerably older than the age of the boxy/peanut feature itself. The average size of these features should be of the order of 1 to 3 disc scale-lengths, and can not reach . This formation scenario has been well worked out in a number of papers describing relevant -body simulations (e.g. CDFP90; RSJK91; AM02; A03; O’Neill & Dubinski 2003), while the orbital structure responsible for such boxy/peanut features has been studied in considerable detail (Pfenniger 1984; Skokos, Patsis & Athanassoula 2002a,b, hereafter SPAa and SPAb; Patsis, Skokos & Athanassoula 2002, hereafter PSA02; Patsis, Skokos & Athanassoula 2003, hereafter PSA03; and references therein).
Disc-like bulges. Contrary to the boxy/peanut bulges, the formation scenario of discy bulges is not fully worked out. But the general picture is as follows : It is well known that gas will concentrate to the inner parts of the disc under the influence of the gravitational torque of a bar, thus forming an inner disc extending roughly up to the (linear) inner Lindblad resonance, or forming a ring at such radii (e.g. Athanassoula 1992; Wada & Habe 1992, 1995; Friedli & Benz 1993; Heller & Shlosman 1994; Regan & Teuben 2004). The extent of this region is of the order of a kpc. When this disc/ring becomes sufficiently massive it will form stars, which should be observable as a young population in the central part of discs. Kormendy & Kennicutt (2004) estimate that the star formation rate density in this region is , i.e. 1 to 3 orders of magnitude higher than the star formation rate average over the whole disc. This will lead naturally to the formation of a sizeable central disc. Unfortunately, no detailed -body simulations of this scenario, including star formation and comparisons with observations of central discs, have been published so far, although many aspects have been well studied individually and much work is in progress. Note that disc-like bulges can also be formed in -body simulations with no gas, from inwards motions of the disc material (see sect. 3.1). These disc-like bulges, however, will be less massive than those formed by combined stellar and gaseous processes.
The formation scenario of disc-like bulges could be, and in several cases has been, evolved further. Namely, if the disc-like bulge is sufficiently massive and concentrated, it could destroy partially or totally the bar that formed it. Various authors have advocated the mixing of the material that was initially in the bar with that of the young disc described above, to form a more vertically extended object. Yet this scenario needs to be better understood. The efficiency of bar dissolution mechanisms still remains uncertain, since simulations have given widely different estimates of the necessary mass and of its central concentration (Hasan, Pfenniger & Norman 1993; Friedli 1994; Norman, Sellwood & Hasan 1996; Hozumi & Hernquist 1998, 1999; Berentzen et al. 1998; Bournaud & Combes 2002; Shen & Sellwood 2004; Athanassoula, Dehnen & Lambert 2003 and in prep.). Furthermore, -body simulations have not studied in sufficient detail the changes in the vertical structure that accompany this dissolution. Can the peanut or box survive the bar weakening, or its dissolution? More work is necessary on this and on several other aspects of this scenario. Seen its weaknesses, I will not consider this second part of the formation scenario of disc-like bulges further in this paper and will constrain myself to the first part.
Bulges formed with this scenario can have properties attributed normally to disc systems and can contain substructures found normally in discs. They can contain a sizeable amount of gas, as well as stars younger than those formed with the two previous scenarios. They qualify as bulges by the second definition given in sect. 1, but not by the first one.
Objects whose properties correspond to the above formation scenario have indeed been identified, with the help of the second definition (Sect. 1), i.e. with the help of radial photometric profiles. The substructures they harbour, mainly spirals, rings, bright star forming knots, dust lanes and even bars, have been discussed e.g. in Kormendy (1993), Carollo, Stiavelli & Mack (1998) and Kormendy & Kennicutt (2004). Their radial photometric profiles are closer to exponential than to (e.g. Courteau, de Jong & Broeils 1996, Carollo, Stiavelli & Mack 1998) and their colours imply a younger age than that of bulges (e.g. Carollo et al. 2001). Yet they can be observed also in the near infrared. They are primarily found in late type disc galaxies (e.g. Andredakis et al. 1995; Carollo & Stiavelli 1998) as expected since gas processes can enhance their formation. Their host galaxies often harbour a large-scale bar. Prominent strong central peaks have indeed been observed in radial photometric profiles obtained from cuts along the major axis of edge-on barred galaxies (see e.g. Fig. 1, 2 and 5 in Lütticke, Dettmar & Pohlen 2000). These features are only seen in cuts which are on, or near the equatorial plane, which argues for their disc-like geometry.
In summary, the objects in this category are disc-like in shape and have many disc-like properties but form strong excesses on radial photometric profiles, reminiscent of those of bulges, i.e. they qualify as bulges by the second, but not by the first definition. The link of these disc-like objects with bulges is not novel, and has indeed been made in a number of studies (see e.g. Kormendy & Kennicutt 2004 and references therein).
Although the processes leading to either the second or the third type of bulges are both bar driven, they are different. The processes involved in the formation of boxy/peanut bulges invoke vertical instabilities and are necessarily dissipationless. On the other hand the one invoked for discy bulges involves radial redistribution of material and can rely at least partly on the presence of a dissipational component. Moreover, the two classes of objects thus formed are distinctly different. In particular, one extends to radii comparable to (although, as we will see later, somewhat smaller than) that of the bar itself, while the other should be constrained to considerably smaller regions, of the order of a kpc. Their vertical extents are also very different. Their only common point is that they are both made from disc material by bar-driven evolution, contrary to the first type of bulges, which is in no way linked to a pre-existing bar. This one and only similarity, however, is not sufficient for them to be considered together, as a single class of objects.
The three types of bulges are very different but are not mutually exclusive. Face-on strongly barred galaxies often harbour what looks like classical bulges and should thus contain both a classical and a box/peanut bulge. Furthermore, the strong central peaks of the radial density profile in edge-on boxy/peanut systems (e.g. Lütticke et al. 2000), which I have linked to disc-like or dissipative bulges in the previous paragraphs, show that boxy/peanut bulges often coexist with disc/dissipative ones.
Samland & Gerhard (2003) presented a simulation in which two types of bulges form at different times. During the early formation stages a classical bulge forms by dissipative collapse. This is followed by the formation of a disc which is bar unstable and forms what the authors call a bar-bulge. This has axial ratios roughly 3:1.4:1 and includes the old bulge component formed in the early collapse. Thus the bulge in their model contains two stellar populations : and old population that formed during the collapse phase and a younger bar population, the distinguishing feature between the two being the [/Fe] ratio. Such bulges, containing two stellar populations, have also been found observationally (e.g. Prugniel et al. 2001) and stress the fact that the various types of bulges can coexist in the same galaxy.
3 Comparison of properties of bars in simulations viewed edge-on with observations of boxy/peanut features
-body simulations have now reached sufficient resolution to allow a number of detailed comparisons with observations. I will here briefly discuss those concerned with the morphology, photometry and kinematics of boxy/peanut features.
3.1 -body results
I have at my disposal more than 250 simulations describing bar formation in disc galaxies. For about 200 of these I used initial conditions similar to those described in A03, while roughly 50 used initial conditions as described by Kuijken & Dubinski (1995). All simulations have more than a million particles (2 in the disc and roughly in the halo), while a few of them have considerably more, up to 5 millions. They were run either on our GRAPE5 systems (Kawai et al. 2000) or with a treecode on a PC (Dehnen 2000, 2002). More information on how the simulations were run and the codes that were used can be found in A03, while the system of computer units is as described in AM02. I used a large number of these simulations to study the observable properties of bars seen edge-on. Thus, the results presented in this section are based on a very large sample, although for practical reasons only a few simulations are used for illustration.
Athanassoula (A02, A03) used both analytical calculations and -body simulations to show that it is the exchange of angular momentum within the galaxy that drives the bar evolution and, in particular, that determines its strength, pattern speed and morphology. The reader is referred to these two papers for more information, as well as for references on both the analytical and numerical work on the subject. Angular momentum is emitted from the bar region, mainly at the resonances, and absorbed by the outer disc and by the halo, again mainly at the resonances. Since the bar is a negative angular momentum feature, it becomes stronger and slows down by losing angular momentum. The more angular momentum it can shed, the stronger and slower it can become. Thus, if the disc is immersed in a receptive (massive and cool) halo, it may be able to shed more of its angular momentum and thus grow stronger than in the absence of such a halo, or than in the presence of a rigid halo (A02; A03). Here I use the same notation as in AM02, A02 and A03. In particular, models with haloes which are not too hot and which have important contributions to the total rotation curve within the whole galaxy, including the innermost few disc scale-lengths, are called MH. If they also have a classical bulge, then they are termed MHB. On the other hand, models which have a disc that dominates dynamically the inner region are termed MD (or MDB if they also have a classical bulge).
Peanuts form spontaneously in bar unstable 3D -body simulations (e.g. CDFP90; RSJK91; AM02; A02; A03; O’Neill & Dubinski 2003). Such features, however, do not form simultaneously with the bar, but some time after it, as was already shown by CDFP90 and is confirmed by my simulations. Thus the bar starts thin and then buckles out of the plane, initially asymmetrically, and finally tending towards symmetry with respect to the equatorial plane. This evolution can be seen e.g. in the figures of RSJK91, as well as in my simulations. My simulations also show clearly that it is not the whole bar that buckles, so that the outermost part of the bar stays thin and planar.
Stronger peanuts generally grow in models with stronger bars. This could already be inferred from the few examples in AM02, while a more quantitative approach, based on a large number of simulations, will be presented elsewhere. In particular, considering a sequence of bars with varying axial ratio, I note that the strong, thin bars have X or strong peanut features, while ovals have weak peanuts or boxy structures. Considering now a sequence of bars with varying length, I note that the boxy/peanut feature stands out less clearly in very short bars. Yet, at least in all simulations I checked, it was always possible to see it in cuts parallel to the equatorial plane, or on isocontours.
3.2 Morphology
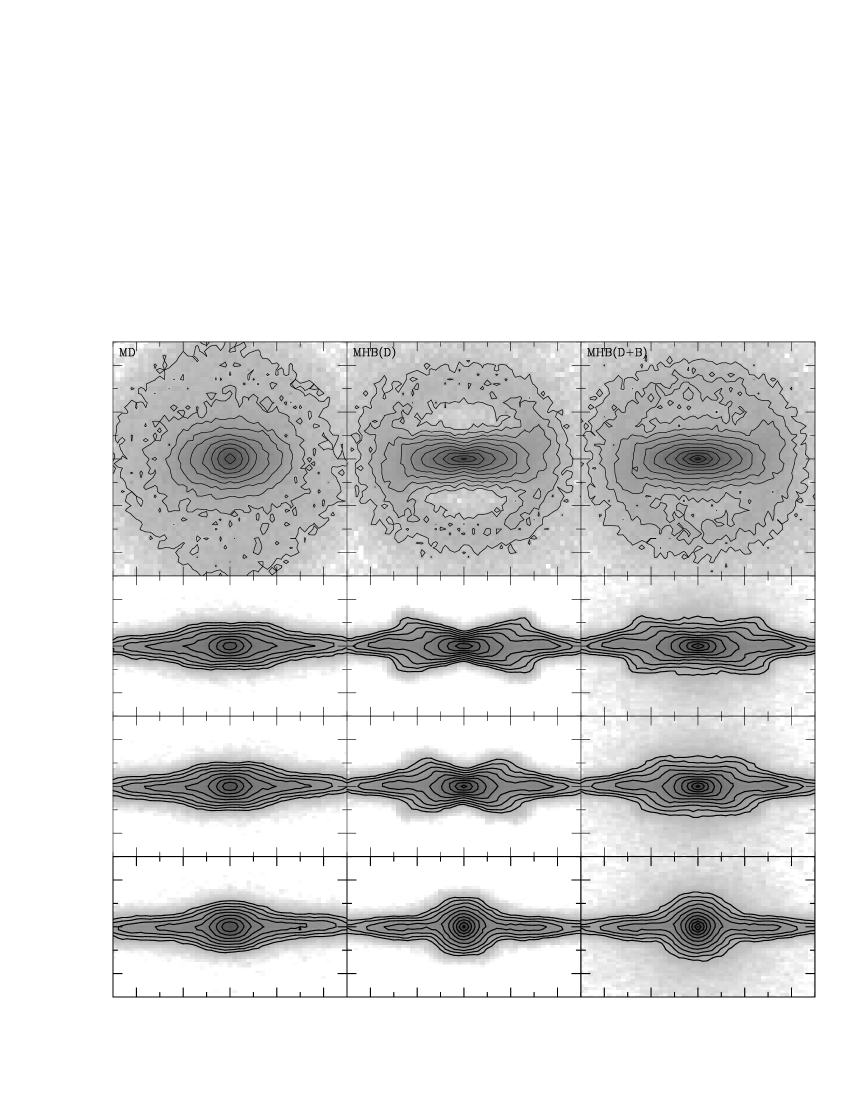
The morphology of the boxy/peanut features growing in -body simulations is the same as that of boxy/peanut bulges in edge-on galaxies. Examples of the former are shown in Fig. 1333In all the following the axis is perpendicular to the equatorial plane and the major axis of the bar is along the axis.. The simulation illustrated in the left panels is of MD type444In this example the initial conditions are as in A03. The specific values used for the mass, scale-length, scale-height and temperature of the disc are = 1, = 1, = 0.2 and = 1.2, respectively. For the halo, the mass and scale-lengths are = 5, = 5 and = 10, respectively. There is no initial classical bulge component.. Its bar shows a clear boxy feature when viewed side-on and its morphology is the same as that of boxy bulges seen edge-on. The second example is a simulation of MHB type555In this example the initial conditions are as in A03. The specific values used for the mass, scalelength, scale-height and temperature of the disc are = 1, = 1, = 0.2 and = 1, respectively. For the halo the mass and scale-lengths are = 5, = 0.5 and = 10, respectively. In this simulation there is also a classical bulge component with = 0.4 and = 0.4.. Its disc component is illustrated in the central column of panels. It has a strong bar and shows a strong peanut, or X-like feature when viewed side-on. Examining by eye a large number of simulations, shows clearly a progression from boxy features to peanuts and then to X-features as the strength of the bar increases. Thus, X-features are naturally linked to strong bars seen side-on in MH type models. It is worth noting that, when viewed from (third row of panels) the X-like feature is considerably less strong and is in fact closer to a peanut. Although in real galaxies there are undeniably more peanuts observed than X-features, both morphologies exist. X-features, some of them particularly strong, can be seen e.g. in IC 4767, AM 1025-401, NGC 128, NGC 4845, NGC 1380A, ESO 185-G53, NGC 6771, IC 3370.
The particular simulation in the central and right panels has initially three components : a disc, a halo and a classical bulge. It should, however, be stressed that the existence of an X-feature does not necessitate the existence of the bulge component. Such features come naturally in all simulations which develop strong bars. A02 and A03 showed that this is easily achieved if the disc is immersed in a spheroidal component with resonances that can absorb considerable amounts of angular momentum. Such a spheroidal component should have considerable mass in the resonant regions and this mass should be receptive, i.e. relatively cool (A03). A bulge thus will help, but a concentrated halo can be sufficient, as shown in AM02. I have, nevertheless, decided to illustrate the X feature with a simulation having a classical bulge, as this allows to visualise the effect of the classical bulge. Indeed, in real galaxies it is all the luminous material that is observed, while in simulations it is usually only the disc component that is displayed, in order to better illustrate its evolution. To allow for a better comparison, I give in the right panels of Fig. 1 both the disc and the classical bulge component. If a simulation has a classical bulge component, and if it is displayed together with the disc material, then the dip of the X feature at small cylindrical radii is filled in, even on side-on views, and the simulation displays a more boxy feature, as can be seen by comparing the central and right columns in Fig. 1. Since the strongest bars are observed in early type galaxies (e.g. Ohta 1996) and such types also have classical bulges, a fair fraction of the strongest X shapes should be observed as boxes (or perhaps peanuts). This, together with viewing angle considerations, should explain the relative paucity of strong X-features observed.
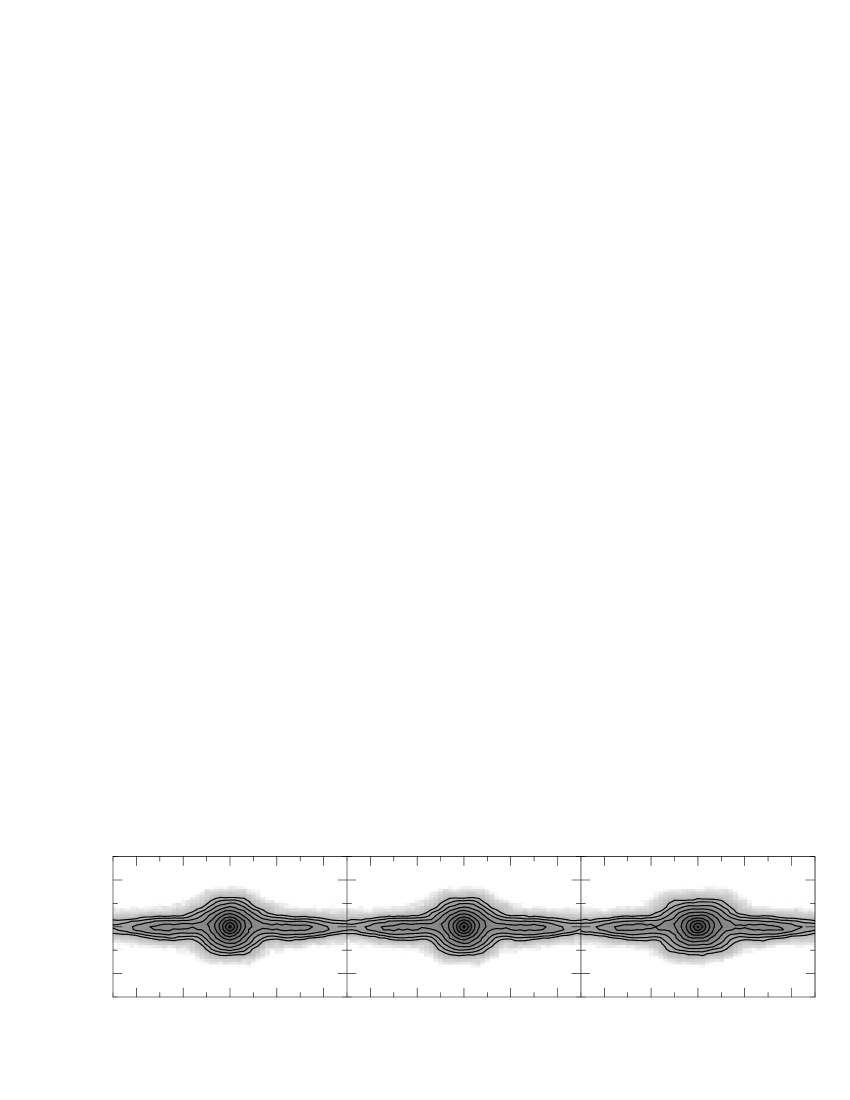
Fig. 1 also gives the end-on views. It is important to note that bars seen fully end-on look like classical bulges and could be mistaken for such. Thus some components considered as bulges in edge-on galaxies could in fact be end-on bars. Their numbers, however, should not be very large, since a relatively small change of orientation changes the spheroidal bulge into a boxy feature. This is shown in Fig. 2, which shows the disc (only) of model MHB seen edge-on, with its bar viewed end-on and at 5∘ and 10∘ from that. It is clear that, although the bar at 5∘ could still easily be mistaken for a classical bulge, at 10∘ it could not.
A cursory study of the peanut strength666See AM02 for methods of quantifying the peanut strength in the bars in my simulation sample reveals further differences between the MH and MD type models. In MD type models the peanut strength grows fast, but reaches relatively low values. On the other hand, in MH type models the peanut strength, like the bar strength, grows much slower, but reaches much higher values. Further description of these differences, together with a corresponding analysis, will be given elsewhere.
3.3 Photometry : Horizontal cuts

A number of photometrical studies of edge-on galaxies with boxy/peanut bulges have obtained the projected luminosity along horizontal cuts, i.e. cuts either on the equatorial plane, or parallel to and offset from it. Good examples can be found e.g. in Lüticke et al. (2000). Such cuts, now for the simulations shown in Fig. 1, are displayed in Fig. 3. Compared to the cuts of e.g. NGC 2654 (Lüticke et al. 2000), or of other similarly viewed such galaxies, they show striking similarities. There is, nevertheless, a quantitative difference, namely that the central peak in the cuts near the equatorial plane is much stronger in NGC 2654 than in the simulation. Simulations with a classical bulge show a bigger peak (right panel of Fig. 3), but, at least in my simulations, not as big as that observed e.g. in NGC 2654. The latter is presumably enhanced by stars formed from the gaseous material that was pushed by the bar towards the central regions, and is not present in the -body simulations, since these are dissipationless.
The remaining features are found both in the observed and the simulated profiles. On the profiles near the equatorial plane and outside the central peak there is a flat ledge followed by a steep drop. This is the signature of the bar and will be discussed further in section 4. The cuts at large distances from the equatorial plane have a different aspect from those on or near the plane. For such cuts also there is a good correspondence between observations and simulations. Particularly in both there is a central plateau whose extent is shorter than the extent of the flat ledges in the near-equatorial cuts. The importance of this difference in lengths will become clear in sect. 4.1. On either side of this plateau there are steep drops. For models such as MHB, if one uses exclusively the disc component, or if the classical bulge is small, then cuts high above (or below) the equatorial plane display a characteristic central minimum. This should be also present in corresponding cuts of real galaxies with strong X features. If, however, one includes in simulations both disc and classical bulge material, then this dip fills up and a plateau can appear instead. This is clearly seen by comparing the central and right panels of Fig. 3 and should also occur in real galaxies with both an X and a sizeable classical bulge.
The cuts near the equatorial plane in the central and right panels of Fig. 3 also suggest that a non-negligible part of the light that is assigned to the bulge in observations may, in reality, belong to the old disc component and be brought there by the mass rearrangement that accompanies bar formation and evolution. Thus the observed central component that constitutes the bulge according to the second definition (see section 1) can be partly due to old disc material that was pushed inwards by a bar, even in a purely collisionless system.
3.4 Photometry : Vertical cuts


In this subsection I will use information obtained from vertical cuts, i.e. cuts perpendicular to the equatorial plane. For this, the simulation is first viewed side-on. In order to increase the signal to noise ratio, and since the chosen simulations are sufficiently evolved for the peanut shape to become symmetrical with respect to the equatorial plane, I symmetrise with respect to the equatorial plane (up/down) and with respect to the minor axis (right/left). I then take vertical cuts at different distances for the center. Both for simulations and for observations, the form of the projected surface density along the cut (i.e. ) is bell-like and an example from a simulation is given in Fig. 4. Such shapes can be well fitted by generalised Gaussians,
| (1) |
The three free parameters, namely , and , are necessary in order to fit the height, width and shape of the density along the cut, respectively. AM02 used them to fit the log of the (vertical) projected surface density, while here, as well as in Athanassoula, Aronica & Bureau (in preparation) and Bureau et al. (2004), they are used to fit the projected surface density. In this case, the generalised Gaussian is the same as the Sérsic law (Sérsic 1968), taking = . These fits can be excellent. For example, Fig. 4 shows both the projected density along a simulated cut and the best fitting generalised Gaussian. The fit is so good that it is hard to distinguish two lines. This is true for the majority of the cases.
I performed such cuts and fits at a number of distances from the center and for a large number of simulations. Although the numerical values of the fitting parameters and the detailed shapes differ from one simulation to another, there are some general trends. Results for NGC 128 are given in Fig. 3 of Bureau et al. (2004), while a typical example, from the simulation illustrated in the left panels of Fig 1 can be seen in Fig. 5. These figures display the values of and of the best fitting generalised Gaussian as a function of the distance of the vertical cut from the center of the galaxy. This, and similar plots for other observations and simulations, show that both quantities have a minimum at the center (sometimes very broad) and a clear maxima on either side of it. This is true for both observations and simulations. Furthermore, for , where a direct comparison is easy since no scaling is required, the actual values also cover roughly the same range in observations and simulations.
3.5 Median filtering
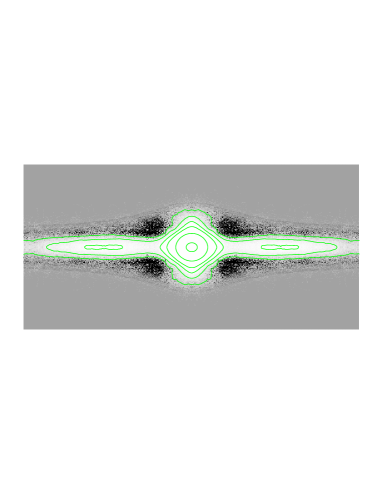
Comparisons between observations and simulations after comparable median filtering777This is obtained by replacing the value of each pixel by the difference between it and the median within a circular aperture centered on the pixel. This highlights sharp features. It can lead to negative values, particularly next to and just outside high density components. is much more demanding than a comparison of global morphology. This is due to the fact that median filtering reveals a number of features, whose position and form have to be matched at a given scale.
Aronica et al. (2003, 2004) performed median filtering of a sample of edge-on boxy and peanut galaxies and found a number of interesting features. In many cases (e.g. Fig. 2a in Aronica et al. 2003) one can note four extensions out of the equatorial plane, which form an X-like shape, except that the four extensions do not necessarily cross the center. Another common feature is maxima of the density along the equatorial plane, away from the center and diametrically opposite. Namely, starting from the center of the galaxy and going outwards along the equatorial plane, the projected surface density drops and then increases again to reach a local maximum. It then drops to the edge of the disc.
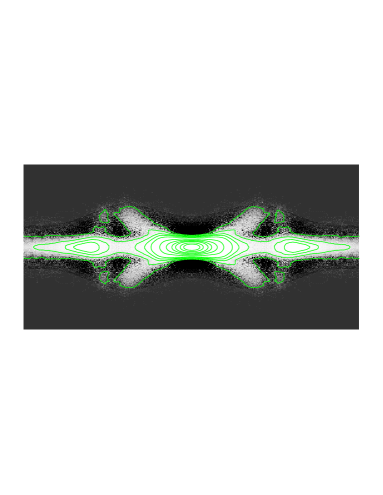
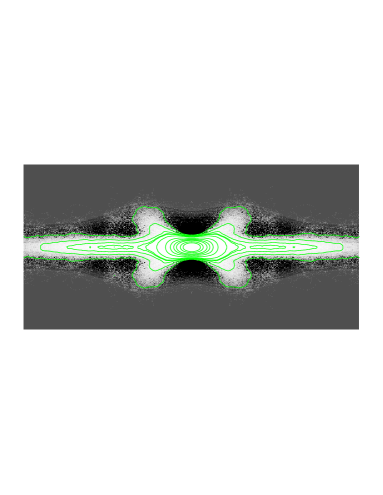
In order to compare the simulations to the observations, I applied to the former a similar analysis, using the same software. Reliable median filtering, however, requires a very large number of particles in the disc, considerably larger than what is available in most simulations. To remedy this I proceeded as follows. I considered 10 snapshots closely spaced in time, so that the bar will not have evolved noticeably, except of course for the rotation. In practice, I found that = 0.5 in the computer units of AM02 was an adequate choice. I then rotated these frames so that the major axis of the bar coincides and stacked them. Using also the natural four-fold symmetry of the problem, this brings the number of disc particles to a total of 8 particles. I then viewed the disc edge-on and from the projected surface density of the disc material I produced a fits image using NEMO (Teuben 1995). I then performed median filtering in IRAF, choosing a circular aperture of radius one initial disc scale-length. The results for three different viewing angles are shown in Fig. 6 for a simulation with a strong bar. The similarity between the features in the median filtered observations and simulations is stunning.
In the upper panel of Fig. 6 the bar is viewed side-on. It displays a clear X-like form, as do the observed peanut galaxies. It also displays secondary maxima on the equatorial plane on either side of the center. It further shows two very faint features, like parentheses enclosing the X. The middle and lower panels of Fig. 6 show the same simulation but from and viewing angle, respectively. Viewed side-on, the four branches of the X do not cross the center. This is probably still true, but less easy to see, when the viewing angle is . Furthermore, the outermost isodensity contours joining the two upper (or lower) branches of the X look curved. This can also be seen in a number of the median filtered galaxy images in Aronica et al. (2004), which might mean that these galaxies are seen from viewing angles similar to . Finally, the secondary maxima along the equatorial plane can be seen from all three viewing angles, but are best in the side-on view. All these features were seen in the median filtered images of the galaxies in Aronica et al. (2004). They are not accidental; they correspond to specific structures of the periodic orbits that constitute the backbone of barred galaxies, i.e. the orbits of the tree (SPAa), or, more specifically, the members of the x1v1, x1v4 and z3.1s families (PSA02). A more thorough comparison of the observations, the simulations and the periodic orbit structure will be given elsewhere.
3.6 Cylindrical rotation
For a number of galaxies with peanut/boxy shaped features there exist published stellar velocity data and these show clearly that the velocity depends only little on the distance from the equatorial plane. Good examples are NGC 4565 (Kormendy & Illingworth 1982), IC 3379 (Jarvis 1987), NGC 3079 (Shaw, Wilkinson & Carter 1993), NGC 128 (D’Onofrio 1999) and NGC 7332 (Falcón-Barroso et al. 2004). Such a rotation is often referred to as cylindrical rotation. -body bars, observed edge-on, show a similar velocity structure (CDFP90; AM02). A good example is shown in Fig. 12 of AM02, which also shows that for stronger bars the cylindrical rotation is clearer and concerns a larger fraction of the bulge/peanut feature.
3.7 PVD diagrams : gas kinematics
Emission line spectroscopy of boxy/peanut galaxies (Kuijken & Merrifield 1995; Merrifield & Kuijken 1999; Bureau & Freeman 1999) showed that their major axis position velocity diagrams (hereafter PVDs) show a number of interesting features. Their connection to bar signatures was first made by Kuijken & Merrifield (1995). Bureau & Athanassoula (1999) superposed periodic orbits in a standard barred galaxy potential to study these PVDs. Their results stressed that gaps between the signatures of the different orbit families, as well as material in the so-called forbidden quadrants, are a direct result of the superposition of the various periodic orbit families. Athanassoula & Bureau (1999) used the gas flow simulations of Athanassoula (1992) viewed edge-on to model such PVDs. Shocks along the leading edges of the bar and the corresponding inflow lead to a characteristic gap in the PVDs, between the signature of the nuclear spiral (whenever existent) and the signature of the disc. There is in general very good agreement between the signatures of the observed emission line PVDs and those obtained by hydrodynamic models.
3.8 PVD diagrams : stellar kinematics
Chung & Bureau (2004) presented long-slit absorption line kinematic observations of 30 edge-on disc galaxies, most with a boxy peanut feature, while Bureau & Athanassoula (2005) ‘observed’ in a similar way many -body bars seen edge-on. The two studies used for their analysis exactly the same techniques and, to where possible, also the same software. Both used Gauss-Hermite series and produced profiles of the integrated light, the mean stellar velocity , the velocity dispersion , as well as the higher order components and . It is thus particularly straightforward and meaningful to make comparisons of the results of the two studies.
The similarities are striking. Both studies found the same characteristic signatures, one in the observations and the other in the simulations. The integrated light along the slit (equivalent to a major-axis light profile) has a quasi-exponential central peak and a plateau at intermediate radii, followed by a steep drop. The rotation curve has a characteristic double hump. The velocity dispersion has a central peak, which in the center-most part may be rather flat or may even have a central minimum. At intermediate radii there can be a plateau which sometimes ends on either side with a shallow maximum before dropping steeply at larger radii. correlates with over most of the bar length, contrary to what is expected for a fast rotating disc. All these features are spatially correlated and are seen, more or less strongly, both in the observations and in the simulations. The -body simulations show clearly that the strength of these features depends on the strength of the bar. Furthermore, those features can be interpreted with the help of the orbital structure in barred discs (Bureau & Athanassoula 1999).
The only observed feature that was not found by Bureau & Athanassoula (2005) is the anti-correlation of and in the center-most parts. Indeed, the observations show that, in a small region very near the center, the and curves anti-correlate in many cases, while for the remaining bar region they correlate. On the hand, in the simulations shown by Bureau & Athanassoula (2005) the and curves always correlate all the way to the center. This small discrepancy can be remedied in two ways, presented and discussed elsewhere (Athanassoula, in prep.). The first relies on the existence of a gaseous inner disc, present in the galaxies but not in the simulations, while the second relies on a different type of halo profile, and in particular a more centrally concentrated one. Thus even this small discrepancy between observations and simulations can be remedied.
4 objections
In the previous section I reviewed a number of arguments in favour of boxy/peanut bulges being simply parts of bars viewed edge-on. This point of view, however, is not yet generally accepted. For example Kormendy (1993) qualifies it as ‘extreme’ and presents a number of arguments against it (see also Kormendy & Kennicutt 2004 for a more extensive discussion of these arguments). I answer these objections here.
4.1 Length of peanuts versus length of bars
A first objection concerns the length of peanuts and bars. Indeed, “if boxy bulges are edge-on bars, then the longest major axis of boxy bulges should be equal to the length of bars in face-on galaxies” (Kormendy 1993, p. 223). This should indeed be the case if the whole of the bar was the peanut. Orbital structure studies, however, have shown that this is clearly not the case. Pfenniger (1984), in the first careful study of 3D orbital structure in barred potentials, showed that there are several families of 3D orbits, bifurcated at the vertical instabilities of the main planar family, constituting the backbone of the bar. This work was supplemented and extended in SPAa and SPAb, some results of which I will briefly recall here, since they fully answer this particular objection.
2D orbital structure studies clearly established that it is the stable members of the family of periodic orbits that are the backbone of a 2D bar. (Contopoulos & Papayannopoulos 1980; Athanassoula et al. 1983; etc). Such orbits trap around them regular, non-periodic orbits and, due to their appropriate size, shape and orientation, can form the bar.
3D orbital structure studies, however, showed that the situation is considerably more complicated. The backbone of 3D bars is the tree, i.e. the family plus a tree of 2D and 3D families bifurcating from it (SPAa; SPAb). Each of these families has its own extent along the bar major axis and its own height above the equatorial plane. Since the extent of the box/peanut will in general be determined by a different family from that which determines the length of the bar, it is natural for the peanut and bar to have different extents in the same galaxy. The length of the bar is determined by the family with the largest extent in the direction of the bar major axis. This is usually the family or 2D rectangular-like orbits at the radial 4:1 resonance region (PSA03). On the other hand, the length of the peanut is determined by the extent of the 3D family that constitutes its backbone, e.g. the x1v1, x1v4, etc. All this is discussed in detail by PSA02, who also give tables with values of the ratio of bar to peanut extent for the most important families. It is also illustrated in Fig. 7, where I plot two orbits taken from an -body simulation, as well as their superposition. The orbit on the left is trapped around a periodic orbit of the type defining the bar length. The orbit in the central column of panels is trapped around a periodic orbit of the type defining the peanut. Their superposition (right panels) shows clearly that the extent of the peanut can be considerably shorter than the extent of the bar.

The fact that the bar and the peanut have different radial extents is also clearly seen in -body simulations. Examples can be seen in Fig. 1. Comparison of the face-on and side-on views (first and second row of panels) shows clearly the difference in peanut and bar lengths, the former being shorter than the latter. Several other examples are shown e.g. in CDFP90, AM02, A02, A03, etc. The difference between the two radial extents can also be seen clearly in Fig. 3, since the extent of the central plateau is shorter than the extent of the flat ledges in the near-equatorial cuts. AM02 discussed and assessed several methods by which the extent of the peanut and of the bar can be measured and thus quantified their ratio.
The above show that both 3D orbital structure studies and -body simulations clearly explain why the length of the peanut is shorter than that of the bar. Once this is understood, the difference in extents is no more an objection to boxy/peanut shapes being edge-on bars. On the contrary, it becomes an argument in favour, since it is in agreement with theoretical predictions. A stricter terminology may, nevertheless, be called for, since strictly speaking the peanut is not the whole of the bar seen edge-on, but only its part that sticks well out of the equatorial plane.
4.2 The thickness of bars, NGC 4762 and NGC 7582
Once the answer to the first objection has been understood, then the other objections can be answered with very similar arguments. These concern the thickness of bars, and two specific galaxies : NGC 4762 and NGC 7582 (Kormendy 1982, 1993; Kormendy & Kennicutt 2004).
The major-axis surface brightness profile of edge-on disc galaxies with boxy/peanut structures reveals plateaus extending on either side of the center and terminating by a more or less abrupt drop into the disc component (e.g. Lütticke et al. 2000). Since in more face-on systems such plateaus are associated with bars, they have been linked with bars in edge-on systems as well. The fact that cuts parallel to the equatorial plane show these plateaus only if they are very little offset in has led to the misconception that bars should be thin (e.g. Kormendy 1982, 1993). Before I analyse the basis of this misconception, let me first note that such plateaus need not necessarily be tell tale of a bar. Indeed, they could be produced by any component which has the relative size of a bar and has abrupt edges. Lenses have both these properties (e.g. Kormendy 1979, 1982) and thus could well be responsible for a number of the observed plateaus.
Based on the discussion in the previous subsection, which is in turn based on a thorough study of the orbital structure in barred galaxies (SPAa; SPAb; PSA03; PSA03), it is easy to understand where the arguments in favour of thin bars go wrong. The orbits that constitute the bar/box/peanut are, as already mentioned, part of the -tree. Some of the families that constitute this tree are 2D, so that the non-periodic orbits that are trapped around their stable members will necessarily stay near the equatorial plane. When seen edge-on, they form the plateaus in the radial density profile. On the other hand, some of the 3D families can reach large distances and constitute the boxy/peanut feature. Yet both sets of families (2D and 3D), when seen face-on, constitute the bar together. Thus, bars seen edge-on can have both a thin and a thick part, but the two can not be distinguished in face-on views.
NGC 4762 is an object with a structure that is similar to, yet somewhat more complicated than, the galaxies shown in Lütticke et al. (2000). Its photometry (Wakamatsu & Hamabe 1984) reveals a plateau in cuts on, or near, the equatorial plane, such as those that are associated with bars in edge-on systems. A deep image (see e.g. Fig. 1b in Wakamatsu & Hamabe 1984, or the image of the SDSS) shows clearly that it has a boxy bulge. Fisher (1997) obtained kinematical data for this galaxy. Those show a number of the characteristic signatures of barred galaxies (compared with the simulation results in Bureau & Athanassoula 2005 and the observations of Chung & Bureau 2004), like the double hump in the velocity profile and the fact that and correlate over the presumed extent of the bar, except for the innermost part where they anti-correlate. It is thus clearly a barred galaxy seen edge-on. Seen the kinematical signatures and the shape of the boxy feature, the bar is presumably seen nearer to end-on than to side-on.
The extra complexity of NGC 4762 comes from the fact that its radial photometric profile has an extra plateau, between the inner plateau and the outer disc (Wakamatsu & Hamabe 1984). As proposed by Wakamatsu and Hamabe, the most plausible explanation for this structure is that NGC 4762 has both a lens and a bar and that the bar is not seen side-on, since in the latter case the extent of the two plateaus would be the same (Kormendy 1979). This argues that lenses are thin structures, but does not otherwise affect the above arguments, according to which some of the bar orbits when seen side-on make a clear signature (plateaus on either side of the center) on the photometric cuts along the major axis, which is limited only to small extents from the equatorial plane.
NGC 7582 is a particularly interesting galaxy since, despite its intermediate inclination (approximatively ), near infrared imaging (Quillen et al. 1997) allows us to see both the bar and the peanut. One can now see that the peanut has a considerably shorter extent than the bar. Similar comments can be made for NGC 4442 (Bettoni & Galletta 1999). As already explained above, this is not an argument against the fact that peanuts are just edge-on bars (Kormendy & Kennicutt 2004), but a confirmation of it, since it is predicted from orbital structure theory and from simulations.
5 SUMMARY
In this paper I made a thorough comparison of the observed properties of simulated bars viewed edge-on with those of boxy/peanut bulges in edge-on galaxies. The comparison involves results from the literature, as well as new simulations and, in all cases, the same techniques are used both for the observations and the simulations. Section 3 includes a morphological comparison, properties of photometric profiles on both horizontal cuts (i.e. parallel to the equatorial plane) and vertical cuts (i.e. perpendicular to the equatorial plane), median filtered images, velocity fields and PVD diagrams of both the gaseous and the stellar component. There is excellent agreement in all comparisons. This argues strongly that a box/peanut bulge is simply an inherent part of a bar seen edge-on. In order to press this point further, I tackle, and answer, some previously voiced objections. I use mainly arguments based on the 3D orbital structure in barred galaxies, and in particular on the structure of the tree and of the families composing it. In particular, I discuss the families of periodic orbits that can be determine the extent of box/peanut bulges, and the families that determine the bar extent. This leads to the conclusion that the extent of the box/peanut bulge should be smaller than that of the bar, both being measured along the bar major axis.
Boxy/peanut features are not the only types of bulges and it is now clear that bulges are not a homogeneous class of objects. I distinguish here three different types of bulges. The classical bulges, the boxy/peanut bulges and the disc-like bulges. I briefly discuss the properties and formation scenarios of these three types of objects and propose a nomenclature that can help distinguish between them. I propose that the first type of objects be called classical bulges. Members of the second class should be called box/peanut bulges, box/peanut features (or structures), or simply peanuts. Finally, objects in the third category could be called disc-like bulges, since they are composed of disc material and have a number of properties usually linked to discs, like their shape, radial density profile, substructure, or kinematics. In many cases, more than one type of bulges may well co-exist. In these cases they should be mentioned as separate components. Thus, a given galaxy may have both a classical bulge and a box/peanut bulge, or a box/peanut bulge and a disc-like bulge. In some cases all three components may be present.
The global or generic name ‘bulge’, without adding classical or box/peanut or disc-like, should in general be avoided. It is important to distinguish between these three types of objects since they have different properties and different formation history. It is particularly important to do this when correlating basic ‘bulge’ parameters with other properties of the parent galaxy. Indeed the three different types of bulges may follow different correlations, and thus including them all together can, at best, add scatter, at worst, totally mask some relations. In other cases the relations followed by the three types of bulges could be the same or very similar, as argued e.g. by Kormendy & Gebhardt (2001) for the correlation between the bulge luminosity and the mass of the black hole it harbours. Such cases are particularly interesting since they might be outlining physics in which only the central concentration of the mass matters and not its other properties.
Acknowledgments. I thank A. Bosma, M. Bureau, K. C. Freeman, J. Kormendy, P. Patsis, G. Aronica and M. Carollo for useful and motivating discussions. I thank Jean-Charles Lambert for his invaluable help with the simulation software and the administration of the runs and W. Dehnen for making available to me his tree code and related programs. I also thank IGRAP, the region PACA, the INSU/CNRS and the University of Aix-Marseille I for funds to develop the computing facilities used for the calculations in this paper.
References.
Aguerri, J. A. L., Balcells, M., Peletier, R. F. 2001, A&A, 367, 428
Andredakis, Y. C., Peletier, R. F., Balcells, M. 1995, MNRAS, 275, 874
Aronica, G., Athanassoula, E., Bureau, M., Bosma, A., Dettmar, R.-J., Vergani, D., Pohlen M. 2003, Ap&SS, 284, 753
Aronica, G., Bureau, M., Athanassoula, E., Dettmar, R.-J., Bosma, A., Freeman, K. C. 2004, MNRAS, to be submitted
Athanassoula, E. 1992, MNRAS, 259, 345
Athanassoula, E. 1999, in “Astrophysical Discs”, eds. J. A. Sellwood and J. Goodman, PASP conference series, 160, 351
Athanassoula, E. 2002, ApJ, 569, L83 (A02)
Athanassoula, E. 2003, MNRAS, 341, 1179 (A03)
Athanassoula, E., Bienaymé, O., Martinet, L., Pfenniger, D. 1983, A&A, 127, 349
Athanassoula, E., Bureau, M. 1999, ApJ, 522, 699
Athanassoula, E., Dehnen, W., Lambert, J. C. 2003, Highlights of astronomy, 13, ed. O. Engvold, 355
Athanassoula, E., Misiriotis, A. 2002, MNRAS, 330, 35 (AM02)
Athanassoula, E., Sellwood, J. A. 1986, MNRAS, 221, 213
Balcells, M. 2003, in EAS Publ. ser., 10, “Galactic and Stellar Dynamics”, eds. C. M. Boily, P. Patsis, S. Portegies Zwart, R. Spurzem and C. Theis, 23.
Berentzen, I., Heller, C. H., Shlosman I., Fricke, K. J. 1998, MNRAS, 300, 49
Bettoni, D. Galletta, G. 1999, A&A, 281, 1
Binney, J., Petrou, M. 1985, MNRAS, 214, 449
Bournaud, F., Combes, F. 2002, A&A, 392, 83
Bureau, M., Athanassoula, E. 1999, ApJ, 522, 686
Bureau, M., Athanassoula, E. 2005, ApJ, submitted
Bureau, M., Athanassoula, E., Chung, A., Aronica, G. 2004, in “Penetrating Bars through Masks of Cosmic Dust: The Hubble Tuning Fork Strikes a New Note”, eds. D. Block, K. C. Freeman, I. Puerari, R. Groess and L. Block, Kluwer Pub., in press
Bureau, M., Freeman, K. C. 1999, AJ, 118, 126
Carollo, C. M., Stiavelli, M. 1998, AJ, 115, 2306
Carollo, C. M., Stiavelli, M., Mack, J. 1998, AJ, 116, 68
Carollo, C. M., Ferguson, H. C., Wyse, R. F. G. 1999, “The Formation of Galactic Bulges”, Cambridge Univ. Press, Cambridge
Carollo, C. M., Stiavelli, M., de Zeeuw, T., Seigar, M., Dejonghe, H. 2001, ApJ, 546, 216
Chung, A., Bureau, M. 2004, AJ, 127, 3192
Combes, F., Sanders, R. H. 1981, A&A, 96, 164
Combes, F., Debbasch, F., Friedli, D. & Pfenniger, D. 1990, A&A, 233, 82 (CDFP90)
Contopoulos G., Papayannopoulos, T. 1980, A&A, 92, 33
Courteau, S., de Jong, R. S., Broeils, A. H. 1996, ApJ, 457, L73
Cowie, L. L., Hu, E. M., Songaila, A. 1995, AJ, 110, 1576
Davies, R. L., Efstathiou, G., Fall, S. M., Illingworth, G., Schechter, P. L. 1983, ApJ, 266, 41
Davies, R. L. Illingworth, G. 1983, ApJ, 266, 516
Dehnen, W. 2000, ApJ, 536, L39
Dehnen, W. 2002, J. Comp. Phys., 179, 27
Dejonghe, H., Habing H. J. 1993, “Galactic Bulges”, Kluwer Academic Publ., IAU Symposium 153
D’Onofrio, M., Capaccioli, M., Merluzzi, P., Zaggia, S., Boulesteix, J. 1999, A&AS, 134, 437
Elmegreen, B. G., Elmegreen, D. M., Hirst, A. C. 2004a, ApJ, 604, L21
Elmegreen, D. M., Elmegreen, B. G., Sheets, C. M. 2004b, ApJ, 603, 74
Falcón-Barroso, J. et al. 2004, MNRAS, 350, 35
Fisher, D. 1997, AJ, 113, 950
Franx, M. 1993, in “Galactic Bulges”, eds. H. Dejonghe and H. J. Habing, Kluwer Academic Publ., IAU Symposium 153, 243
Friedli, D. 1994, in “Mass Transfer Induced Activity in Galaxies”, ed. I. Shlosman, Cambridge Univ. Press, 268
Friedli, D., Benz, W. 1993, A&A, 268, 65
Fu, Y. N., Huang, J. H., Deng, Z. G. 2003, MNRAS, 339, 442
Heller, C. H., Shlosman, I. 1994, ApJ, 424, 84
Hasan, H., Pfenniger, D., Norman, C. 1993, ApJ,, 409, 91
Hozumi, S., Hernquist, L. 1998, astro-ph/9806002
Hozumi, S., Hernquist, L. 1999, in “Galaxy Dynamics”, eds. D. Merritt, J. A. Sellwood and M. Valluri, PASP Conference Series, 182, 259
Illingworth, G. 1983, in “Internal Kinematics and Dynamics of Galaxies”, ed. E. Athanassoula, IAU Symp. 100, Reidel publ., 257
Immeli, A., Samland, M., Gerhard, O., Westera, P. 2004a, A&A, 413, 547
Immeli, A., Samland, M., Westera, P., Gerhard, O. 2004b, ApJ, 611, 20
Jarvis, B. 1987, AJ, 94, 30
Kawai, A., Fukushige, T., Makino, J., & Taiji, M. 2000, PASJ, 52, 659
Kent, S. M. 1986, AJ, 93, 1301
Kormendy, J. 1979, ApJ, 227, 714
Kormendy, J. 1982, in ‘Morphology and Dynamics of Galaxies’, eds. L. Martinet and M. Mayor, Geneva Obs. Publ., Geneva, 113
Kormendy, J. 1993, in “Galactic Bulges”, eds. H. Dejonghe and H. J. Habing, Kluwer Academic Publ., IAU Symposium 153, 209
Kormendy, J., Gebhardt, K. 2001, in “20th Texas Symposium on Relativistic Astrophysics”, eds. J. C. Wheeler, H. Martel, Am. Inst. Phys. proc., 586, 363
Kormendy, J., Illingworth, G. 1982, ApJ, 256, 460
Kormendy, J., Kennicutt, R. C. 2004, ARA&A, 42, 603
Kuijken, K., Dubinski, J. 1995, MNRAS, 277, 1341
Kuijken, K., Merrifield, M. R. 1995, ApJ, 443, L13
Lütticke, R., Dettmar, R.-J., Pohlen, M. 2000, A&A, 362, 435
Martinez-Valpuesta, I., Shlosman, I. 2004, ApJ, 613, L29
Merrifield, M. R., Kuijken, K. 1999, A&A, 345, L47
Noguchi, M. 1999, ApJ, 514, 77
Noguchi, M. 1998, Nature, 392, 253
Norman, C., Sellwood, J. A., Hasan, H. 1996, ApJ, 462, 114
Ohta, K. 1996, in “Barred Galaxies”, eds. R. Buta, D. Crocker and B. Elmegreen, PASP Conference Series, 91, 37
O’Neill, J. K., Dubinski, J. 2003, MNRAS, 346, 251
Patsis, P., Skokos, Ch., Athanassoula, E. 2002, MNRAS, 337, 578 (PSA02)
Patsis, P., Skokos, Ch., Athanassoula, E. 2003, MNRAS, 342, 69 (PSA03)
Pfenniger, D., 1984, A&A, 134, 373
Pfenniger, D., 1993, in “Galactic Bulges”, eds. H. Dejonghe and H. J. Habing, Kluwer Academic Publ., IAU Symposium 153, 387
Pfenniger, D., 1999, in “The Formation of Galactic Bulges”, eds. C. M., Carollo, H. C. Ferguson, and R. F. Wyse, Cambridge Univ. Press, Cambridge, 95
Prugniel, Ph., Maubon, G., Simien, F. 2001, A&A, 366, 68
Quillen, A. C., Kuchinski, L. E., Frogel, J. A., DePoy, D. L. 1997, ApJ, 481, 179
Raha, N., Sellwood, J. A., James, R. A., Kahn, F. D. 1991, Nature, 352, 411 (RSJK91)
Regan, M. W., Teuben, P. J. 2004, ApJ, 600, 595
Rowley, G. 1988, ApJ, 331, 124
Samland, M. & Gerhard, O. E. 2003, A&A, 399, 961
Sandage, A. 1961, The Hubble Atlas of Galaxies, Carnegie Institution of Washington, Washington DC
Sérsic, J. 1968, Atlas de Galaxias Australes, Obs. Astron. Cordoba
Shaw, M., Wilkinson, A., Carter, D. 1993, A&A, 268, 511
Shen, J., Sellwood, J. A. 2004, ApJ, 604, 614
Skokos, H., Patsis, P., Athanassoula, E. 2002a, MNRAS, 333, 847 (SPAa)
Skokos, H., Patsis, P., Athanassoula, E. 2002b, MNRAS, 333, 861 (SPAb)
Sommer-Larsen, J. Götz, M., Portinari, L. 2003, ApJ, 596, 47
Steinmetz, M., Müller, E. 1995, MNRAS, 276, 549
Steinmetz, M., Navarro, J. 2002, New Astronomy, 7, 155
Teuben, P. J. 1995, in “Astronomical Data Analysis Software and Systems IV”, eds. R. A. Shaw, H. E., Payne and J. J. E. Hayes, ASP Conf, Ser. 77, 398
Wada, K., Habe, A. 1992, MNRAS, 258, 82
Wada, K., Habe, A. 1995, MNRAS, 277, 433
Wakamatsu, K., Hamabe, M. 1984, ApJS, 1984, 56, 283
Webster’s New Twentieth Century Dictionary of the English Language 1963, second edition, The World Publishing Company, Cleveland and New York
Wyse, R. F. G., Gilmore, G., Franx, M. 1997, ARA&A, 35, 637