Repeated injections of energy in the first 600 ms
of the giant flare of SGR 1806-20
Abstract
The massive flare of 27 December 2004 from the soft -ray repeater SGR 1806-20, a possible magnetar1-3, saturated almost all -ray detectors4-7, meaning that the profile of the pulse was poorly characterized. An accurate profile is essential to determine physically what was happening at the source. Here we report the unsaturated -ray profile for the first 600 ms of the flare, with a time resolution of 5.48 ms. The peak of the profile (of the order of 107 photons cm-2 s-1) was reached ms after the onset of the flare, and was then followed by a gradual decrease with superposed oscillatory modulations possibly representing repeated energy injections with ms intervals. The implied total energy is comparable to the stored magnetic energy in a magnetar ( erg) based on the dipole magnetic field intensity ( G), suggesting either that the energy release mechanism was extremely efficient or that the interior magnetic field is much stronger than the external dipole field2.
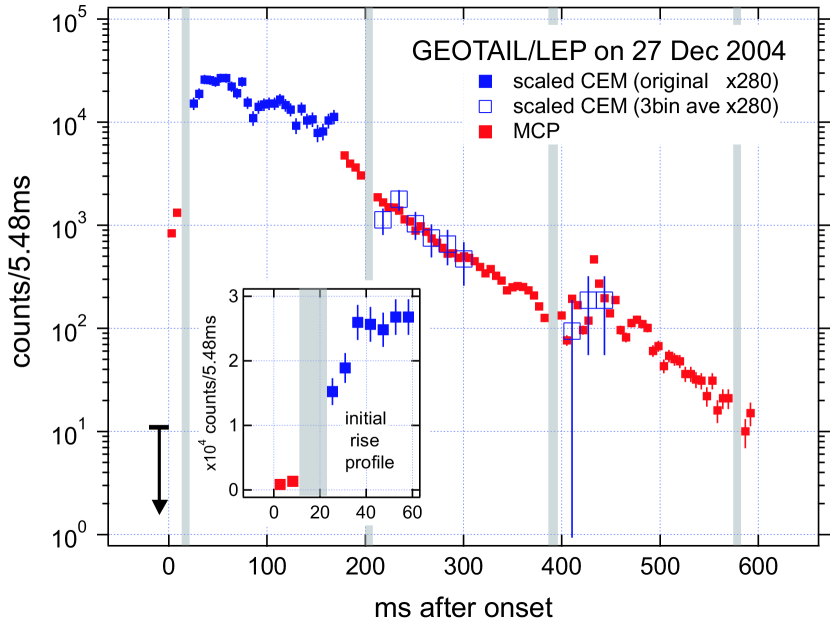
At the onset of the giant flare of SGR 1806-20, plasma particle detectors on the Geotail spacecraft detected an extremely strong signal of soft -ray photon fluxes (integrated above keV) during the initial intense phase of the giant flare (=0-600 ms). Figure 1 shows the count profiles of two detectors, (red symbols) from the microchannel plates (MCPs), and (blue symbols) from channel electron multipliers (CEMs), where is scaled by a factor of 280 to account for the sensitivity difference. The onset time (=0) corresponded to 21 h 30 min 26.35 s Universal Time (UT), which was consistent with the expected arrival time of the onset signal at the Geotail position. To understand how the flare energy release occurred, the detailed time profile of the flare is important. Before the onset was at the background level (11 counts, shown by a black arrow), and then increased to 839 counts within 5.48 ms, so that the e-fold time of the initial rise was shorter than ms. After the intermediate level of 1,330 counts at =5.48 ms, the MCPs were saturated and could not be determined until ms. Between =22.7 and 170 ms, we could obtain values instead. The scaled increased to 25,900 at =33.6 ms, thus giving an e-fold time of 9.5 ms. (A data gap between =11.0 and 22.7 ms shown by the leftmost grey bar was due to the scheduled instrumental operation and not caused by the flare itself.) Between =33.6 and 55.5 ms the scaled stayed at the peak level of -. After =61 until 170 ms the scaled decreased gradually with oscillatory modulation, which suggests repeated energy injections at ms intervals. (Note that a similar injection profile was also seen during the impulsive phase of the giant flare of SGR0526-66 on 5 March 1979 (ref.8).) After 176 ms became available again and showed a continuing exponential decay with an e-fold time of ms until =380 ms. The decay profile of scaled available for =210-308 ms is consistent with that of . Between =397 and 500 ms several humps were seen on the profile of . Although less significant, scaled showed a similar hump for =402-451 ms. (Note that the same humps were also detected by the BAT detector on the Swift spacecraft7.) The physical origin of these humps is not clear at the moment, but may represent some additional energy-releasing process. After =470 ms, again decayed with an e-fold time of ms.
To convert the observed count rates to physical quantities such as energy flux, we need the energy spectrum information, which was not available from the Geotail observation alone. We have therefore taken three reported function forms at the peak of the giant flare4,5,7 (Table 1) and integrated them above 50 keV. We then found that the resultant estimations of photon number flux, energy flux and fluence (for =0-600 ms) are almost independent of the choice of the energy spectrum, and are photons cm-2 s-1, erg s-1 cm-2 and erg cm-2, respectively. The corresponding total energy radiated from SGR 1806-20 is estimated to be (/4) d erg, where d15 is the distance scaled by 15 kpc and is the solid angle of the radiation. Here we note that the solid-angle factor (/4) is not likely to be as small as 10-2, as is typically assumed for relativistic jets for GRBs. (/4) is more likely for the intense initial spikes of SGRs because they have been seen in all the three giant flares of SGRs that could have been detected without them. Therefore the presence of a very efficient mechanism is implied, which promptly releases (on a timescale of ms) a major fraction of the stored magnetic energy in a magnetar, BR erg (where B15 and R6 are the internal magnetic field scaled by 1015 G and the radius of the magnetar scaled by 106 cm). Alternatively, as suggested by ref. 2, the internal magnetic field could be as strong as (5-10) G so as to permit the emission of multiple giant flares over the lifetime of a magnetar.
As we noted above, there were humps in the light curve of the 2004 giant flare at =400-500 ms. Similar humps were also observed9 at 200-600 ms after the onset of another giant flare of SGR 1900+14 on 27 August 1998, whose total energy is smaller by a factor of than the 2004 giant flare. From similarities in the timings of the humps despite the large difference in the total energies, we suggest that the humps more probably represented continuing energy injections, rather than the results of interactions of the flare ejecta with environmental matter.
Methods
The Low Energy Particle (LEP) experiment10 aboard Geotail consists of an ion detector with seven independent MCPs and electronics systems, and an electron detector with seven independent CEMs and electronics systems, both of which are designed to measure plasma particles in the solar wind and magnetospheric environment. When the giant flare occurred, Geotail was at (-1.5997,-97945,-19671) km using the Geocentric Solar Inertia (GCI) coordinates (J2000), which was in the solar wind about earth radii upstream from the bow shock. Although MCPs and CEMs kept measuring the solar wind ions and electrons throughout the giant flare interval, these particles were being selected electrostatically and came into the detectors mainly at some limited timings that fortunately did not overlap the giant flare interval: the contribution of solar wind ions to , which is the sum of counts over seven MCPs, was at most 30, and thus was negligible for the study of intense -ray photons. On the other hand, during subintervals ( ms, 175 ms200 ms, 320 ms400 ms and 450 ms600 ms) , , which is the sum of counts over seven CEMs, was affected by solar wind electrons, and was not available for the -ray photon detection.
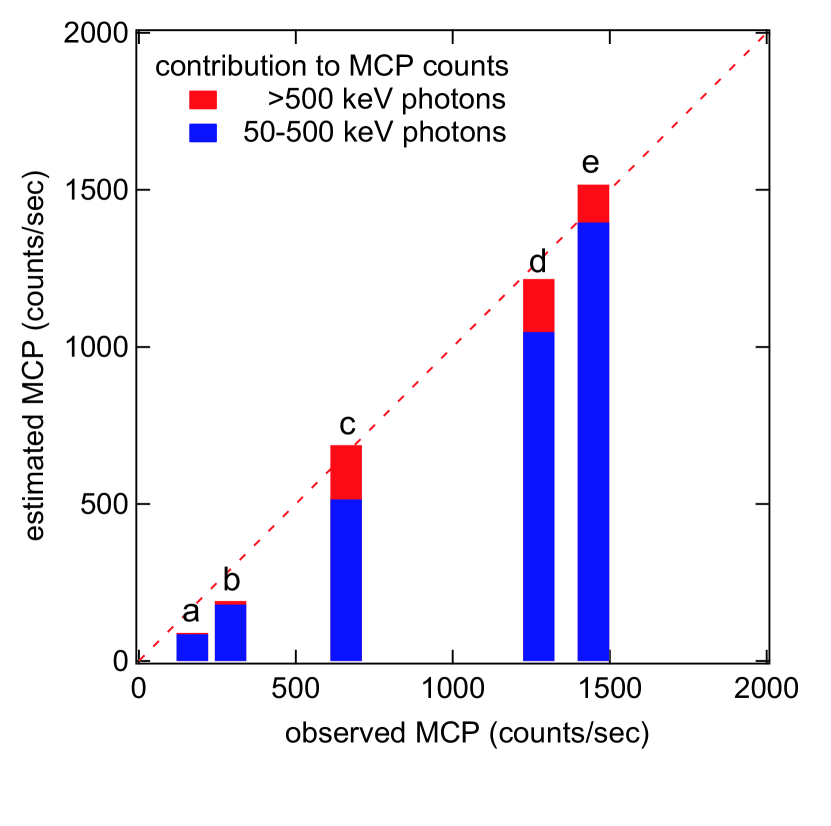
Another fortunate factor was that the angular distance between the Sun and SGR 1806-20 was degrees, so that previous knowledge of the ‘calibration’ of the LEP detector to be used as a soft -ray photon counter on the basis of solar flare photon analysis was directly applicable to the interpretation of the observed characteristics of photons from SGR 1806-20. By comparing the count rates of MCP and CEM with the hard X-ray11 and -ray12 data from the Yohkoh space solar observatory during major solar flares in 1997-2001 (ref.13), we have seen that MCP and CEM are sensitive to soft -ray photons above keV, where their sensitivities are evaluated as the product [S] of quantum efficiency and effective detection area summed over seven MCPs and seven CEMs against -ray photons. (Here is defined to include not only the detector response itself but also the attenuation factor inside the spacecraft.) From the spectral information provided by the Yohkoh observations, we have calculated photon fluxes in two energy ranges, L (50-500 keV) and H (above 500 keV), and then estimated []MCP,L and []MCP,H separately for these two energy ranges. (This separation is possible because the energy spectra of incident solar -ray photons differ from event to event.) Figure 2 shows the calibration result. Along the line of sight towards SGR 1806-20, we have found that []MCP,L=(0.190.06) cm2 and []MCP,H=(0.220.16) cm2 where systematic errors are included. The estimation of []CEM has been also done with solar flare -ray photons, and the result is summarized as []CEM1/280 of []MCP. The smallness of []CEM as compared with []MCP is consistent with the difference in physical sizes of CEMs (millimetres) and MCPs (several centimetres).
It is noted that []MCP obtained above is by a factor - smaller than those of conventional -ray detectors. Nonetheless MCPs were saturated during ms of the onset of the giant flare of SGR 1806-20. We have made that the dead-time analysis for MCPs and found that the characteristic dead time is s, which is consistent with the pre-flight calibration of the LEP system as well as the calculated circuit time constant. , shown in Fig. 1, is after the dead-time correction, which becomes significant above counts. On the other hand, CEMs, which are two orders of magnitude less sensitive than MCPs, were found to be free from the saturation effect even at the peak of the giant flare.
Acknowledgments
We thank R. Yamazaki, K. Ioka, K. Shibata, T. Minoshima and K. Hurley for comments and discussions. This work was supported in part by grants from the Ministry of Education, Culture, Sports, Science and Technology of Japan.
References
- (1) 1. Thompson, C. & Duncan, R. C. The soft gamma repeaters as very strongly magnetized neutron stars-I. Radiative mechanism for outbursts. MNRAS 275, 255-300 (1995).
- (2) 2. Thompson, C. & Duncan, R. C. The soft gamma repeaters as very strongly magnetized neutron stars. II. Quiescent neutrino, X-ray, and Alfven wave emission. Astrophys. J. 473, 322-342 (1996).
- (3) 3. Thompson, C. & Duncan, R. C. The giant flare of 1998 August 27 from SGR1900+14. II. Radiative mechanism and physical constraints on the source. Astrophys. J. 561, 980-1005 (2001).
- (4) 4. Hurley, K. et al. A tremendous flare from SGR 1806-20 with implications for short-duration gamma-ray bursts. Nature (this issue), astro-ph/0502329 (2005).
- (5) 5. Mazets, E. P. et al. The Konus-Wind and Helicon-Coronas-F detection of the giant -ray flare from the soft -ray repeater SGR 1806-20. astroph/0502541 (2005).
- (6) 6. Mereghetti, S. et al. The first giant flare from SGR 1806-20: obsetvations with the INTEGRAL SPI Anti-Coincidence Shield. Astrophys. J. Letters (in press), astro-ph/0502577 (2005).
- (7) 7. Palmer, D. M. et al. Gamma ray obsetvations of a giant flare from the magnetar SGR 1806-20. Nature (this issue), astro-ph/050303 (2005).
- (8) 8. Barat, C. et al. Fine time structure in the 1979 March 5 gamma ray burst. Aston. Astrophys., 126, 400-402 (1983).
- (9) 9. Mazets, E. P. et al. Activity of the soft gamma repeater SGR 1900+14 in 1998 from Konus-Wind obsetvations: 2. The giant August 27 outburst. Astron. Letters 25, 635-648 (1999).
- (10) 10. Mukai, T. et al. The low energy particle (LEP) experiment onboard the Geotail satellite. J. Geomag. Geoelectr. 46, 669-692 (1994).
- (11) 11. Kosugi, T. et al. The hard X-ray telescope (HXT) for the solar-A mission. Solar Phys. 136, 17-36 (1991).
- (12) 12. Yoshimori, M. et al. The wide band spectrometer on the solar-A. Solar Phys. 136, 69- 88 (1991).
- (13) 13. Matsumoto, Y. et al. A statistical study of gamma-ray emitting solar flares observed with Yohkoh. PASJ 57, 211-220 (2005)
Correspondence and requests for materials should be addressed to T. T. (e-mail: terasawa@eps.s.u-tokyo.ac.jp).
| Model | Photon flux | Energy flux | Fluence | Isotropic luminosity | Isotropic total energy |
|---|---|---|---|---|---|
| (photons cm-2 s-1) | (erg cm-2 s-1) | (erg cm-2) | (erg s-1) | (erg) | |
| Planck | |||||