Anisotropic mass ejection in binary mergers
Abstract
We investigate the mass loss from a rotationally distorted envelope following the early, rapid in-spiral of a companion star inside a common envelope. For initially wide, massive binaries ( yr), the primary has a convective envelope at the onset of mass transfer and is able to store much of the available orbital angular momentum in its expanded envelope. Three-dimensional SPH calculations show that mass loss is enhanced at mid-latitudes due to shock reflection from a torus-shaped outer envelope. Mass ejection in the equatorial plane is completely suppressed if the shock wave is too weak to penetrate the outer envelope in the equatorial direction (typically when the energy deposited in the star is less than about one-third of the binding energy of the envelope). We present a parameter study to show how the geometry of the ejecta depends on the angular momentum and the energy deposited in the envelope during a merging event. Applications to the nearly axisymmetric, but very non-spherical nebulae around SN 1987A and Sheridan 25 are discussed, as well as possible links to RY Scuti and the Small Magellanic Cloud object R4.
keywords:
hydrodynamics – binaries: close – circumstellar matter – supernovae: individual: SN1987A1 Introduction


The common-envelope (CE) phase is one of the most important and least understood phases of stellar evolution. Originally proposed by Paczyński (1976) to explain the origin of short-period binaries with compact objects, it can also significantly alter the evolution of systems in which the envelope remains bound, leaving an atypical single star (see e.g. Ivanova & Podsiadlowski, 2003). For example, it is now widely believed that the unusual properties of the progenitor of SN 1987A are due to a binary merger some 20,000 yr before the explosion (Podsiadlowski & Ivanova, 2003).
In this paper we are interested in the case where the primary initiates mass transfer either when crossing the Hertzsprung gap (so-called early case B mass transfer) or later as a red supergiant (late case B/C mass transfer). In the latter case, the primary has already developed a deep convective envelope and mass transfer is dynamically unstable if the mass ratio exceeds a critical value, leading to a common-envelope and spiral-in phase.
Early case B mass transfer initially occurs on the thermal timescale of the mass donor and is dynamically stable; but the secondary may not be able to accrete all of the transferred mass, and this may also lead to a common-envelope system and possibly the merging of the system (e.g. Pols, 1994; Wellstein, Langer & Braun, 2001).
While the common envelope maintains co-rotation with the embedded binary, orbital angular momentum is efficiently transferred from the binary orbit to the envelope, where most of the initial orbital angular momentum is stored
| (1) |
where is the orbital separation in units of 2500 , and are the masses of the primary and the secondary in units of and (as indicated by the subscripts), respectively, and is the total mass in units of . This phase may last perhaps for a few decades and ends when the envelope becomes differentially rotating. The subsequent rapid plunge-in of the secondary then drives significant envelope expansion and the ejection of at least some of the envelope (Meyer & Meyer-Hofmeister, 1979; Sandquist et al., 1998; Taam & Sandquist, 2000; Podsiadlowski, 2001; Ivanova & Podsiadlowski, 2003). If the envelope is not completely ejected in this phase (the case of interest in this study), the spiral-in continues and now becomes self-regulated where all the energy dissipated by the further orbital decay is transported to the surface and radiated away (Meyer & Meyer-Hofmeister, 1979; Podsiadlowski, 2001). A second phase of mass loss may result from a nuclear flash that may occur during the final core merger (Ivanova & Podsiadlowski, 2003).
Previous one-dimensional numerical simulations by Podsiadlowski (2001) have shown that significant mass loss may occur even when most of the envelope remains bound. In the three dimensional models of Livio & Soker (1988) and Sandquist et al. (1998), most mass loss occurs in the orbital plane of the binary. However, these authors considered the case where most/all of the envelope was ejected. In this study, we consider the less energetic case appropriate for a merger. As we will show, in this case mass loss may preferentially occur at mid-latitudes and be suppressed in the equatorial direction if the energy deposited is less than about one-third of the binding energy of the envelope. In section 2 we outline our numerical method and in section 3 we present the main results of our study and their dependence on the input parameters. In section 4 we apply these results to observed systems, in particular SN 1987A and Sheridan 25.
2 Numerical Method
We model the common envelope as a condensed polytrope with adiabatic index with a central point mass which contains two-fifths of the system mass111These parameters were chosen to roughly represent the inferred properties during the late spiral-in phase for merger models of SN 1987A, where the core fraction represents the immersed binary core, consisting of the core of the primary and the spiraling-in companion.. Assuming spherical symmetry and hydrostatic equilibrium initially, we obtain the radial density profile by integrating the dimensionless equations,
| (2) |
| (3) |
with the inner boundary conditions
| (4) |
and
| (5) |
where , and . The free parameters are determined from the surface boundary conditions where . For all hydrodynamical simulations presented in this paper, we use the GADGET code of Springel, Yoshida & White (2001), which implements gravity and gas dynamics using the smoothed particle hydrodynamics (SPH) method (Monaghan, 1992). The envelope density is sampled with particles using a Monte-Carlo method followed by isentropic relaxation to reduce numerical noise (Lucy, 1977). The code units are , the mass of the envelope and , the initial (non-rotating) stellar radius (the total stellar mass including the core is ). This implies that time is measured in the code in units of and velocity in units of . Note that this allows simple re-scaling of the results presented in this paper.
To parametrize the spin-up of the envelope and the energy deposited by the spiral-in, we define two parameters and , where is the ratio of the energy deposited to the binding energy of the envelope and is a dimensionless measure of of the envelope angular momentum following the early in-spiral of the secondary.
To spin up the envelope we add angular momentum on a dynamical timescale using the following recipe: during every fixed timestep , the rotational velocity of each particle is incremented by an amount
| (6) |
i.e. as long as the velocity remains sub-Keplerian. The angular velocity increment is of the critical velocity at the surface of the non-rotating envelope ( in code units). If at any time the particle velocity reaches the local Keplerian velocity, we set thereafter. This leads to solid body rotation in the inner envelope and a slightly rising specific angular momentum profile in the outer envelope (see Fig. 1). The spin-up phase is terminated when reaches 0.235, 0.588, 0.817, respectively, for the three cases we consider in this paper (note that no particles become super-critical; see Figure 2 and Table 1). These three values correspond to envelope angular momenta of and which is comparable to the available orbital angular momentum (equation 1).
To simulate the deposition of the energy and the rapid heating of the envelope during the plunge-in phase, we then add entropy to the inner envelope [, from calculations discussed in Ivanova & Podsiadlowski (2003) and Podsiadlowski (2001)]. Initially, we consider the case where the energy is deposited immediately after the envelope has been spun up. The response of the envelope is then followed for 10 – 15 dynamical timescales after the instantaneous energy deposition, at which point all the ejected particles are to good approximation on ballistic trajectories.
Since we do not follow the evolution of the spiraling-in binary components, we do not encounter resolution problems when the orbital separation becomes comparable to the SPH smoothing length (Livio & Soker, 1988); our model is mainly limited by physical approximations (such as the equation of state; the lack of energy transport) rather than the numerical resolution (see Appendix A) – except near the surface. The steep density profile at the surface is poorly resolved by SPH particles, and a well known problem of SPH models in this context (as, e.g., seen in supernova models) is an over-estimate of the mass contained in low-velocity material.
3 Results and discussion
| 0.039 | 0.117 | 0.151 | |
| 0.235 | 0.588 | 0.817 | |
| Angular momentum | 2.3 | 5.7 | 8.0 |
| Mean angular velocity | 3.7 | 2.2 | 1.1 |
| Flattening | 1.7 | 4.3 | 6.8 |
| Rotation velocity (km/s) | 42 | 21 | 15 |
| Fraction of critical rotation | 0.96 | 0.69 | 0.61 |
| Binding energy ( ergs) |
| (years) | 0.67 | 1.35 | 2.69 |
| 0.090 | 0.078 | 0.071 | |
| Angular momentum | 5.7 | 5.7 | 5.7 |
| Mean angular velocity | 1.46 | 1.07 | 0.71 |
| Flattening | 5.2 | 5.4 | 7.0 |
| Rotation velocity (km/s) | 18 | 16 | 13 |
| Fraction of critical rotation | 0.67 | 0.63 | 0.57 |
| Binding energy ( ergs) | |||
| 0.121 | 0.104 | 0.088 | |
| Angular momentum | 8.0 | 8.0 | 8.0 |
| Mean angular velocity | 0.79 | 0.61 | 0.42 |
| Flattening | 7.5 | 8.3 | 9.6 |
| Rotation velocity (km/s) | 14 | 13 | 11 |
| Fraction of critical rotation | 0.58 | 0.56 | 0.52 |
| Binding energy ( ergs) |
As shown in Figure 1, the addition of substantial angular momentum strongly distorts the envelope (see, in particular, the calculation and Table 1). These profiles are similar to the sequence of inviscid polytropic models calculated in Bodenheimer & Ostriker (1973), although our envelopes are more extended for a given value of (the ratio of kinetic to potential energy) due to some viscous heating. The outer envelopes contain and for and , respectively, and both have a temperature of K.
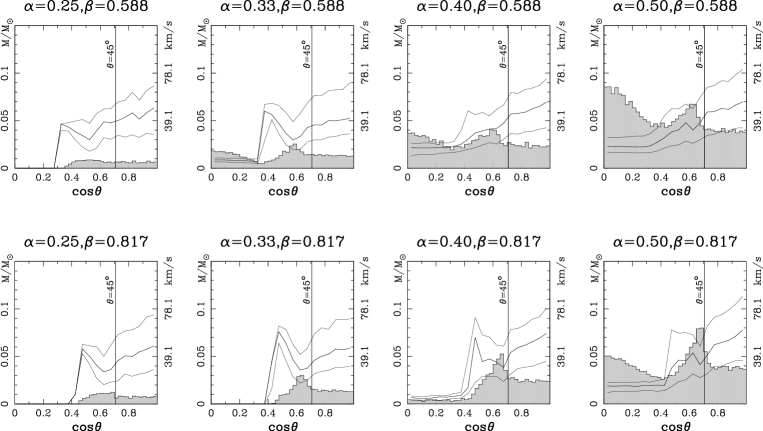

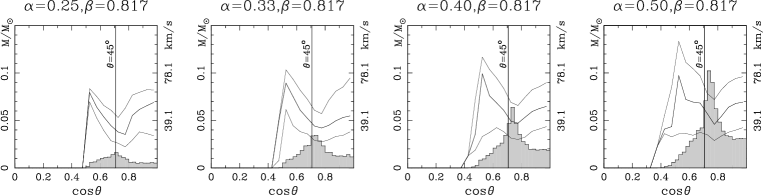
Following the energy deposition, matter is ejected in a very anisotropic way depending on the rotational distortion and the amount of energy deposited (i.e. depend on and ; see Fig. 3). Generally envelope material is first ejected (i.e. reaches escape speed) in the polar direction. At low rotation (, not illustrated) mass is also ejected in the equatorial plane at early times, and the distribution is more or less spherically symmetric. For larger values of , envelope ejection in the equatorial plane is suppressed for low values of or enhanced for large values of . In particular, no mass is lost in the equatorial plane if the energy fraction is less than some critical value which increases with increasing . If no matter is ejected in the equatorial plane, we find a strong mass excess at mid-latitudes due to shock focusing by the extended envelope (as discussed further below).
In Sections 3.1 and 3.2 we discuss two typical calculations with , and , , respectively. In the case, the critical energy fraction is (from Figure 4), and therefore no material is ejected in the equatorial plane. In both these calculations energy is deposited immediately after the spin-up phase.
In Section 3.3 we discuss the mass loss geometry due to a variation of and for different time delays between the spin-up and energy deposition phase (no time delay and a delay of 1.35 yr, respectively; see also Table 2). The dynamical time delay is a free parameter in our model which could be constrained by more detailed models that follow the spiral-in explicitly.
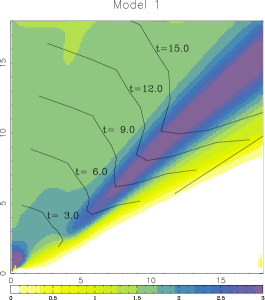
3.1 Model 1:

In this model, the envelope is significantly distorted by the rotation (column 3 of Table 1), and most mass is ejected at a latitude between and . Despite the reduction in the effective gravity close to the equator, very little mass is ejected there. The absence of ejected material in the equatorial plane is relatively easy to understand from the strong rotational deformation, since the shock wave cannot penetrate the outer envelope in the equatorial direction.
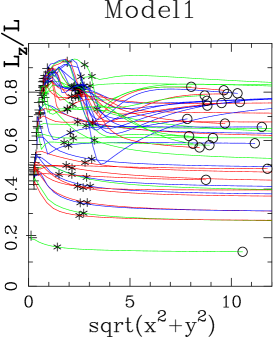
However, it is not quite so obvious how the mass enhancement at mid-latitudes arises. To illustrate the origin of this enhancement, we plot in Figure 5 the evolution of the angular momentum in the z-direction relative to the total angular momentum for selected particles, which eventually escape, as a function of distance from the rotation axis during the early ejection phase. The ratio parametrises the inclination of the orbit of a particle, and its change shows the effects of the strong pressure gradients that act during this phase. Particles initially ejected at mid-latitudes move poleward shortly after ejection, reach a minimum in before (e.g. the blue trajectory in Figure 5 which reaches a minimum at ) and then evolve towards a ballistic orbit with a lower inclination.
During the strong poleward deflection at , a bow shock forms ahead of the massive outer envelope (see Figure 6), which deflects particles away from the equatorial plane. Hence the mass loss poleward of changes from isotropic at to strongly peaked at , where is the co-latitude.
The second deviation in Figure 5 can be understood by the reflection of particles from slow-moving material at higher latitudes, which was ejected slightly earlier. This leads to a compression of the outflow at mid-latitudes (), increasing the density enhancement. After the particles follow nearly radial trajectories, although the trajectories are not yet quite ballistic. By the flow is almost completely ballistic (as indicated by the fact that remains constant thereafter).
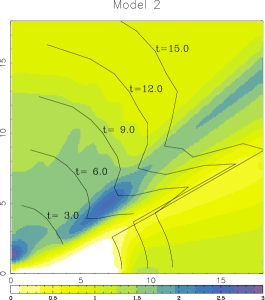
3.2 Model 2:
The principal effect of the reduced angular momentum of the envelope is that the shock wave eventually reaches the surface in the equatorial region, and that some material is ejected there at low velocities (similar to the and model in Fig. 3 but with a larger excess at mid-latitudes). The total ejected mass at is , of which is ejected per unit solid angle in the equatorial plane, a value that is close to the value one would expect if the ejected mass had spherical symmetry. Initially the flow is compressed due to the Bjorkman-Cassinelli effect (Bjorkman & Cassinelli, 1993), but a strong density enhancement of one to two orders of magnitude does not form due to the fact that our envelope is extended and mainly supported by thermal pressure.
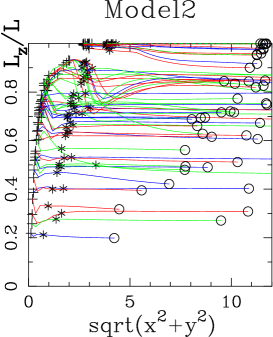
The mid-latitude enhancement contains a similar amount of mass as Model 1 discussed above, although its latitude is closer to the equator. As can be seen in Figure 7, the flow is qualitatively similar to Model 1 (Figure 5), but the shock interactions occur at lower latitudes since the star is less rotationally flattened. The velocity profile is similar in the polar region, since almost the same amount of energy was deposited in the envelope.
As in Model 1, the initial polar enhancement is caused by the absence of ejected matter elsewhere at early times. This leads to a large asphericity factor as a result of the small solid angle into which mass is ejected. Once mass has been ejected at lower latitudes, the ‘enhancement’ disappears.
3.3 Parameter study
| 0.25 | 0.24 | 0.17 | 0.14 | 0.17 | 0.21 | 0.18 | 0.15 | 0.16 | 0.18 |
|---|---|---|---|---|---|---|---|---|---|
| 0.33 | 0.44 | 0.55 | 0.32 | 0.36 | 0.42 | 0.34 | 0.32 | 0.34 | 0.38 |
| 0.4 | 0.83 | 1.12 | 0.51 | 0.55 | 0.63 | 0.68 | 0.49 | 0.51 | 0.58 |
| 0.5 | 1.33 | 2.15 | 1.10 | 0.91 | 1.00 | 1.67 | 0.79 | 0.81 | 0.89 |
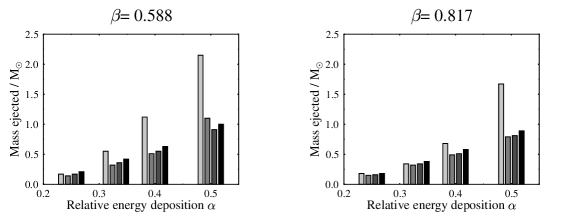
In general, the mass ejected depends on three principal parameters, the amount of energy deposited (), the total angular momentum in the envelope () and the time delay between the spin-up of the envelope and the deposition of the energy (), which depends on the timescale of the initial spiral-in phase. Variation of these parameters leads to changes in i) the total ejected mass, ii) the presence or absence of ejected material in the equatorial plane, and iii) the strength of the enhancement at mid-latitudes. The peak mass flux also moves to slightly higher latitudes with increasing rotation.
In Figure 3 we show the results of a systematic parameter study. Each panel shows the geometry of the ejected mass as a function of , where is the polar angle, once the ejecta are expanding ballistically on radial trajectories. The histograms show the mass ejected divided into bins of constant (each bin subtends sr), and the individual curves show the velocity distribution at each angle (the central curve gives the median velocity, and the upper and lower curves give the velocity range which includes 50 % of the ejected matter). The velocity and angular momentum scale according to
| (7) |
| (8) |
The peak at mid-latitudes, which is only present for sufficiently distorted envelopes with , remains up to . The mass excess at mid-latitudes becomes more pronounced as the angular momentum increases. The velocity of the equatorial material, when present, is typically a factor of 3 – 5 lower than the velocities at mid-latitudes, though this difference is reduced as the deposited energy is increased. The critical below which no mass is lost in the equatorial plane increases with rotation rate (see Figure 4), since the envelope is more extended.
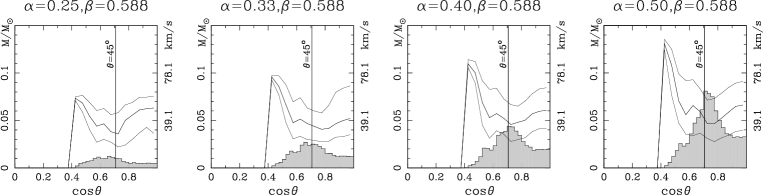
The trends remain very similar, when we introduce a time delay between the spin-up phase and the energy deposition phase (see Figure 8), except that the loss of material in the equatorial plane is now further impeded by the massive extended envelope, and the mid-latitude enhancement may be much stronger (see, for example, the , , case). The peak has moved to slightly higher latitudes compared to the zero delay case, but this is a small effect. During the time delay the outer envelope expands by a factor with a corresponding increase in the critical energy for equatorial mass ejection. Hence increasing the energy drives more mass from each surface element but has little effect on the geometry. The total mass ejected for each value of the energy deposition and time delay is listed in Table 3 and illustrated in Figure 9.
3.4 Summary
Mass ejection during a common-envelope phase leading to the complete merger of a binary system preferentially occurs at mid-latitudes due to shock reflection from an outer envelope containing a significant fraction of the initial orbital angular momentum. If the energy deposited is less than about one-third of the binding energy of the envelope no material is lost in the equatorial plane, in contrast to earlier models which considered the higher energy case appropriate for CE ejection (Livio & Soker, 1988; Sandquist et al., 1998).
Although our results cannot be directly compared to those of Sandquist et al. (1998) since we do not model the in-spiral of the secondary, a number of similarities are apparent. The peak energy dissipation occurs when the orbital separation is approximately one-tenth of its initial value and the red giant envelope is already aspherical which is consistent with our prescription. Most of the mass loss () is concentrated in the equatorial plane in this more energetic case. The equivalent energy parameter is whereas we consider the range .
4 Applications to SN1987A and Sheridan 25
| Star | Spectral type | Period | Luminosity | Equatorial torus | |||
|---|---|---|---|---|---|---|---|
| Density (cm-3) or mass | ( cm) | (km/s) | t (yrs) | ||||
| Sk | B3 Ia | - | 10.3 | 19,000 | |||
| Sher 25 | B1.5 Iab | - | 6.2 | 20 | 6,600 | ||
| RY Scuti | O6.5 + O9.5b | 11.3d | ? | 0.2 | 50 | 130 | |
| Car | ? Ia | (5.5yr) | 0.7 | 50 | |||
| R4d | B[e] + A | (21.3yr) | ? | ? | ? | ||
Many non-spherical nebulae are axially symmetric, which has been interpreted as evidence for rapid rotation, possibly as a result of binary interactions. A notable example is the mysterious nebula surrounding the supernova SN 1987A, which consists of three roughly parallel rings, one centered on the supernova and the other two displaced by arc-second to either side (Burrows et al., 1995). The supernova itself was anomalous in several other respects (see Podsiadlowski, 1992, and references therein), which are most consistent with a binary merger some 20,000 years before the supernova event (Podsiadlowski, 1992; Podsiadlowski & Ivanova, 2003). In particular, the blue supergiant progenitor and the chemical anomalies in the inner ring can easily be explained as the result of the dredge-up of core material in the final stage of the merger (Ivanova & Podsiadlowski, 2003).
The fast wind () of such a blue supergiant will sweep up and enhance any structures already present in the ejecta, leading to an axially symmetric but highly aspherical nebula.
4.1 Late case B/C merger: SN 1987A
During late He shell burning the primary will be a red supergiant with a critical surface rotation velocity of
| (9) |
which is comparable to the velocities observed in the SN 1987A nebula (see Table 4). The latitude-dependence of the ejected material of Model 1, shown in Figure 10, is characterised by a strong enhancement at mid-latitudes, while no material is lost in the equatorial region. The following features of the nebula may therefore be understood:
-
(i)
Strong mass enhancement in the outer rings. The outer rings (ORs) are a real density enhancement ( the ambient value) and are not simply due to limb brightening of an hourglass structure (Burrows et al., 1995). In our model the ORs result from wind-driven pressure gradients in the seed structures which directly result form the anisotropic ejection of material during the merger phase. Previous models based only on equatorial density enhancements in the pre-existing material have been unable to explain the high density in the ORs (e.g. Martin & Arnett, 1995).
-
(ii)
Displacement of the outer rings relative to the inner ring. We favour a model in which the inner ring originates a few 1000 years after the merger event, in a rotation-enforced outflow during contraction on the post-merger blue loop (Heger & Langer 1998; also see Collins et al. 1999). The relative displacement of the outer rings can be understood if the mass ejection during the merger event itself was slightly asymmetric, perhaps due to a non-axisymmetric pulsational instability in the envelope, which gives the ejecta a velocity of km s-1 relative to the merger remnant. Hence the wind-driven pressure gradients are no longer axisymmetric and the planes222The outer rings are still approximately planar in this case. in which the outer rings lie will be slightly inclined with respect to the plane of the inner ring. This would explain both the offset of the outer rings and their shape, which is noticeably non-elliptical in projection.
-
(iii)
North/South asymmetry. Since the planes of the outer rings are no longer parallel to one another, the Southern outer ring is observed closer to face-on in projection than the Northern one.
4.2 Case B merger: Sher 25
Mass loss during common-envelope evolution may explain the broadly similar structures seen around other luminous stars, listed in Table 4. Of these, the nebula around the B1.5 supergiant Sheridan 25 shows the most compelling similarities, since it has an equatorial ring of at least (Brandner et al., 1997b) and polar lobes, each containing . It is in a post main sequence, though probably pre-red supergiant, evolutionary state (with N/C , N/O , Smartt et al., 2002). The dynamical age of the nebula has been estimated to be around 6,000 years. The observed velocities suggest an envelope radius of at the time of ejection, corresponding to a merger during the Hertzsprung gap crossing.
Although the density structure of the common envelope will differ from that of a condensed polytrope, the results may still be applicable if the envelope is aspherical. We suggest a model with equatorial mass loss during the merger, such as Model 2 discussed above (see right-hand panel of Figure 10), since the envelope cannot store enough angular momentum to generate a significant post-merger equatorial outflow. Hence an asymmetry during the merger will displace both the equatorial and polar material from the site of the merged star. The equatorial ring is offset from Sher 25 by pc (Brandner et al., 1997a), which is consistent with this model.
4.3 Conclusions
The three principal anomalous features of the supernova SN1987A, viz. its blue supergiant progenitor, its over-abundance of certain elements, notably He, and the presence of highly structured circumstellar material, are all consistent with a binary merger some 20,000 years before the explosion. In this paper, we have demonstrated how density enhancements at mid-latitudes arise during mass ejection from a rotationally distorted star. Subsequent interaction with the fast wind of the blue supergiant prior to the supernova (cf. Blondin & Lundqvist, 1993) then leads to the formation of the outer rings with a density enhancement of a factor of 150, in calculations of Morris & Podsiadlowski (2005) which will be further discussed in a future paper.
Similarly, the nebula around Sher 25 may be explained by a binary merger following a CE phase during the crossing of the Hertzsprung gap by the primary. One notable difference in this case is that the equatorial ring likely originates during the merger, which is consistent with observations showing that the centre of the equatorial ring is displaced by some 0.05 pc from Sher 25. Future observations of the rotation rate of Sher 25 would help to confirm this model.
Although the nebula around the more massive system RY Scuti (O9.5 + O6.5) appears similar, its evolution is probably somewhat different. Data from the Keck telescope and the HST, discussed in Smith et al. (1999) and Smith et al. (2001), show a massive equatorial dust torus and two narrow rings symmetrical about the equatorial plane, with a dynamical age of 120 years. The massive torus probably originated during thermal timescale mass outflow from the outer Lagrangian L2 point which is still occurring today, albeit at the much lower rate of . Subsequent deflection of the fast wind in a manner somewhat analogous to the horseshoe model of Soker (1999) may explain the origin of the two narrow rings.
Pasquali et al. (2000) have suggested that the B[e] component of the spectroscopic binary R4 in the LMC could be the result of a Case B/C merger, i.e. the system would originally have been a triple system, where the companion A star now serves as an astronomical clock and indicates that the present primary has lost % of its zero-age main-sequence (ZAMS) mass (, 1996). Since the companion is already a post-main sequence A supergiant, the pre-merger components cannot be much more massive, e.g. for the original primary. In addition, Pasquali et al. (2000) find evidence of CNO-processed circumstellar material with a dynamical age of years which is consistent with ejection during a binary merger. Direct images of the nebula would be of great benefit to understanding this system.
Bipolarity is also common in observations of planetary nebulae. Asymmetric mass loss during a common-envelope phase (with or without a merger) provides physical motivation for the equatorial density enhancement functions proposed by Icke, Balick & Preston (1999) and Luo & McCray (1991) (see also Frank, 1999). We speculate that the homunculus nebula around Carinae may also have originated during a common-envelope phase since its kinetic energy is ergs (Smith et al., 2003a), comparable to the luminous energy of the outburst. Both the mass loss rate in the stellar wind () and its latitude dependence suggest rapid rotation of the central star (Smith et al., 2003b; van Boekel et al., 2003; Aerts et al., 2004). In the merger scenario Carinae was originally a triple system in which the closer components ( d) merged 150 yr ago to leave the present companion in an eccentric 5.5-yr orbit.
Acknowledgements
The computations reported here were performed using the UK Astrophysical Fluids Facility (UKAFF). The authors would also like to thank N. Langer for stimulating discussions.
References
- Aerts et al. (2004) Aerts C., Lamers H.J.G.L.M., Molenbergh G., 2004, A&A, 418, 639
- Bjorkman & Cassinelli (1993) Bjorkman J.E., Cassinelli J.P., 1993, ApJ, 409, 429
- Blondin & Lundqvist (1993) Blondin J., Lundqvist P., 1993, ApJ, 405, 337
- Bodenheimer & Ostriker (1973) Bodenheimer P., Ostriker J.P., 1973, ApJ 180, 159
- Brandner et al. (1997a) Brandner W., Grebel E.K., Chu Y-H., Weis K., 1997a, ApJ, 475, L45
- Brandner et al. (1997b) Brandner W., Chu Y-H., Eisenhauer F., Grebel E.K., Points S.D., 1997b, ApJ, 489, L153
- Burrows et al. (1995) Burrows C. et al., 1995, ApJ, 452, 680
- Collins et al. (1999) Collins T.J.B., Frank A., Bjorkman J., Livio M., 1999, ApJ, 512, 322
- Heger & Langer (1998) Heger, A., Langer, N., 1998, A&A, 334, 210
- Frank (1999) Frank, A., 1999, New Astro. Rev., 43, 31
- Icke, Balick & Preston (1999) Icke V., Balick B., Preston H., 1989, AJ, 97, 462
- Ivanova & Podsiadlowski (2003) Ivanova N., Podsiadlowski Ph., 2003, in Hillebrandt W., Leibundgut B., eds, From Twilight to Highlight: The Physics of Supernovae. Springer, Berlin, p. 19
- Livio & Soker (1988) Livio M., Soker N., 1988, ApJ, 329, 764
- Lucy (1977) Lucy L. B., 1977, AJ, 82, 1013
- Luo & McCray (1991) Luo D., McCray R., 1991, ApJ, 379, 659
- Martin & Arnett (1995) Martin C. L., Arnett D., 1995, ApJ, 447, 378
- Meyer & Meyer-Hofmeister (1979) Meyer, F., Meyer-Hofmeister E., 1979, A&A, 78, 167
- Monaghan (1992) Monaghan J.J., 1992, ARA&A, 30, 543
- Morris et al. (1999) Morris P.W. et al., 1999, Nature, 402, 502
- Morris & Podsiadlowski (2005) Morris T. & Podsiadlowski Ph., 2005, in Turratto M., ed, 1604-2004: Supernovae as Cosmological Lighthouses. PASP, San Francisco, p. 194
- Paczyński (1976) Paczyński B., 1976, in Eggleton P., Mitton S., Whelan J., eds, Structure and Evolution of Close Binary Systems. Reidel Publishing Co., Dordrecht, p. 75
- Panagia (2004) Panagia N., 2004, in Marcaide J.M., Weiler K.W., eds., Supernovae: Ten Years of SN1993J. Springer, Berlin, p. 585
- Pasquali et al. (2000) Pasquali A., Nota A., Langer N., Schulte-Ladbeck R.E., Clampin M., 2000, AJ, 119, 1352
- Podsiadlowski (1992) Podsiadlowski Ph., 1992, PASP, 104, 717
- Podsiadlowski (2001) Podsiadlowksi Ph., 2001, in Podsiadlowski Ph., Rappaport S., King A.R., D’Antona F., Burderi L., Evolution of Binary and Multiple Star Systems. PASP, San Francisco, p. 239
- Podsiadlowski & Ivanova (2003) Podsiadlowski Ph., Ivanova N., 2003, in Hillebrandt W., Leibundgut B., eds, From Twilight to Highlight: The Physics of Supernovae. Springer, Berlin, p. 13
- Pols (1994) Pols, O.R., 1994, A&A, 290, 119
- Sandquist et al. (1998) Sandquist E.L. et al., 1998, ApJ, 500, 909
- Smartt et al. (2002) Smartt S.J., Lennon D.J., Kudritzki R.P., Rosales F., Ryans R.S.I., Wright N., 2002, A&A, 391, 979
- Smith et al. (1999) Smith N., Gerhz R.D., Humphreys R.M., Davidson K., Jones T.J., Krautter J., 1999, AJ, 118, 960
- Smith et al. (2001) Smith N., Gerhz R.D., Goss W.M., 2001, AJ, 122, 2700
- Smith et al. (2003a) Smith N., Gerhz R.D., Hinz P.M., Hoffmann W.F., Hora J.L., Mamajek E.E., Meyer M.R., 2003a, AJ, 125, 1458
- Smith et al. (2003b) Smith N., Davidson K., Gull T.R., Ishibashi K., Hillier D.J., 2003b, ApJ, 586, 432
- Soker (1999) Soker N., 1999, MNRAS 303, 611
- Springel, Yoshida & White (2001) Springel V., Yoshida N., White, S.D.M., 2001, New Astro., 6, 51
- Taam & Sandquist (2000) Taam R.E., Sandquist E.L., 2000, ARA&A, 38, 113
- van Boekel et al. (2003) van Boekel R., Kervella P., Schöller M., Herbst T., Brandner W., de Koter A., Waters L.B.F.M., Hillier D.J., Paresce F., Lenzen R., Lagrange A.-M., 2003, A&A, 410, 37
- Wellstein, Langer & Braun (2001) Wellstein S., Langer, N., Braun, H., 2001, A&A, 369, 939
- (39) Zickgraf F.-J., Kovacs J., Wolf B., Stahl O., Kaufer A., Appenzeller I., 1996, A&A 309, 505
Appendix A Resolution Study
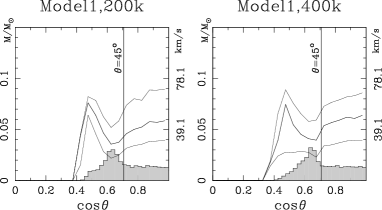
Figure 11 shows that increasing the number of particles by a factor of two does not significantly change the geometry of the ejecta. This implies that our calculations have converged numerically. The calculation is limited by the physical approximations such as the assumption of a polytropic equation of state.