Dust Growth and Settling in Protoplanetary Disks
and Disk Spectral Energy Distributions:
I. Laminar Disks
Abstract
Dust growth and settling considerably affect the spectral energy distributions (SEDs) of protoplanetary disks. We investigated dust growth and settling in protoplanetary disks through numerical simulations to examine time-evolution of the disk optical thickness and SEDs. In the present paper, we considered laminar disks as a first step of a series of papers. As a result of dust growth and settling, a dust layer forms around the mid-plane of a gaseous disk. After the formation of the dust layer, small dust grains remain floating above the layer. Although the surface density of the floating small grains is much less than that of the dust layer, they govern the disk optical thickness and the emission. Size distributions of the floating grains obtained from numerical simulations are well-described by an universal power-law distribution, which is independent of the disk temperature, the disk surface density, the radial position in the disk, etc. The floating small grains settle onto the dust layer in a long time scale compared with the formation of the dust layer. Typically, it takes yr for micron-sized grains. Rapid grain growth in the inner part of disks makes the radial distribution of the disk optical thickness less steep than that of the disk surface density, . For disks with , the radial distribution of the optical thickness is almost flat for all wavelengths at yr. At yr, the optical thickness of the inner disk ( a few AU) almost vanishes, which may correspond to disk inner holes observed by Spitzer Space Telescope. Furthermore, we examined time-evolution of disk SEDs, using our numerical results and the two-layer model. The grain growth and settling decrease the magnitude of the SEDs especially at m. Our results indicate that grain growth and settling can explain the decrease in observed energy fluxes at millimeter/sub-millimeter wavelengths with time scales of yr without depletion of the disks.
1 INTRODUCTION
Circumstellar disks surrounding T Tauri and Herbig Ae/Be stars are thought to the birth sites of planetary systems and they are called protoplanetary disks. The physical properties of the protoplanetary disks have been inferred from analyses of their spectral energy distributions (SEDs). Analyses of observations at millimeter/sub-millimeter wavelengths suggest that the disks have masses of 0.001-0.1 and their life time is yr (e.g., Strom et al. 1989; Beckwith et al. 1990; Wyatt et al. 2003).
Recent observations with high-resolution at various wavelengths gave us much information on disk spatial structure (e.g., Grady et al. 1999; Fukagawa et al. 2004; Mundy et al. 1996; Kitamura et al. 2002; Eisner et al. 2003). For example, Kitamura et al. (2002) derived disk outer radii and surface density distributions from results of their image survey of 13 T Tauri disks and SED data. Their results show that the radial power-law index of the surface density ranges from 0 to -1, which is less steep than -1.5 in the minimum mass solar nebula (MMSN) (Hayashi 1981). Because the obtained surface densities at 100 AU is almost consistent with the MMSN, the small radial power-law index of means too small surface density at AU for planet formation in those disks.
In the most analyses of disk observations including Kitamura et al. (2002), dust growth have not been taken into account. However, the grain growth is indicated by the variety of silicate feature at 10m observed in T Tauri disks (Przygodda et al. 2003; Honda et al. 2003; Meeus et al. 2003). Dust growth usually decreases the opacity and the optical thickness of disks. If grains grow considerably in the observed disks, the estimated disk mass mentioned above would be underestimated (D’Alessio et al. 2001; Natta et al. 2004). Furthermore, dust growth is generally fast in the inner disk region compared with the outer region (Weidenschilling 1980; Nakagawa et al. 1981). Rapid decrease in the optical thickness in the inner region would make the radial distribution of the optical thickness less steep than that of the surface density. The rapid dust growth in inner regions may also be responsible to inner holes identified by Calvet et al. (2002) in TW Hydra and by Bouwman et al. (2003) in HD1000546. Furthermore, the Spitzer Space Telescope started to provide lots of new data on disk inner holes (Forrest at al. 2004; Meyer et al. 2004; Uchida et al. 2004). Hence, dust growth should be taken into account in the analyses of disk observations.
Recent models of protoplanetary disks succeeded in accounting for most properties in the observed SEDs (e.g., Chiang & Goldreich 1997; Chiang et al. 2001; D’Alessio et al. 2001; Dullemond et al. 2001; Dullemond & Dominik 2004a). Although they also examined the effect of dust growth, they a priori adopted a single power-law size distribution for a whole disk and assumed that the grain number at each size is proportional to the gas density. However, the size distribution would be considerably different at each position because of a large variety of the growth time in a whole disk, as mentioned above. Furthermore, dust settling would change the vertical distribution of dust grain in disks. Dullemond & Dominik (2004b) showed the importance of dust settling at the self-shadowing process in passive disks. To derive information correctly from observations, the more realistic model of dust growth and settling should be used.
Dust growth and settling in protoplanetary disks have been investigated by many authors for both laminar disks (e.g., Safronov 1969; Weidenschilling 1980, 1997; Nakagawa et al. 1981, 1986) and turbulent disks (e.g., Weidenschilling 1984; Mizuno et al. 1988; Schmitt et al. 1997). In laminar disks or those with sufficiently weak turbulence, dust grains grow to mm-size when they settle to the mid-plane of the gaseous disk. As a result of dust settling, a dust-rich layer is formed near the mid-plane. In the dust layer, a large number of planetesimals are thought to form as the first step of planetary formation (e.g., Goldreich & Ward 1973; Weidenschilling 1997; Youdin & Shu 2002). Because most previous studies focused on the dust layer and the planetesimal formation, they did not examine in detail a relatively small amount of micron-sized grains that remain floating after the dust layer formation. However, as suggested by Nakagawa et al (1981) and some authors, the floating small grains would play an important role in the radiative transfer in protoplanetary disks even though their total mass is small. The change in SEDs due to settling of such floating grains was examined by Miyake & Nakagawa (1995) and by Dullemond & Dominik (2004b). However, they did not consider settling coupled with growth. The variation in the disk optical thickness due to dust growth was also evaluated in some studies on dust growth and settling (Weidenschilling 1984, 1997; Weidenschilling & Cuzzi 1993; Schmitt et al. 1997). However, these evaluations were done only in short-term calculations (yr) or only at limited radial positions (i.e., 1 and 30 AU). In order to take into account dust growth in analyses of disk observations, it is necessary to clarify the general property in the long-term evolution of floating grains and disk optical depth in various disks.
In this series of papers, we investigate dust growth and settling in protoplanetary disks, focusing on floating small grains rather than large grains in dust layers. We perform numerical simulations of dust growth and settling for various disk models to obtain the general property of the spatial and size distribution of dust grains. Using the obtained spatial and size distribution of grains, we further examine time-evolution of the disk optical thickness and SEDs due to dust growth and settling. Our results show that, because of relatively rapid dust growth in the inner disk region, the disk optical thickness decreases more rapidly in the inner region than in the outer. This makes the radial distribution of the optical thickness less steep, as expected above. The dust emission at millimeter/sub-millimeter wavelengths declines on the time scale yr even without any disk depletion. Therefore, the observed decay of dust emission does not necessarily indicate disk depletion.
In the present paper, we consider laminar disks as the first step of this series of papers. As shown by Dullemond & Dominik (2004b), vertical stirring by turbulence is effective on dust settling even in weakly turbulent disks with the parameter for the disk viscosity (Shakura & Sunyaev 1973). Furthermore, since turbulence would play a crucial role in the issue of planetesimal formation in a dust layer by self-gravitational instability, it cannot be neglected on that issue. However, on the disk optical thickness, essential ingredients would be included in laminar disk cases. Thus the calculations with laminar disks would give deep insights into time-evolution of the optical thickness and disk SEDs, although the time scale can be affected by turbulence. Hence, the case in laminar disks should be firstly examined as a simple case. The case in turbulent disks will be investigated in the subsequent paper.
In the next section, we describe basic equations and our numerical model of growth and settling. We show numerical results for various disk models in Section 3. We also derive an analytical solution of the grain size distribution, which agrees well with numerical results. In Section 4, we examine time-evolution of the disk optical thickness and SEDs due to dust growth and settling. In the calculation of SEDs, we used the two-layer model proposed by Chiang & Goldreich (1997) and refined by Chiang et al. (2001). In the last section, we summarize our results and discuss the effect of turbulence on dust growth and settling.
2 EQUATIONS DESCRIBING DUST GROWTH AND SETTLING
2.1 Disk Model
We consider a passive protoplanetary disk with no turbulence around a central stars with one solar mass (). It is assumed that the disk has an inner edge at 0.1 AU and an outer edge at 150 AU. To describe the disk, we use a cylindrical coordinate system of which the origin is located at the central star. The -axis coincide with the rotation axis of the disk. In numerical simulations of dust growth and settling, we assume that the gaseous disk is isothermal in the vertical direction (i.e., in the -direction) for simplicity. As seen in the two-layer model of passive disks, however, the surface layer directly irradiated by the central star is much hotter than the disk interior. Nevertheless, our modeling of a vertical isothermal disk would be valid because dust growth and settling in laminar disks are little affected by the disk temperature, as seen in the next section. In the evaluation of SEDs in Section 4, of course, the vertical temperature distribution will be taken into account with the two-layer model.
Under this assumption, the vertical density distribution of the gas component is given in the hydrostatic equilibrium by
| (1) |
where is the gas surface density and is the pressure scale height of the disk given by . Furthermore, is the Keplerian angular velocity and is the isothermal sound speed, where , , and are the gravitational constant, Boltzmann’s constant, and the atomic mass unit, respectively; and and are the disk temperature and the mean molecular weight, respectively. We set .
Dust growth and settling change the disk temperature. Thus, exactly speaking, we need to solve coupled equations of dust growth, settling and the disk temperature. However, since a change in the disk temperature has a little effect on dust growth and settling, we use a tentative disk temperature for simulations of dust growth and settling. The tentative disk temperature is calculated in the same manner as the calculation of the temperature of the disk interior of the two-layer model (i.e., using equations [A6] and [A4] in the appendix) but, in this calculation, we assumed that the disk is optically thick () and that the height of the surface layer, , is equal to . Note that we will correctly evaluate the temperatures of the disk interior and the surface layer according to the two-layer model in the calculation of the disk SED (Section 4). The deviation of the tentative temperature from that of the disk interior reevaluated in Section 4 is within 30%.
As for the surface density distribution of gaseous disks, we adopt a power-law distribution of
| (2) |
The gas surface density at 1AU, , and the power-law index are parameters. In the standard case of the present paper, we adopt the values of the MMSN, that is, gcm-3 and . The dust-to-gas ratio and the solid material density are set to be 0.014 and 1.4gcm-3, respectively in the standard case. These values are consistent with the solar abundance when H2O ice is included in grains (Pollack et al.1994). We also examine cases with a different value of or . At , H2O evaporates and we should decrease the dust-gas ratio and increase the solid material density. However, we neglected these changes in the simulations of dust growth and settling for simplicity.
2.2 Dust Growth and Settling
To describe dust growth and settling, we adopted the basic equations used by Nakagawa et al. (1981). Let denote the number density of grains with masses between and at a height . Thus describes the distribution of grains with respect to (or the size) and . The statistical coagulation equation is used to describe evolution of the mass distribution due to collisional growth. To describe dust settling as well as growth, a vertical advection term is added to the coagulation equation. That is, the following equation is used:
| (3) |
where the kernel, , is related to the coalescence rate between grains with masses and , and is the settling velocity of dust grains. In the above, the first term on the right-hand side indicates the formation of grains of the mass by collisions between the smaller grains and the second term represents the consumption of grains with the mass due to collisions with other grains. The second term on the left-hand side is the advection one, which describes the vertical mass transport. In equation (3), we neglected the advection term due to the radial mass transport because it is effective only for relatively large grains that settle down to the dust layer. We also neglected the diffusion term due to turbulence since laminar disks are considered.
The kernel is given by , where is the collisional cross section between grains with masses and , is the sticking probability, and is the relative velocity between grains with and . For dust grains, is equal to the geometrical cross section. We assume spherical grains in the present study. Then we obtain the cross section as , where is the radius of grains with . The relative velocity will be explained in the next subsection. The sticking probability is difficult to be determined because it depends on its size, shape, material properties (e.g., Weidenschilling & Cuzzi 1993). In the present study, we regard as a parameter and assume that it is independent of the grain size.
2.3 Motion of dust grains in protoplanetary disks
In a laminar disk, grains settle toward its mid-plane. The settling velocity of each grain is given by the terminal velocity, which is determined by the balance between the gas drag force and the vertical component of the central star’s gravity. As well as such a settling velocity, Nakagawa et al. (1986) also calculate the horizontal components of the grain velocity, assuming an system of equal-sized grains. Here, we describe motion of grains with an arbitrary size distribution
We first explain the gas drag forces on grains. For a spherical grain with a mass , the gas drag force is given by
| (4) |
and the coefficient is given by
| (5) |
where and are the velocities of gas and the grain, respectively and is the mean free path. In equation (5), the first case corresponds to Epstein’s law and the second is Stokes’ law. The mean free path is given by , where is the molecular collision cross section given by cm2 (Chapman & Cowling 1970). At 1AU and 10AU on the mid-plane in the standard disk, the mean free paths are evaluated to be about 1cm and 500cm, respectively.
Next, we describe motion of gas and grains. The velocities of gas and grains, and , are obtained in a similar way to Nakagawa et al. (1986), though they considered equal-sized grains and focused on the dust layer around the mid-plane. When grains have a size distribution, the equations of motion for gas and grains are given by
| (6) | |||
| (7) |
The gas pressure is given by . At the surface layer directly irradiated by the central star, grains suffers a strong radiative pressure (Takeuchi & Lin 2003). However, we neglected the radiation pressure in equation (7) for simplicity.
We introduce a differentially rotating coordinate system with the angular velocity to eliminate the gravity of the central star in the equations of motion. Instead of and , we use the velocities, and , in the rotational frame. Since and are much smaller than the Keplerian velocity, we can neglect second-order terms of them in the equations of motion. Then, setting , we can rewrite equations (6) and (7) in the rotating cylindrical coordinates as (cf. Nakagawa et al. 1986)
| (8) | |||
| (9) | |||
| (10) |
and
| (11) | |||
| (12) | |||
| (13) |
respectively. From equations (11) and (12), the - and -components of the grain velocity are obtained as
| (14) | |||
| (15) |
where . Substituting equations (14) and (15) into (8) and (9), we also have for the - and -components of the gas velocity
| (16) | |||
| (17) |
where
| (18) |
Note that is dependent on as well as . It should be also noted that our definition of is different from that in Takeuchi & Lin (2002) by the factor 2 but the same as Nakagawa et al. (1986). The vertical velocity of the gas, , is always negligibly small compared with as shown by Nakagawa et al. (1986). Hence, from equation (13) we have
| (19) | |||
| (20) |
The obtained velocities agree with those in Nakagawa et al. (1986) in the case of the dust layer (i.e., ) with equal-sized grains. We use equations (14)-(19) at the calculation of the grain velocity in the simulations of dust growth and settling.
We finally explain the relative velocity between grains appearing in the kernel . To evaluate the relative velocity between m-sized grains, we have to take account of Brownian motion. The mean relative velocity due to Brownian motion is given by (Suttner & Yorke 2001)
| (21) |
Then the total relative velocity between grains is defined by
| (22) |
2.4 Numerical method
We calculated evolution of the grain distribution due to growth and settling, by solving equation (3) with the grain velocities in the subsection 2.3. Because we neglected the radial drift of grains, equation (3) can be integrated at each radial position, independently. In our simulation, the disk extending from 0.1 AU to 150 AU is logarithmically divided into 21 ring regions. The median radius of the -th ring region is given by AU and its width is defined by .
Equation (3) is integrated with respect to time with the first order accuracy. The change in the number density is given by the sum of two changes. One is the change due to coagulation, which comes from two terms on the right-hand side of equation (3), and the other is the change due to settling, which comes from the second term on the left-hand side. These two changes are calculated separately at each time step. The former change is calculated with the fixed bin scheme (Nakagawa et al. 1981; Ohtsuki et al. 1990). This scheme is valid for calculations of dust growth because runaway growth does not occur (Tanaka & Nakazawa 1994). The latter change is due to the advection term. To calculate it accurately and stably, we used the spatially third-order MUSCL-type (Monotonic Upwind Scheme for Conservation Law-type) scheme developed by van Leer (1977).
As an initial condition for numerical calculations, all grains have the radius of m initially. We assume the dust-to-gas ratio is uniform initially. The density and the temperature of the gaseous disk are not varied with time during numerical simulations for simplicity.
In the numerical integration of equation (3), the -axis from to is divided into 251 equally spaced grids at each radial position. As for the coordinate of the grain mass, we divide it into 500 discrete fixed mass bins. The minimum mass bin is that of grains with the radius of m and its representative mass, , is . The representative masses, , of the smallest six bins are set to be (. The larger mass bins are spaced logarithmically with a multiplication factor 1.15 (i.e., ).
Time steps are determined as follows. As the Courant condition, we made smaller than or equal to , where is the space between vertical grids and is the settling velocity of grains in the -th mass bin of the -th vertical grid. We further restricted to solve the grain growth correctly. Let denote the change in the number density due to coagulation at the mass bin of in the -th vertical grid at a time step. The change is proportional to in our scheme. We regulated the time interval so that the ratio is kept smaller than 0.025 at all mass bins if is negative. Because of this condition, however, tends to be very small by mass bins that contain negligibly small amount of grains. To avoid it, if the mass contained in a mass bin is smaller than times the total mass of the simulation, we removed all grains from the mass bin at each time step to prevent it from regulating . Such removal of grains hardly breaks the mass conservation. In our simulation with double precision, the relative error of the mass conservation is the order of . Furthermore, we checked the coagulation part of our algorithm, by comparing numerical results with analytic solutions to the coagulation equation for the kernel , as done by Ohtsuki et al. (1990). Initially, all particles have an unit mass and they have an unit number density in this test. Figure 1 shows the result of the comparison between numerical results and analytic solutions . Numerical results agrees with analytic solutions much better than those of Ohtsuki et al. (1990) because we adopted a small mass multiplication factor of 1.15.
3 RESULTS ON GRAIN GROWTH AND SETTLING
3.1 Case at 8AU in the Standard Disk
Before showing the numerical results, we mention the growth time and the settling time, which have already been examined in the previous studies (e.g., Safronov 1969; Weidenschilling 1980; Nakagawa et al. 1981, 1986). According to Nakagawa et al. (1981), the growth time of grains, , is given by
| (23) |
At the last equation, the grain number density is estimated to be ; the collisional cross section is given by under the assumption of similar-size collisions111Our numerical results show that the dominant growth mode is coalescence between grains with similar sizes.; and the settling velocity (eq. [19]) at is substituted to the relative velocity . The growth time is independent of the grain size, the disk surface density, and the temperature. The settling time, , is given by
| (24) |
where we used equation (19) at the last equation, assuming . The settling time is also independent of the disk temperature and decreases with an increase in grain radius. The initial grain size is so small (i.e., sub-micron size) that the growth time is much shorter than the settling time in an early stage. Hence such grains grow considerably before settling down by a vertical distance comparable to . (Of course, since the grain growth is driven primarily by the settling velocity, the settling is also essential to the growth of such small grains.) As grains grow, the settling time eventually becomes comparable to the growth time. Then the grains do not grow much more before settling down to the dust layer (Nakagawa et al. 1986). We can estimate such a critical grain radius, , by equating the settling time with the growth time. From equations (23) and (24), we have , where is the dust surface density. The radius corresponds to Safronov (1969)’s maximum radius to which grains can grow before settling to the dust layer. Actually, deviates only by a factor from the maximum radius obtained by Safronov (1969) with more exact treatment.
Now we show our numerical results on grain growth and settling. Instead of the mass distribution , we consider the distribution of the grain radius, , which is defined by . Furthermore, by integrating with respect to the height , we define the surface number density of grains with each size, . That is,
| (25) |
The surface number density represents the vertically averaged size distribution. The dimension of is length-3 because has the unit of numberlength2.
Figure 2 shows evolution of the surface number density at 8AU in the standard disk (§2.1), with . Panel (a) of the figure shows the size distributions in the early stage. Grains grow from 0.1m-size to micron size in the first thousand years. At 3000 yr, the high-mass end of the distribution reaches several hundreds m. From equation (23), the growth time is estimated to be 400yr at 8AU. This value is consistent with the growth of the high-mass end from 1000yr to 3000yr in Figure 2a. We found that the coalescence between grains with comparable masses is dominant during this time interval in the simulation. Thus the assumption of equal-sized collisions in equation (23) would be valid. At 8000yr, the size distribution has a bump at the high mass-end. Grains in the bump exist in the dust layer, which formed near the mid-plane at that time. The formation time of the dust layer is roughly given by , regardless of the disk model and the radial position in disks. This result is consistent with results of the previous studies (e.g., Safronov 1969; Weidenschilling 1980; Nakagawa et al. 1986).
Evolution after the formation of the dust layer is shown in Figure 2b. In this stage, the size distribution consists of two parts: large grains in the dust layer and small grains floating above the layer. The floating grains gradually settle down onto the dust layer without considerable growth. Relatively large floating grains settle onto the layer earlier and the upper cut-off of the size distribution of floating grains shifts to the smaller size. At yr, only micron-sized grains remain floating. In this way, the time-evolution can be divided into two stages: the growth stage (Fig. 2a)222 It should be noted that the grain settling is essential even in the growth stage because the grain growth is driven primarily by the settling velocity. At the end of the growth stage, the dust layer is formed through the grain settling. and the settling stage (Fig. 2b). The dust layer is formed at the transition between the two stages
In the settling stage, the size distribution of floating grains is well-described by a power-law distribution of . Dashed lines in Figure 2 are the size distribution given by equation (32), which will be derived in the subsection 3.3. At yr, the size distribution has a bump at m. Grains in this bump exist at . These grains are removed by the coalescence with larger floating grains settling faster in the early part of the settling stage.
The size distribution of floating grains is also characterized by its upper cut-off. The grain radius at the upper cut-off, , can be analytically estimated. Since decreases due to grain settling, the radius is estimated from . Introducing a numerical factor in this relation for fitting with the numerical results, we obtain
| (26) |
In Figure 2b, of equation (26) is plotted with vertical dotted and dashed lines at each time. The upper cut-off radii in the numerical results are well-described by equation (26).
At the low-mass end, the surface number density decreases with time even in the settling stage. This is due to grain growth by Brownian motion. As grains approach the mid-plane, their settling velocities decrease while Brownian motion do not vary. Thus, since the collision rate between grains is proportional to their relative velocity, Brownian motion is effective on grain growth in the settling stage especially for small grains. Since smaller grains remain floating at a higher altitude, growth due to Brownian motion affects the opacity at the disk surface. Furthermore, growth due to Brownian motion is remarkable in an inner part of the disk rather than an outer part because of high temperature at the inner part. Brownian motion and settling deplete floating grains at the low-mass and the high-mass ends, respectively. These reduce the disk optical thickness in the settling stage.
In the dust layer, grains grow to more than 100-meter-size at yr (see Fig. 2b). However, grain growth in the layer would not be calculated accurately because of the following two problems. The first problem is insufficient vertical resolution. The vertical resolution , which is in our calculation, gives the minimum thickness of the dust layer. Because of this limit, the dust-gas ratio has an upper limit of the order of unity in our simulations. Nakagawa et al. (1986) investigated dust growth in the dust layer getting thinner infinitely due to dust settling and showed that dust growth terminates when the gas-dust ratio becomes much larger than unity. Such termination of dust growth does not occur in our simulations since the coarse resolution keep the dust-gas ratio . However, the infinitely shrinking dust layer assumed by Nakagawa et al. (1986) would be unrealistic. Many authors reported that turbulence due to the shear instability prevents the further dust settling when the gas-dust ratio exceeds unity (e.g., Weidenschilling 1980; Cuzzi et al. 1993). Hence termination of dust growth proposed by Nakagawa et al. (1986) would not occur in the realistic disk. The second and more serious problem is neglect of the radial drift of grains. If the radial drift is taken into account, particles with meter-sized would rapidly fall to the central star and be lost (e.g., Adachi et al. 1976). In spite of above problems in our calculation, the inaccuracy in the dust layer would not significantly influence our results on the disk optical thickness because the dust layer has only a minor contribution to the disk optical thickness in most cases.
In Figure 3, vertical density distributions of dust grains are shown. The vertical axis in the figure is and the horizontal axis is the density of grains, , given by . Panel (a) shows evolution in the growth stage and Panel (b) corresponds to the settling stage. At 8000 yr, the density of grains is significantly enhanced near the mid-plane and the dust layer forms there. Grains are depleted with time especially at a high altitude of .
3.2 Parameter Dependences
The dust growth and settling are expected to be dependent on the following physical parameters: the disk surface densities of gas and dust grains, the temperature, the material density of grains, the sticking probability, and the radial position in the disk (i.e., ). Here we examine the dependence of the size distributions of floating grains on these physical parameters.
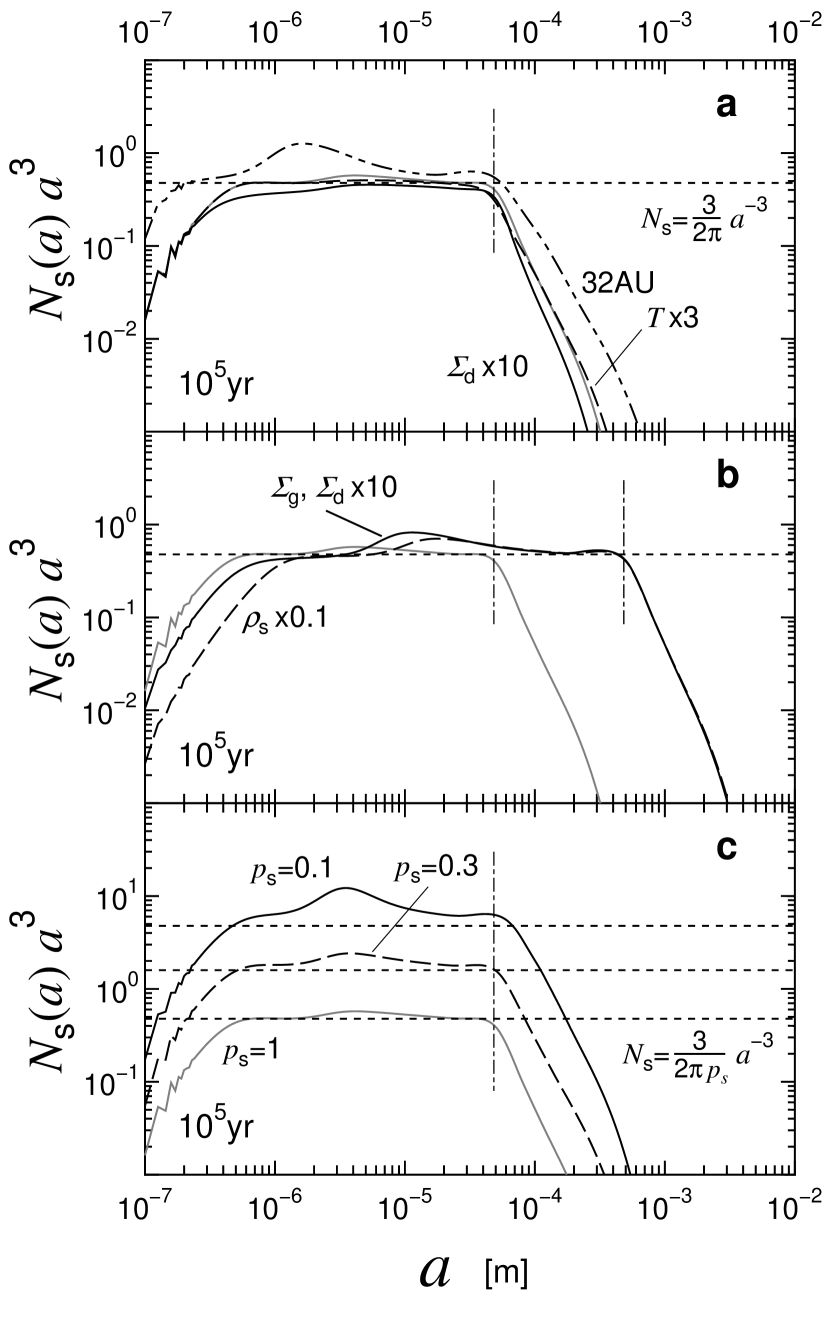
In Figure 4, we show size distributions with different values of the physical parameters. First we examine the dependence on the surface density of dust (), the disk temperature, and the radial position. To do this, another simulation similar to the above was done at 32AU in the standard disk. Furthermore, two more runs were done at 8 AU in disks with the dust surface density (or equivalently the dust-to-gas ratio ) ten times as large as that of the standard disk and with the temperature three times higher. In Figure 4a, these three cases were compared with the standard case in Figure 2 at yr. These all cases have the same size distribution for floating grains in the settling stage. The upper cut-off radii of the size distributions also have the same value. This is because and are not included in equation (26) and is independent of in the standard disk. We also mention distributions in the growth stage. In the growth stage, the case at 32AU and the case with a high dust-to-gas ratio have different size distributions from others because of their different growth time. On the other hand, the difference in the disk temperature hardly affects the grain size distribution in the growth stage, too.
In Figure 4b, we showed the dependence on the gas surface density and the material density of grains. We did runs with a low material density of gcm-3 and with the surface densities of both gas and grains ten times as large as those of the standard disk. These runs also result in the same power-law size distribution. The upper cut-off radius in these cases are larger than that of the standard case but they are also well-described with equation (26).
Finally we examine the dependence on the sticking probability. Performing two more runs with and 0.3, we compared these results with the standard case in Figure 4c. The power-law distributions form even for different sticking probabilities but the absolute values of the distribution are inversely proportional to the sticking probability.
In all simulations, the mass of the central star was set to be one solar mass. The central star’s mass is included only in in the equations governing the simulations. If the time and velocities are scaled by and ,respectively, appears only in the ratio . In the above, we found that the numerical results does not depend on (or the disk temperature). Hence, the above numerical results can be used for stars with different masses if we use the scaled time.
In the above we showed that, in the settling stage, the size distribution of floating grains is universally given by a power-law distribution with the index of , that is, . The coefficient of the distribution is inversely proportional to the sticking probability and independent of the disk properties and the material density of grains. The upper cut-off of the size distribution is well-described by equation (26).
3.3 Analytical Solution of the Grain Size Distribution
Here we analytically derive the grain size distribution in the settling stage. First we examine the settling process. Here we neglect grain growth since it hardly occurs for floating grains in the settling stage. The settling velocity is given by equation (19). We consider Epstein’s regime for gas drag in equation (5) because most floating grains are smaller than cm-size in the settling stage. The vertical distribution of the gas density is generally given by
| (27) |
This expression is valid even for the cases of vertically non-isothermal disks. In non-isothermal cases, we set to be the value at the mid-plane to make it independent of . In the isothermal case, the function is given by . The grain settling is described by the equation
| (28) |
In Epstein’s regime, the drag coefficient is inversely proportional to and the ratio is independent of even for non-isothermal disks. We introduce the normalized vertical axis and the non-dimensional time . Then equation (28) is reduced to and the solution is expressed as . That is,
| (29) |
The above solution also depends on the initial height . Figure 5 shows the solution for various in the isothermal case. If the initial height is high enough (), the solution is almost independent of except at an early stage. This is because the gas density is very low at a high altitude and grains settle down rapidly in Epstein’s regime. The small floating grains in Figure 2b come from the high altitude. On the other hand, most grains initially located at a low altitude () are removed by the coagulation with larger ones settling from a high altitude. Thus we only consider grains initially located at a high altitude and neglect the dependence of the solution on . Equation (29) represents well-defined trajectory of each grain. This indicates that there exist grains with a definite size at each height at certain time. That is, the settling causes size segregation in the disk. Actually, in our numerical simulations, the altitude of each floating grain is well-described by Equation (29) and the size segregation occurs. This size segregation makes the relative velocity between colliding grains small and prevents grain growth considerably in the settling stage.
Secondly, we derive a simple relation between the spatial and size distribution and the vertically integrated size distribution . Because of the size segregation, the spatial and size distribution is proportional to the delta function , where the function is given by solving equation (29) with respect to . In a vertical section of (, ), there exist grains with sizes (, ), where is given by (see eq. [29]). Noting that grains with a same size exist at two altitudes (i.e., above and below the mid-plane), we obtain . This equation determines as
| (30) |
Using equation (30), we can derive the expression of the power-law size distribution of in the settling stage. In the growth stage, the growth time is shorter than . Dust settling, however, decreases the grain number density at each altitude and increases the growth time. At the transition to the settling stage, the two time scales equal to each other and, in the settling stage, the growth time further increases because of the size segregation. Hence the size distribution is fixed at the transition (see also Fig. 2) and the fixed size distribution is obtained from the equation of . We reevaluate , by setting the grain number density in equation (23) and using equation (30) for . The time can be replaced by since equation (30) is derived from the solution of settling. Then we obtain
| (31) |
and the equation, , yields
| (32) |
The obtained size distribution is dependent only on the sticking probability. In Figures 2 and 4, equation (32) is plotted by dashed lines. In all cases, equation (32) agrees well with the numerically obtained size distributions of floating grains in the settling stage.
In the above derivation, we only consider grains initially located at a high altitude () to make the solution almost independent of . Thus grains initially located at are not included in the size distribution of equation (32). In Figure 2b, such grains are located in the bump at several m at 104yr. Since most of them are removed by the coagulation with larger grains in an early part of the settling stage, equation (32) is thus valid in most of the settling stage.333For Stokes’ regime, we can obtain a similar size distribution with almost same derivation. In Stokes’ regime, however, the solution of equation (29) is dependent of even for large . Thus the above derivation would be invalid in Stokes’ regime. Furthermore, since we did not assume vertically isothermal disks, equation (32) would be valid for vertically non-isothermal disks like the two-layer model, too.
We also mention the temperature dependence of the spatial and size distribution . As seen from equations (30) and (28), depends on the temperature. However, if the spatial and size distribution is considered as a function of and the normalized vertical axis (i.e., ), the product is independent of the temperature. This invariance of is also seen in numerical simulations. In Figure 3, we also plotted the result of the high temperature case to compare with the standard case. In both of the growth stage and the settling stage, the disk temperature hardly affect the values of the product . This result comes from the invariance of . In our simulation of dust growth and settling, we used a tentative disk temperature. Owing to the invariance of , however, our numerical results can be used for disks with different temperature distributions.
4 EVOLUTION OF DISK SPECTRAL ENERGY DISTRIBUTIONS
4.1 Disk Optical Thickness
In order to evaluate the disk optical thickness, we adopted the following grain model. Grain compositions and abundance were set to be the same as Pollack et al. (1994). That is, the compositions are H2O-ice, organics, olivine, pyroxene, metallic iron, and troilite. We assumed that grains consist of a mixture of these compositions instead of the core-mantle type grains adopted in Chiang et al. (2001). The model of well-mixed grains would be suitable for grown grains (Miyake & Nakagawa 1993). As the optical constants of olivine and pyroxene, we used data by Dorschner et al. (1995). For H2O-ice, we used the same data as Miyake & Nakagawa (1993). For troilite, data by Begemann et al. (1994) was used at wavelengths from 10m to 500m. Other optical constants are set to be the same as those in Pollack et al. (1994).
For such grains, we calculated the grain emissivity (or the absorption efficiency) for each grain radius , using the Mie theory (Bohren & Huffman 1983). At high temperature of K, we used the grain emissivity of grains without ice or organics while we used that including ice or organics at K. By the use of the emissivity and the spatial and size distribution , the opacity is expressed by
| (33) |
Since (see eq. [1] or [27]), we can see that the opacity is expressed with the product , which is independent of the disk temperature. The disk optical thickness is given by .
At each heliocentric distance in the standard disk, we performed simulations of dust growth and settling and calculated the disk optical thickness. Figure 6 shows the radial distributions of the optical thickness in the standard disk for wavelengths m and 1mm. From to yr, the radial distribution of the optical thickness is almost flat for both wavelengths. This is because the vertically integrated size distribution of floating grains and its upper cut-off are independent of the radial position . Large grains in the dust layer have only a minor contribution to the optical thickness though they are effective in the inner part (10AU) for mm at yr. For m, the optical thickness is much smaller in the inner disk than the outer disk. This is because grain growth due to Brownian motion depletes the micron-sized grains in the inner disk (see Fig. 2b). This extremely optically thin region may corresponds to inner holes recently observed by the Spitzer Space Telescope (Forrest at al. 2004; Meyer et al. 2004; Uchida et al. 2004). In most previous analysis of observations, the optical thickness is assumed to be proportional to the disk surface density. Under this assumption, the radial power-law index of the surface density is estimated to be from 0 to -1 by recent observations with high-resolution at millimeter wavelengths (Kitamura et al. 2002). However, this assumption is invalid because of grain growth. Our model shows that the flat radial distribution of the disk optical thickness forms even in disks in which the surface density is proportional to like the MMSN.
We also performed simulations for another disk, in which the surface density is proportional to . The gas surface density at 1AU, , is set to be the same as the standard disk. In Figure 7, we display the radial distributions of the optical thickness of this disk for mm. The optical thickness is almost proportional to at yr in this disk. This is because the upper cut-off radius of the size distribution is also proportional to at a given time in this disk (see eq. [26]). From these results, it is found that the difference in the power-law index between at millimeter wavelength and is about 1.5 at yr.
4.2 Disk Structure and Spectral Energy Distributions
Using our results on grains and the two-layer model proposed by Chiang & Goldreich (1997), we calculate disk temperatures and spectral energy distributions of disks. In the two layer model, the disk consists of two surface layers (i.e., the upper and the lower) and the disk interior. Then the disk structure is characterized by the heights of the surface layers, , and temperatures of the surface layers and the disk interior, , . We neglected the effect of the inner rim where silicate grains evaporate because it has a only minor contribution to the SED for T Tauri disks (Dullemond et al. 2001). We also neglected heating due to the disk accretion as Chiang & Goldreich (1997) did. Equations governing the two-layer model have already been described in detail by Chiang et al. (2001) and, thus, we briefly describe them in Appendix A.
We numerically solved the equations and obtained the structure of the standard disk. The effective temperature, , and the radius, of the central star are set to be 4000K and 0.0097AU, respectively. Figure 8 shows time-evolution of the height of the upper surface layer . The surface layer descends because of grain settling and growth. The descent of the surface layer is remarkable in an inner part of the disk. This is because of the significant reduction of the optical thickness in the inner disk mentioned above. Actually, the disk is optically thin to the starlight in the region of AU (AU) at yr (yr) and the disk interior disappears there. The grazing angle between the starlight and the disk surface given by equation (A4) decreases because of the descent of the disk surface. However, the grazing angle remains positive and the self-shadowing does not occur.
The temperatures in the surface layer and the disk interior are shown in Figure 9. Because the temperature of the surface layer depends on the size of growing grains (see eq. [A5]), it varies with time. The temperature of the disk interior is much lower than that of the surface layer, as shown by Chiang & Goldreich (1997). The ratio of is about 4 in this case. The temperature of the disk interior does not vary much with time in spite of the substantial descent of the surface layer. In other disk models examined below, we also found similar disk structure to the standard disk.
Using the obtained disk structure, we calculate the disk SED with Eqs. (A7) and (A8). We assume that the disk is face-on (the inclination angle is zero). Figure 10 shows evolution of the SEDs from the standard disk and the central star from yr to yr. The SED does not change much until yr. After that, the energy flux from the disk decreases especially at m. The decreases in the disk optical thickness mainly reduces the flux from the disk interior, which has a major contribution to the SED at . The feature at 40m, which comes from icy grains in the surface layer, does not decline much. One the other hand, the silicate feature at 10m depletes at yr. This is due to the “inner hole” () of the disk optical thickness mentioned above. This result may explain the depletion of silicate feature in CoKu Tau/4 reported by Forrest et al. (2004). The disk life time estimated from the observed energy fluxes at millimeter/sub-millimeter wavelengths is about yr (e.g., Wyatt at al. 2003). In our result on the standard disk, on the other hand, the depletion time at the wavelengths is severalyr. We examine the possibilities to reconcile the discrepancy below.
We performed three more similar simulations of grain growth and settling. The first one is for a disk ten times as massive as the standard one, the second one is for the standard disk but with the sticking probability , and the third one is for a disk with the disk outer radius AU. In Figure 11, we compare the SEDs in those cases with the standard disk at yr. In the case of the massive disk, fluxes at sub-millimeter/millimeter wavelengths are larger than those in the standard disk. This is because of slow settling in the massive disk (see eq. [24]). The cases with a small sticking probability and with a large outer radius also result in larger fluxes at the long wavelengths. This is due to the slow grain growth at the outer disk radius (see eq. [23]).
In Figure 12, the fluxes in these cases are displayed as a function of time. The energy flux from the massive disk is larger than that from the standard disk initially and starts to decrease at a few yr similar to the standard disk. In the cases with a small and with a large , on the other hand, the flux starts to decrease more lately. This is because of slow grain growth at the outer disk radii. The depletion time in these cases is almost consistent with that inferred from the SED observations. Our results indicate that the decrease in the observed energy fluxes at millimeter/sub-millimeter wavelengths can be explained by grain growth and settling without any disk depletion. Hence the gaseous disks themselves can survive more than yr. In order to determine the disk life time, which is crucial for formation of gas giant planets, it is necessary to observe the decay of gas components.
5 SUMMARY AND DISCUSSION
We performed numerical simulations of dust growth and settling in passive disks and obtained the spatial and size distributions of grains. As the first step of series of papers, we consider laminar disks in the present paper. Using the obtained grain distributions and the two-layer model, we also examined evolution of disk structure and SEDs due to dust growth and settling. Our results are summarized as follows:
-
1.
Evolution of grains in laminar disks is divided into the growth stage and the subsequent settling stage. At the end of the growth stage, large grains settle to the mid-plane and form a dust layer, while small grains remain floating above the layer. The size distribution, , of the floating grains is well-described by the power-law distribution analytically obtained as (eq. [32]) with the upper cut-off (eq. [26]). This size distribution is kept in the settling stage. In the settling stage, relatively large floating grains settle earlier and the upper cut-off radius of the size distribution decreases as equation (26). The validity of equations (32) and (26) was confirmed with numerical simulations for wide parameter ranges. The approximate solution of the spatial and size distribution, , were obtained analytically, too (eq. [30]).
-
2.
The optical thickness of disks considerably decreases because of dust growth. The optical thickness is governed by floating small grains rather than large grains in the dust layer. Rapid grain growth in the inner part of disks makes the radial distribution of the disk optical thickness less steep than that of the disk surface density . For disks with , the radial distribution of the optical thickness is almost flat for all wavelengths at yr. The difference in the power-law index between the optical thickness at mm and the surface density is generally about . This difference between the optical thickness and the surface density should be taken into account in analyses of observations with high-resolution, which will be done by Spitzer Space Telescope or Atacama Large Millimeter Array (ALMA). At yr, the optical thickness for infrared radiation is extremely small in the inner region ( 3AU). This region may corresponds to inner holes observed by the Spitzer Space Telescope (Forrest at al. 2004; Meyer et al. 2004; Uchida et al. 2004).
-
3.
The surface layer directly irradiated from the central star descends because of grain settling and growth. The descent of the surface layer is remarkable in an inner part of the disk because grain growth due to Brownian motion depletes the micron-sized grains there. The temperature of the disk interior, , is much lower than that of the surface layer, , as shown by Chiang & Goldreich (1997). The ratio of is about 4 in our simulations.
-
4.
The energy flux from the disk decreases due to grain growth and settling especially at m. In the standard disk with the sticking probability and the outer radius 150AU, the depletion time of the energy fluxes at sub-millimeter/ millimeter wavelengths is obtained as severalyr. In the case with a small or with a larger , the depletion time is longer. Our results indicate that the decrease in the observed energy fluxes at millimeter/sub-millimeter wavelengths can be explained by grain growth and settling without disk depletion. The gaseous disks themselves can survive more than yr. The silicate feature at 10m depletes on the time scale of yr because of the formation of the extremely optical thin inner region.
In the present paper, we consider only laminar disks. Here, we comment on the effect of turbulence on dust growth and disk structure. Vertical stirring by turbulence would prevent dust settling. As shown by Dullemond & Dominik (2004b), vertical stirring by turbulence against dust settling is effective even in weakly turbulent disks with the parameter for the disk viscosity. In turbulent disks, vertical stirring is expected to keep the surface layer high compared with laminar disks. On the other hand, turbulence also increases the relative velocity between grains. Since the collisional probability is proportional to the relative velocity, turbulence accelerates grain growth, too (e.g., Weidenschilling 1984; Mizuno et al. 1988). Acceleration of grain growth would result in a rapid decrease in the opacity and the disk optical thickness. This would make the surface layer lower. It is not clear whether the turbulence makes the surface layer higher with stirring or lower with acceleration of grain growth. Furthermore, in sufficiently strong turbulence, collisional disruption due to high relative velocity creates small grains and would increases the optical thickness. To clarify which effect is dominant, it is necessary to perform our simulations of grain growth and settling, by taking into account above effects of turbulence. In the next paper, we investigate cases of turbulent disks and examine more realistic evolution of the optical thickness and SEDs in protoplanetary disks.
We thank Y. Kitamura, M. Honda, and M. Momose for valuable comments. We also thank the anonymous reviewer for many valuable comments and suggestions. This work is supported by Grant-in-Aid of the Japanese Ministry of Education, Science, and Culture (15740116 and 16340054)
Appendix A BASIC EQUATIONS IN THE TWO-LAYER MODEL
Here we briefly explain the equations governing the structure of a passive disk in the two-layer model. The optical thicknesses of the surface layer and the disk interior, , are given by
| (A1) |
respectively, where the height is the boundary between the surface layer and the disk interior in the normalized vertical axis. The opacity is given by equation (33) by the use of our numerical results. By the introduction of the normalized axis, the optical thicknesses of them are independent of the disk temperature. The Planck mean optical thicknesses of them are
| (A2) |
The boundary is indirectly determined by the equation
| (A3) |
where is the effective temperature of the central star and is the grazing angle (i.e. the angle between the starlight and the disk surface). By the use of , the grazing angle is given by
| (A4) |
where is the radius of the central star. When the disk optical thickness is small enough, equation (A3) does not have a positive solution of . This corresponds to the case with no disk interior. In this case we set and, thus, the optical thicknesses of the disk interior, and , are zero.
The grains in the surface layer have various temperatures depending on their radii. Instead of the various grain temperatures, we use the mean temperature of the surface layer defined by
| (A5) |
The temperature of the disk interior is given by
| (A6) |
In equations (A5) and (A6), we doubled the left-hand sides, assuming that the entire star is visible from the surface layer (Dullemond et al. 2001). Furthermore, we inserted the factor 2 into the exponential functions in equation (A6) in order to take into account radiative transfer in the oblique direction in the disk interior. This is because, in the direction with the angle to the vertical axis, the optical thickness of the disk interior is double of that in the vertical direction.
Equations (A3)-(A6) are coupled with one another. We numerically solved these equations for a whole disk. The derivative in equation (A4) is evaluated with the central difference using the both sides of grids though the one-side difference is used at the innermost and the outermost grids.
By the use of the solutions to the above equations, the emissions (or the energy fluxes) at a frequency from the surface layers and the disk interior, , , are given by
| (A7) |
and
| (A8) |
respectively, where is the distance from the observer to the source and is the inclination angle of the disk ( means face-on). In the above we assumed that . The energy flux from the whole disk is given by their sum.
References
- Adachi et al. (1976) Adachi, I., Hayashi, C., and Nakazawa, K. 1976, Prog. Theor. Phys., 56, 1756
- Beckwith et al. (1990) Beckwith, S. V. W., Sargent, A. I., Chini, R. S., & Guesten, R. 1990, AJ, 99, 924
- Begemann et al. (1994) Begemann, B., Dorschner, T., Henning, T., Mutschke, H., & Thamm, E. 1994, ApJ, 423, L71
- Bohren & Huffman (1983) Bohren, C. F., & Huffman, D. R. 1983, Absorption and scattering of light by small particles (New York: Wiley)
- Bouwman et al. (2003) Bouwman, J., de Koter, A., Dominik, C., and Waters, L. B. F. M. 2003, A&A, 401, 577
- Calvet et al. (2002) Calvet, N., D’Alessio, P., Hartmann, L., Wilner, D., Walsh, A., and Sitko, M. 2002, ApJ, 568, 1008
- Chapman & Cowling (1970) Chapman, S., & Cowling, T. G. 1970, The Mathematical Theory of Non-uniform gases (London: Cambridge Univ. Press)
- Chiang & Goldreich (1997) Chiang, E. I., & Goldreich, P. 1997, ApJ, 490, 368.
- Chiang et al. (2001) Chiang, E. I., Joung, M. K., Creech-Eakman, M. J., Qi, C., Kessler, J. E., Blake, G. A., & Van Dishoeck, E. F. 2001, ApJ, 547, 1077
- Cuzzi et al. (1993) Cuzzi, J. N., Dobrovolskis, A. R., and Champney, J. M. 1993, Icarus, 106, 102
- D’Alessio et al. (2001) D’Alessio, P., Calvet, N., & Hartmann, L. 2001, ApJ, 553, 321
- Dorschner et al. (1995) Dorschner, T., Begemann, B., Henning, T., Jäger, C., & Mutschke, H. 1995, A&A, 300, 503
- Dullemond et al. (2001) Dullemond, C. P., Dominik, C., & Natta, A. 2001, ApJ, 560, 957
- (14) Dullemond, C. P., & Dominik, C. 2004a, A&A, 417, 159
- (15) Dullemond, C. P., & Dominik, C. 2004b, A&A, 421, 1075
- Eisner et al. (2003) Eisner, J. A., Lane, B. F., Akeson, R. L., Hillenbrand, L. A., & Sargent, A. I. 2003, ApJ, 588, 360
- Forrest et al. (2004) Forrest, W. J., et al. 2004, ApJS, 154, 443
- Fukagawa et al. (2004) Fukagawa, M., et al. 2004, ApJ, 605, L53
- Goldreich & Ward (1973) Goldreich, P., & Ward, W. R. 1973, ApJ, 183, 1051
- Grady et al. (1999) Grady, C.A., Woodgate, B., Bruhweiler, F.C., Boggess, A., Plait, P., Lindler, D.J., Clampin, M., & Kalas, P. 1999, ApJ 523, L151
- Hayashi (1981) Hayashi, C. 1981, Prog. Theor. Phys. Suppl., 70, 35
- Honda et al. (2003) Honda, M., Kataza, H., Okamoto, Y. K., Miyata, T., Yamashita, T., Sako, S., Takubo, S., & Onaka, T. 2003, ApJ, 585, L59
- Kitamura et al. (2002) Kitamura, Y., Momose, M., Yokogawa, S., Kawabe, R., Tamura, M., & Ida, S. 2002, ApJ, 581, 357
- Meeus et al. (2004) Meeus, G., Sterzik, M., Bouwman, J., and Natta, A. 2003, A&A, 409, 25
- Meyer et al. (2004) Meyer, M. R., et al. 2004, ApJS, 154, 422
- Miyake & Nakagawa (1992) Miyake, K., & Nakagawa, Y. 1993, Icarus, 106, 20
- Miyake & Nakagawa (1995) Miyake, K., & Nakagawa, Y. 1995, ApJ, 441, 361
- Mizuno et al. (1988) Mizuno, H., Markiewicz, W. J., & Voelk, H. J. 1988, A&A, 195, 183
- Mundy et al. (1996) Mundy, L. G., et al. 1996, ApJ, 464, L169
- Nakagawa et al. (1981) Nakagawa, Y., Nakazawa, K., & Hayashi, C. 1981, Icarus, 45, 517
- Nakagawa et al. (1986) Nakagawa, Y., Sekiya, M. & Hayashi, C. 1986, Icarus, 67, 375
- Natta et al. (2004) Natta, A., Testi, L., Neri, R., Shepherd, D. S., & Wilner, D. J. 2004, A&A, 416, 179
- Ohtsuki et al. (1990) Ohtsuki, K., Nakagawa, Y., & Nakazawa, K. 1990, Icarus, 83, 205
- Pollack et al. (1994) Pollack, J. B., Hollenbach, D., Beckwith, S., Simonelli, D. P., Roush, T., & Fong, W. 1994, ApJ, 421, 615
- Przygodda et al. (2003) Przygodda, F., van Boekel, R., Àbrahàm, P., Melnikov, S. Y., Waters, L. B. F. M., & Leinert, Ch. 2003, A&A, 412, L43
- Safronov (1969) Safronov, V. S. 1969, Evolution of the Protoplanetary Cloud and Formation of the Earth and the Planets (NASA Tech. Trans. F-677) (Nauka: Moscow)
- Schmitt et al. (1997) Schmitt, W., Henning, T., & Mucha, R. 1997, A&A, 325, 569
- Shakura & Sunyaev (1973) Shakura, N. I., & Sunyaev, R. A. 1973, A&A, 24, 337
- Strom et al. (1989) Strom, K. M., Strom, S. E., Edwards, S., Cabrit, S., & Skrutskie, M. F. 1989, AJ, 97, 1451
- Suttner et al. (2001) Suttner, G., & Yorke, H. W. 2001, ApJ, 551, 461
- Takeuchi & Lin (2002) Takeuchi, T., & Lin, D. N. C. 2002, ApJ, 581, 1344
- Takeuchi & Lin (2003) Takeuchi, T., & Lin, D. N. C. 2003, ApJ, 593, 524
- (43) Tanaka, H., & Nakazawa, K. 1994, Icarus, 107, 404
- Uchida et al (2004) Uchida, K. I., et al. 2004, ApJS154, 439
- (45) van Leer, B. 1977, J. Comput. Phys., 23, 276
- Weidenschilling (1980) Weidenschilling, S. J. 1980, Icarus, 44, 172
- Weidenschilling (1984) Weidenschilling, S. J. 1984, Icarus, 60, 553
- (48) Weidenschilling, S. J. 1997, Icarus, 127, 290
- Weidenschilling & Cuzzi (1993) Weidenschilling, S. J., & Cuzzi, J. N. 1993, Protostar and Planets III, ed. E. H. Levy & J. L. Lunine (Tucson: Univ. Arizona Press), 1031
- Wyatt et al (2003) Wyatt, M. C., Dent, W. R. F., & Greaves, J. S. 2003, MNRAS, 342, 876.
- Youdin & Shu (2002) Youdin, A. N., & Shu, F. H. 2002, ApJ, 580, 494