The Formation of Galactic Bulges
Abstract:
We summarise some recent results about nearby galactic bulges that are relevant to their formation. We highlight a number of significant advances in our understanding of the surface brightness profiles, stellar populations, and especially the very centers of spiral galaxies. We also view our own Milky Way as if it were an external galaxy. Our main conclusions are that bulges of early-type spirals (S0 – Sb) contain central nuclear components, just like late-type spirals and most other types of galaxies. The luminosities of these central components correlate best with total bulge luminosity, and not as well with morphological type. Bulges of early-type spiral galaxies follow the fundamental plane and the colour/line strength vs. luminosity relations of elliptical galaxies. Although we have a reasonable idea about bulges of early-type spirals we know much less about late-type bulges. However, the close resemblance of our Milky Way Bulge to bulges in external disk galaxies makes us suspect that bulges of late-type spirals might be very similar as well.
PoS(BDMH2004)060
1 Introduction
Galactic bulges — objects in the middle of spirals that are similar in many ways to elliptical galaxies, are the key to study galaxy formation. Although bulges of nearby disk galaxies have been studied in great detail in recent years (see Kormendy & Kennicutt 2004 for an in-depth review article), many aspects are still unknown. In this short review we will try to show that, contrary to 15 years ago, we are able to make a fairly coherent picture of the nature of galactic bulges, which we can use to test formation models. Rather than trying to comment on all the issues in a much too short space we will concentrate on a few pieces in this puzzle. Before doing this, however, we will first discuss the definition of the bulge. After having talked about surface brightness profiles, stellar populations, and the centers of galaxies, we will end with a short section about our knowledge of bulges at higher redshift.
2 Definition of Bulges
One could ask the question whether it makes sense to talk about galactic bulges as separate components of spiral galaxies. If galaxy properties change smoothly from the center outwards, as is the case for elliptical galaxies, it is not clear whether discussing the inner parts separately makes sense. In the case of bulges, however, one can make the case that they are clearly different from their surrounding disk. They contain less interstellar matter, are generally rounder, have a surface brightness profile that is more strongly peaked than the inward extrapolation of the outer exponential profile, and have different internal kinematics than the underlying disk. In the past, Hubble (1936) noted that the normal spiral exhibits a bright, semi-stellar nucleus and a relatively large nuclear region of unresolved nebulosity which closely resembles a lenticular (E7) nebula.
There are a few methods in the literature that are used to calculate the extent of the bulge. The first is one-dimensional. Here an exponential disk model and an r1/4 bulge model are fitted to a major axis surface brightness profile (e.g. Freeman 1970, Kormendy 1977). A generalization of this method takes a Sérsic r1/n profile for the bulge (e.g. Andredakis et al. 1995, de Jong 1996). This method can be used for galaxies at all inclinations, but fails when the slope of the surface brightness profiles in bulge and disk region is the same. A different method, using the surface brightness distribution together with the morphology of the bulge, was introduced by Kent (1985). Here a galaxy is decomposed into a bulge and a disk of fixed, but different ellipticity, using a non-parametric method. This method uses the fact that in projection bulges are often rounder than their disks, so that the ellipticity in the central regions is lower. This method, only applicable for galaxies that are not face-on, generally gives similar results to the previous one, except in the case of galaxies with boxy bulges (e.g. Jarvis 1986), i.e., edge-on galaxies with rounder, generally very boxy, isophotes. One can think about a third method, using only the stellar kinematics, which decomposes a galaxy into a fast rotating, cold disk and a slowly rotating, hot bulge. This method, which to our knowledge has not been applied to real data yet, might be the most physical, since it separates a galaxy into a slowly rotating elliptical-like spheroid and a fast-rotating disk. Since kinematic analysis has shown that boxy bulges generally are bars seen edge-on (e.g. Bureau & Freeman 1999), and bars are a phenomenon that occurs in flat disks, the first method is more in agreement with the third, and for that reason we will use that for the rest of this proceedings.
Apart from decomposing the surface brightness profile in the radial direction it is also of interest to know how the profile in the vertical direction has to be decomposed. We will come to this issue in the next Section.
3 Surface Brightness Profiles and Components in Bulges
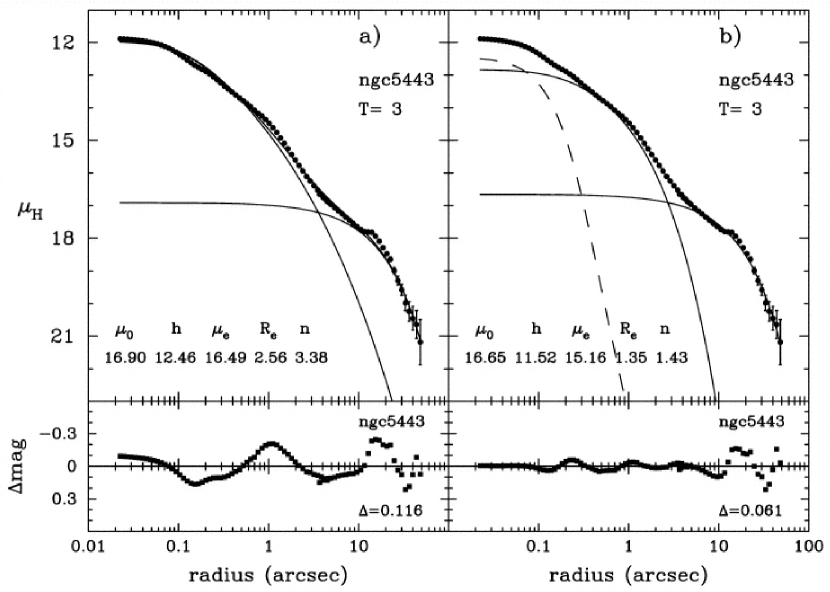
Inspired by work on elliptical galaxies (Caon et al. 1993) Andredakis et al. (1995) found that surface brightness profiles of bulges are better fit by a Sérsic r1/n law than by the traditional r1/4 distribution. With the aid of higher resolution Hubble Space Telescope photometry, Balcells et al. (2003) performed the decomposition again on a subsample of the original dataset of Andredakis et al. The results here are quite interesting: in 84% of the sample a better fit is obtained if a central point source is included. In a moderate fraction of the sample, another increase in the goodness of the fit is obtained if an extended component, such as a nuclear disk, is included as well. In Fig.1 we show figure 1 of Balcells et al. (2003), which shows the residuals with and without a central point source for an example galaxy.
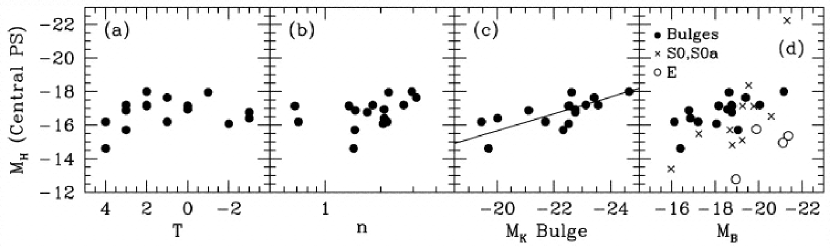
Given that it is now commonly accepted that most large galaxies have central black holes in their centers (e.g. Magorrian et al. 1998, Ferrarese & Merritt 2000) it is not surprising that bulges contain central point sources, also since many galaxies contain stronger or weaker AGNs. In fact, HST studies of elliptical and S0 galaxies have found many central point sources (Ravindranath et al. 2001, Rest et al. 2001), in late-type spirals Carollo et al. (2002) detected nuclear sources in 43 of their 69 objects, and in dE’s Graham & Guzman (2003) detected many point sources. Interestingly enough, Balcells et al. show that the nuclear point source luminosity correlates with several quantities, most of all the luminosity of the bulge (Fig.2) . The nuclear point sources, containing up to a fraction of order 10-3 of the bulge luminosity, are easy to accommodate within either a merger origin or a secular evolution origin for bulges. The observed scaling of PS and bulge luminosities does not necessarily indicate an internal origin for the PS since the nuclear gas deposition during a merger may scale with the masses of the merging objects. If bulges are evolved bars, the problem of growing a nuclear star cluster is similar to that of feeding an active galactic nucleus (Maciejewski et al. 2002). If black hole mass correlates with bulge mass, bulge mass correlates with luminosity and nuclear cluster luminosity correlates with black hole mass, this is what one expects.
In Figs.2 and 3 we also show some other correlations with the luminosity of the central point source. The correlation with the Sérsic index is strong, while the correlation with morphological type T is much weaker. In fact, Balcells et al. (2004) show that all correlations with morphological type are less strong than with bulge luminosity. One of the main conclusions from that paper is that large galaxies are not scale-free, as Courteau et al. (1996) claim, but that they have a scale, namely the luminosity of the bulge. Fig.3 also shows that the correlation with the central velocity dispersion, and the dust-free colour are not as strong as with bulge luminosity, and that there is no correlation with inclination (disk axis ratio). We would expect a strong correlation with central potential well depth, and possibly the correlation of point source luminosity with velocity dispersion would become stronger if we would make a correction for rotation. We are currently analysing some Integral Field Spectroscopy of this sample to investigate this issue.

Not only from the surface brightness profiles it is apparent that bulges contain other components, such as nuclear disks, bars, etc., but detailed internal kinematics also shows this. For example, the minor axis kinematics of this sample, presented in Falcón-Barroso et al. (2003a), shows structures that are different from major axis disks. Moreover, SAURON-data of the S0 galaxy NGC 7332 (Falcón-Barroso et al. 2004) shows that this galaxy most likely has a central disk, a bar, and a very small kinematically decoupled stellar disk. The gas kinematics in this galaxy are completely decoupled from the stellar kinematics, strongly indicating interactions with the neighbouring galaxy NGC 7339.
4 Stellar Populations of Bulges
At the moment we know relatively little about the stellar populations of bulges, and most of this information is limited to bulges of early-type spiral galaxies. This has to do with the fact that many bulges are dusty, making the interpretation of broadband colours difficult, and that one has to separate a bulge from an often dominating disk. For late-type bulges (type Sbc and later) most of our information comes from HST studies (e.g., Böker et al. 2002, 2003; Carollo et al. 2002). We know that late-type spirals have nuclear clusters that are more prominent than the ones in early-type spirals. Colours indicate that the central regions are full of dust and young stars. Given the fact that these bulges are very small compared to their disks, it is hard to establish whether these young stars and dust are situated in the disk or in the bulge, we think that it is too early to make definitive statement about bulge populations. In our own Milky Way one is able to de-contaminate the bulge from the disk using e.g. proper motions. In this way Zoccali et al. (2003) find that the age of the Galactic Bulge is old, around 12 – 13 Gyr.
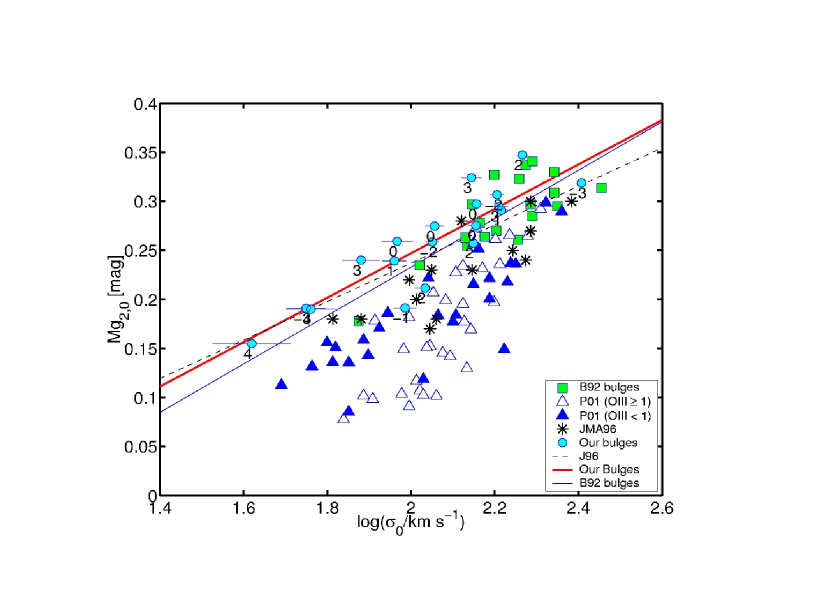
For early-type bulges a few significant results have been reported. Broadband colours indicate that bulges are old (10 Gyr with a range of about 2 Gyr), except for the very central regions (Peletier et al. 1999). The position of bulges on the fundamental plane of elliptical galaxies is consistent with this statement. Their formation epoch must have been at most 2.5 Gyr later than elliptical and S0 galaxies in clusters (Falcón-Barroso et al. 2002). The situation with absorption line strengths is less clear. Falcón-Barroso et al. (2003b) find that the CaT* – relation for bulges is the same as for elliptical galaxies, but with less scatter, and that CaT* is decreasing with increasing velocity dispersion, contrary to e.g. the Mg2 index, which is larger with increasing . It is not clear yet what the reason is for this decrease. Possibilities are a Ca under-abundance w.r.t. Fe, a bottom-heavy IMF, or uncertainties in our knowledge of element-enrichment in galaxies (see also Cenarro et al. 2003). The fact that the relation for ellipticals is the same as for early-type spirals indicates that dust extinction cannot play a major role. The Mg2 – relation also shows that bulges of early-type spirals behave in a similar way as elliptical galaxies (see Fig.4). However, although the data of Falcón-Barroso et al. agree with e.g., Jablonka, Martin & Arimoto (1996) and Bender, Burstein & Faber (1992), the agreement with the dataset of Prugniel, Maubon & Simien (2001) is not very good. The latter data indicate that, in general, bulges are much younger than ellipticals. This difference might have been caused by a different selection procedure. In the case of the data of Falcón-Barroso et al., much care was taken to make sure that the amount of disk light contaminating the data was limited. In the case of Prugniel et al., however, bulges were selected at random. As a result, it is very likely that star formation in the disk, on the same line of sight as the bulge light, could affect the points and cause the difference. However, one should also realise that the colours of the bulge and inner disk, at least for early type bulges, are generally very similar (Terndrup et al. 1994, Peletier & Balcells 1996) and indicate that the central regions are dominated by old stellar populations. Better quality data will have to settle this issue.
5 The Centers of Disk Galaxies
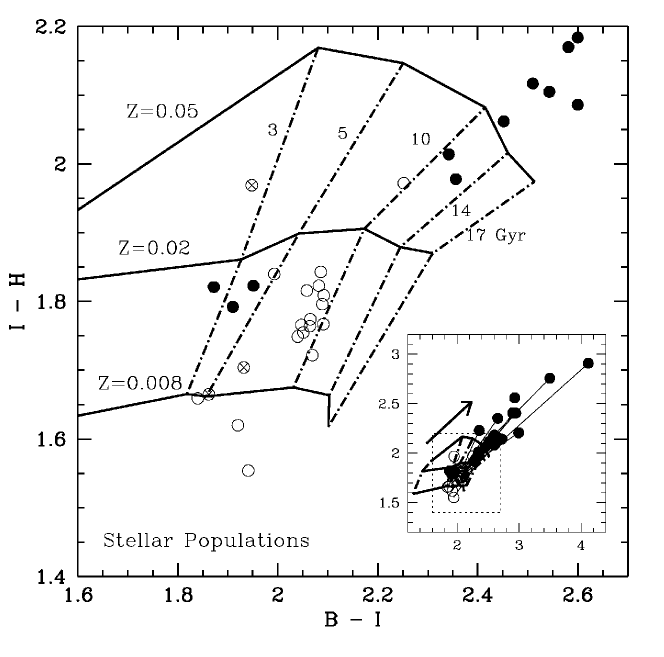
In the previous discussion we have not talked about the very central regions of spiral galaxies, apart from the central point sources. In Fig. 5 we have reproduced Fig. 3a from Peletier et al. (1999). It is clear from this figure that the filled points for most galaxies are situated far above the model grid, indicating that they contain dust: the central extinction AV lies between 0.6 and 1 mag. Very few galaxies do not have such a dusty core. As can be seen clearly in the color map of NGC 5838, this dust is often associated with central star formation. So, although most of the bulge is old, some stars are currently formed in the very central regions. In elliptical galaxies a similar phenomenon is seen, since at least 80% of them contain dust in their central regions (van Dokkum & Franx 1995). When one looks at absorption line strengths, one also often sees that the innermost point is younger than the rest of the galaxy (e.g., Davies et al. 2001; Sánchez-Blázquez et al. 2004). This is also seen in long slit spectroscopic studies of bulges (Jablonka et al. 2002). Since the material in the center is generally metal rich, the origin of the gas is probably internal, and not gas infalling from outside.
Drawing the analogy with our Galaxy (type Sbc), we see a similar structure. Launhardt et al. (2002), using DIRBE data, find an almost exponential bulge, with an enhancement in the region of the Galactic Plane (see also Kent et al. 1991). In that region, with a diameter of 250 pc, comparable to the nuclear regions in other galaxies, most of the light comes from cool stars, with a torus of interstellar matter in the same region. Outside this torus there is an absolute lack of interstellar matter. In the very inner parts (r 1 pc) the light is dominated by hot, massive stars. This shows that the Milky Way bulge is similar in almost all aspects to external bulges of galaxies. It shows that even in an Sbc bulge the large majority of stars in the bulge are old. Careful studies of other late-type spirals will have to be made to see whether the same is the case there.
6 Bulges at High Redshift
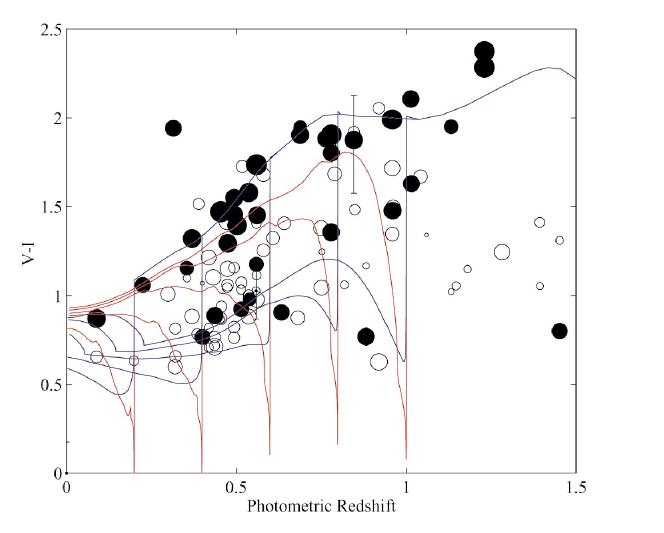
Fig.6 is a diagram from Ellis et al. (2001) showing the colour evolution as a function of redshift for galaxies in the Hubble Deep Field. Since here the open symbols are bulges and the filled symbols ellipticals, one would think that at a given redshift the bulges are bluer, and therefore younger or more metal poor. This conclusion, unfortunately, cannot be drawn from this diagram alone. Bulges are small (bulges that dominate the disk across a radial range of more than 1 kpc are rare), so even in the HDF their size is small. We will have to wait for studies that take into account the contribution from the disk, when studying the bulge. These studies might come soon, i.e. from studies like GOODS, and will lead to interesting progress in the field.
Although we haven’t discussed the formation of bulges themselves here, all the results presented here are relevant to obtain the right idea about how spirals formed. For this topic we refer to the review of Kormendy & Kennicutt (2004) and references in there.
References
- [1]
- [2] Andredakis, Y. C., Peletier, R. F., & Balcells, M. 1995, MNRAS, 275, 874
- [3] Balcells, M., Graham, A. W., Domínguez-Palmero, L., & Peletier, R. F. 2003, ApJl, 582, L79
- [4] Balcells, M., Graham, A. & Peletier, R.F., 2004, astro-ph/0404379
- [5] Bender, R., Burstein, D., & Faber, S. M. 1992, ApJ, 399, 462
- [6] Böker, T., Stanek, R., & van der Marel, R. P. 2003, AJ, 125, 1073
- [7] Böker, T., Laine, S., van der Marel, R. P., Sarzi, M., Rix, H., Ho, L. C., & Shields, J. C. 2002, AJ, 123, 1389
- [8] Bureau, M., & Freeman, K. C. 1999, AJ, 118, 126
- [9] Caon, N., Capaccioli, M., & D’Onofrio, M. 1993, MNRAS, 265, 1013
- [10] Carollo, C. M., Stiavelli, M., Seigar, M., de Zeeuw, P. T., & Dejonghe, H. 2002, AJ, 123, 159
- [11] Cenarro, A. J., Gorgas, J., Vazdekis, A., Cardiel, N., & Peletier, R. F. 2003, MNRAS, 339, L12
- [12] Courteau, S., de Jong, R. S., & Broeils, A. H. 1996, ApJl, 457, L73
- [13] Davies, R. L., et al. 2001, ApJl, 548, L33
- [14] de Jong, R. S. 1996, A&AS, 118, 557
- [15] Ellis, R. S., Abraham, R. G., & Dickinson, M. 2001, ApJ, 551, 111
- [16] Falcón-Barroso, J., Peletier, R. F., Balcells, M. 2002, MNRAS, 335, 741.
- [17] Falcón-Barroso, J., Balcells, M., Peletier, R. F., & Vazdekis, A. 2003, A&A, 405, 455
- [18] Falcón-Barroso, J., Peletier, R. F., Vazdekis, A. & Balcells, M., 2003, ApJ, 588, L17.
- [19] Falcón-Barroso, J., et al. 2004, MNRAS, 350, 35
- [20] Ferrarese, L., & Merritt, D. 2000, ApJl, 539, L9
- [21] Freeman, K. C. 1970, ApJ, 160, 811
- [22] Graham, A. W., & Guzmán, R. 2003, AJ, 125, 2936
- [23] Hubble, E. P. 1936, Yale University Press,
- [24] Jablonka, P., Martin, P., & Arimoto, N. 1996, AJ, 112, 1415
- [25] Jablonka, P., Gorgas, J., & Goudfrooij, P. 2002, ApSS, 281, 367
- [26] Jarvis, B. J. 1986, AJ, 91, 65
- [27] Kent, S. M. 1985, ApJs, 59, 115
- [28] Kent, S., Dame, T. & Fazio, G.G., 1991, ApJ, 378, 131
- [29] Kormendy, J. 1977, ApJ, 218, 333
- [30] Kormendy, J., & Kennicutt, R. C. 2004, ARAA, 42, 603
- [31] Launhardt, R., Zylka, R., & Mezger, P. G. 2002, A&A, 384, 112
- [32] Maciejewski, W. 2002, Astronomical Society of the Pacific Conference Series, 275, 251
- [33] Magorrian, J. et al., 1998, AJ, 115, 2285
- [34] Peletier, R. F., & Balcells, M. 1996, AJ, 111, 2238
- [35] Peletier, R. F., & Balcells, M. 1997, New Astronomy, 1, 349
- [36] Peletier, R. F., Balcells, M., Davies, R. L., Andredakis, Y., Vazdekis, A., Burkert, A., & Prada, F. 1999, MNRAS, 310, 703
- [37] Prugniel, P., Maubon, G., & Simien, F. 2001, A&A, 366, 68
- [38] Ravindranath, S., Ho, L. C., Peng, C. Y., Filippenko, A. V., & Sargent, W. L. W. 2001, AJ, 122, 653
- [39] Rest, A., et al., 2001, AJ, 121, 2431
- [40] Sánchez-Blázquez, P., 2004, Ph.D. Thesis, Universidad Complutense Madrid
- [41] Terndrup, D. M., Davies, R. L., Frogel, J. A., Depoy, D. L., & Wells, L. A. 1994, ApJ, 432, 518
- [42] van Dokkum, P. G., & Franx, M. 1995, AJ, 110, 2027
- [43] Vazdekis, A., Casuso, E., Peletier, R. F., & Beckman, J. E. 1996, ApJs, 106, 307
- [44] Zoccali, M., et al. 2003, A&A, 399, 931