Low Mass Star Formation in the Gum Nebula:
The CG 30/31/38 complex
Abstract
We present photometric and spectroscopic results for the low mass pre-main sequence (PMS) stars with spectral types K – M in the cometary globule (CG) 30/31/38 complex. We obtained multi-object high resolution spectra for the targets selected as possible PMS stars from multi-wavelength photometry. We identified 11 PMS stars brighter than V = 16.5 with ages 5 Myr at a distance of approximately 200 pc. The spatial distribution of the PMS stars, CG clouds, and ionizing sources (O stars and supernova remnants) suggests a possible triggered origin of the star formation in this region. We confirm the youth of the photometrically selected PMS stars using the lithium abundances. The radial velocities of the low mass PMS stars are consistent with those of the cometary globules. Most of the PMS stars show weak H emission with W 10Å. Only 1 out of the 11 PMS stars shows a moderate near-IR excess, which suggests a short survival time (t 5 Myr) of circumstellar disks in this star forming environment. In addition, we find five young late type stars and one Ae star which have no obvious relation to the CG 30/31/38 complex. We also discuss a possible scenario of star formation history in the CG 30/31/38 region.
1 Introduction
Most massive stars are found in their natal clusters and associations. Low mass pre-main sequence (PMS) stars are also found in close proximity to massive stars, such as seen in Orion Nebula Cluster (O’Dell et al., 1993; Bally et al., 1998), and in vicinity of the Wolf-Rayet + O star binary system, Vel (Pozzo et al., 2000). As soon as the massive stars begin to burn hydrogen, the protostellar clouds and T Tauri stars in the vicinity of the massive stars could be affected by the winds and strong radiation of massive stars. In contrast to stars formed in such a strong radiation field environment, low mass stars formed in a quiet environment unaffected by massive stars, such as in the Taurus star forming region, may be able to retain larger reservoirs of circumstellar materials, which could prolong the lifetime of accretion disks.
Globules are isolated dense clouds of molecular gas (Bok & Reilly, 1947) with masses of order of 10 – 100 M⊙ and typical sizes of 0.1 – 1 pc. Bok & Reilly (1947) and Bok (1977) initiated studies of star formation in globules, and these have been followed by many others (Schwartz, 1977; Reipurth, 1983; Sugitani et al., 1986, 1995; Lefloch & Lazaref, 1994; Megeath et al., 1996; Hester et al., 1996; Alves et al., 1997; Wolk & Walter, 1998; Bally et al., 2001; Kim, 2002; Kim et al., 2003, and references therein). These globules may form one to a few low mass stars in a very short time scale compared to the mean life time of globules, 1 – few106 years, (see Elmergreen 1998 for review; and references therein). These globules are possible birth places for isolated low mass stars, such as the Sun.
In this paper, we present a study of the star forming region CG 30/31/38 , which lies about 50 – 100 pc from an early O star and OB associations. This distance range is still close enough to be influenced by the radiation, but too far to be affected by the winds of the hot stars. The CG 30/31/38 star forming region is a complex of small molecular cloud cores in the Gum Nebula evaporating due to ionizing radiation from an O star, Pup, and perhaps also due to progenitor of the Vela supernova remnant (SNR). The total ionizing radiation of two OB associations, Vela OB2 and Trumpler 10, may also be responsible for some ionizing fluxes in the Gum Nebula, and might have affected in this CG 30/31/38 region.
1.1 The Gum Nebula
The Gum Nebula, one of the largest H II regions in our Galaxy, was discovered about half a century ago (Gum, 1952, 1955). It covers a large part of southern sky, in Vela, Puppis, Pyxis, Canis Major, and Carina. It is located in the Galactic plane, with a 36∘ diameter, centered at and . The nebula is the largest apparent H II region, with a 36∘ diameter. The linear diameter is 250 pc at a distance of 450 pc (Brandt et al., 1971; Reynolds, 1976a, b). The nature of the Gum Nebula remains unclear: this may be an old supernova remnant (SNR), a fossil Strömgren sphere (Brandt et al., 1971), expanding H II regions (Reynolds, 1976a, b; Chanot & Sivan, 1983) and/or a stellar wind bubble (Sahu & Sahu, 1993, and references therein). The hot stars Pup (O4If) and Vel (WC8+O7.5I), and two OB associations (Tr 10 and Vela OB2) near its geometric center can account for most of the photoionization in the nebula, and their UV radiation probably is the cause of the evaporation of the CGs (Bertoldi & McKee, 1990; Lefloch & Lazaref, 1994).
The distances toward these associations, Pup, Vel, and the Vela SNR, and their relation with the Gum Nebula are poorly understood, and remain controversial. The canonical values for the distances to these objects are about 400 – 500 pc (Brandt et al., 1971; Hawarden & Brand, 1976; Zealey et al., 1983; Henning & Launhardt, 1998, and references therein). However, more recent studies, especially using the Hipparcos data suggest distances of 200 – 400 pc (de Zeeuw et al., 1999; Knude & Nielsen, 2000; Hoogerwerf et al., 2001, and references therein).
The Gum Nebula contains at least 32 cometary globules (CGs) (Hawarden & Brand, 1976; Sandqvist, 1976; Reipurth, 1983; Zealey et al., 1983). Cometary globules are small bright rimmed isolated clouds with head and tail cometary morphology. These are evaporating clouds which are normally associated with H II regions and OB stars. High resolution imaging with the Hubble Space Telescope has revealed smaller, solar-system size globules in Orion (O’Dell et al., 1993; Bally et al., 1998) in which dusty protostellar disks are seen in silhouette. Herbig-Haro (HH) objects and outflow sources are often found in Bok globules, cometary globules (CGs), and bright rimmed clouds. Examples include B 335 (Frerking & Langer, 1982; Keene et al., 1983), HH 120 in CG 30, HH 46/47 in the Gum Dark Cloud (GDC) 1 – 7 (Bok, 1977; Reipurth, 1983), and CB 34 (Keene et al., 1983; Clemens & Barvainis, 1988; Khanzadyan et al., 2002). Some PMS stars have been identified in vicinity of Bok globules and CGs (Reipurth, 1983; Pettersson & Reipurth, 1994; Alves et al., 1997; Kim, 2002).
The tails of the CGs in the Gum Nebula are directed away from the central ionizing sources, Pup, Vel, and Vela pulsar, suggesting that CGs are evaporating away from a common center. The locations of CGs and the direction of the tails show that CGs probably lie at the periphery of the wind-blown shell. If CGs were located on the line of sight between us and their ionizing sources, their tails would not be noticeable. However, the CGs located along the periphery of a sphere can be seen easily, because the tails evaporate in the transverse direction as projected in the sky. Therefore, even though CGs are located at about 50 – 70 pc away from the ionizing sources, the dispersion in distances among the CGs can not be too large, for we are most likely to sample those near or along the periphery that show prominent tails.
From his kinematic studies of the CGs in the Gum Nebula, Sridharan (1992) showed that CGs are expanding away from the common center with a velocity of 12 km s-1. The velocity gradients along the CG tails imply that these tails have expanded for about 3 – 6 Myrs. An extended shell around Vela OB2 association, the IRAS-Vela Shell, has a size and location that seems to be consistent with the ring-like spatial distribution of the CGs (Sahu, 1992). Note that the radius of this ring of CGs are smaller than that of the Gum Nebula. The expansion of this shell might have been caused by radiation driven stellar winds and multiple supernova explosions. The expansion velocities of CGs and this shell, on the order of 10 km s-1, are consistent with this, implying that the cause of CG expansion may be the same as the one for the IRAS-Vela shell.
1.2 The CG 30/31/38 complex
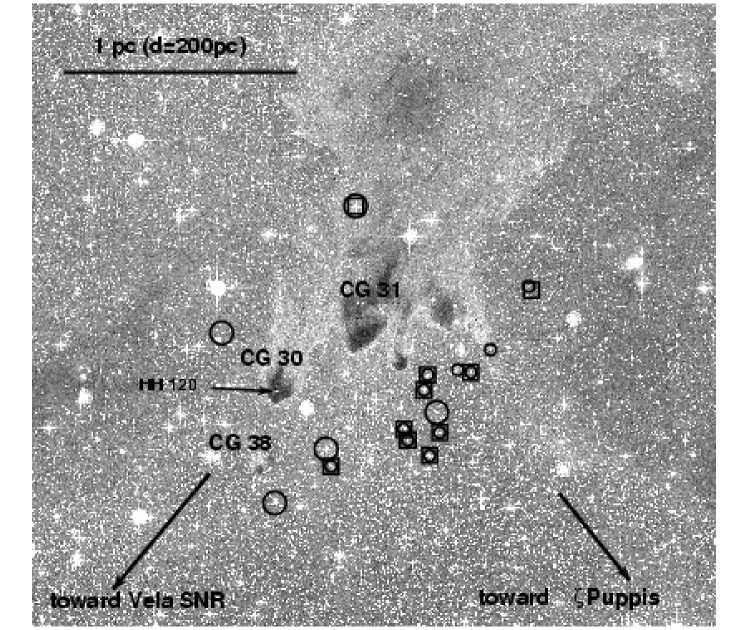
Cometary globules, such as the CG 30/31/38 complex in the Gum Nebula, provide a unique and convenient setting wherein to study star formation in an intermediate radiation field at a moderate distance from hot stars. Figure 1 is the Digital Sky Survey (DSS) image of the CG 30/31/38 complex. CG 38 is the smallest CG in this complex, seen just below CG 30. The head of CG 30 (2′ in diameter) contains a Herbig-Haro system, HH 120, and the IR source CG 30-IRS 4 (Reipurth, 1983; Pettersson, 1984). Its 10′ long tail points away from the central ionizing sources (i.e. Vela SNR, Vela OB2). CG 31 has 5 distinct clouds. The tail of CG31 A is 25′ – 30′ long (1 – 1.5 pc at 200 pc). The change in the orientation of the tails of CG 31 coincides with the proper motion direction of Pup. Pettersson (1987) identified three early M stars with Wλ(Hα)10 Å in this region as H emitting T Tauri stars.
2 Observations
To identify PMS stars in the CG 30/31/38 region, we obtained X-ray images, optical, and near IR photometry. We then obtained high resolution multi-object spectra of photometrically-selected samples to confirm the youth and membership of the samples. In this section, we describe these observations, the data reduction processes, and the calibration of the multi-wavelength photometry and high resolution multi-object spectroscopy.
2.1 ROSAT/HRI photometry
X-rays are an efficient means of selecting candidate low mass PMS stars (Montmerle et al., 1983; Walter et al., 1988, and references therein), because these stars are rapidly rotating and highly convective, the two ingredients which generate strong solar-like-coronal and chromospheric activity. Magnetically active PMS stars (G, K, and M dwarfs) have X-ray luminosities of 1029 erg/sec, and X-ray to bolometric flux ratio () of about 10-3 – 10-4 (Walter et al., 1988; Feigelson et al., 2002; Flaccomio et al., 2003a, and references therein). In contrast the Sun’s X-ray luminosity varies from 1026 to 1027 erg/sec, and its flux ratio varies from 10-6 – 10-7. We use the spatial coincidence of bright stars with an X-ray-to-bolometric flux ratio () 10-4 as the initial selection of the potential PMS stars. Since this criterion also selects magnetically active foreground stars and fast rotators, we also obtained optical and near IR imaging data to select an unbiased photometric sample of candidate PMS stars.
The CG 30/31/38 region was targeted in the ROSAT observation RH 201400, a 18364 second exposure obtained between 12 and 15 May 1994. The image was centered at =8h9.2m, =36∘6. Thirteen X-ray sources were detected in the 23′ radius field of CG 30/31/38 region by the standard SASS source detection algorithm in 12″12″ or 24″24″ detection cells (Table 1). Eight of the nine sources detected in the 12″12″ were recovered in the larger detection cell. These X-ray sources show a non-uniform spatial distribution, generally outlining the heads of the CG 30 and CG 31 (Figure 1).
The ROSAT high-resolution imager (HRI) has little intrinsic energy resolution; we converted the HRI count rates (0.4 – 2 keV) to fluxes using the standard energy-to-counts conversion factor (ECF)111see Table 8c and Figure 30 from The ROSAT High Resolution Imager (HRI) Calibration Report, ftp://sao-ftp.harvard.edu/pub/rosat/docs/hri_report99/hri_99.ps for Raymond-Smith spectral model. We assume a 1 kT thermal spectrum, and converted AV to NH (NH=2.01021 cm-2 mag AV). We estimated AV values from the spectral types (see section 3.3) and observed colors, adopting intrinsic colors from dwarf stars (Kenyon & Harmann, 1995; Luhman, 1999; Leggett et al., 2001). We assumed the standard galactic extinction law with R=3.1.
2.2 Optical followup photometry
We obtained optical photometry of selected CG complexes in the Gum Nebula on the nights of January 29 – 30, 1996. We used the CTIO 0.9m telescope with the 20482048 Tektronix CCD (a pixel scale of 04/pixel in a 136 field of view) and filters. During March 6 – 12, 2001 we obtained more BVRI photometry in these fields with the same setup. All data were obtained on photometric nights, with the mean seeing of 12.
Bias, dome flat fields, and sky flat fields were taken at the beginning and the end of each night. Long (60 and 300 sec) and short (10 and 20 sec) exposures were taken for all the object fields to avoid saturation of bright stars in the fields. Landolt (1992) standard fields were observed several times per night to establish photometric calibration.
Since the Gum Nebula lies in the Galactic plane there are typically more than 2000 stars in each field, many of which are heavily blended. We reduced the images with IRAF/DAOPHOT package. Since the point spread function (PSF) depends on the location within the CCD, we selected between 40 and 80 PSF stars in each field, and determined the spatial dependence of the PSF using quadratic fits in both directions of the CCD.
The full width half maximum values used for the IRAF DAOPHOT photometry were between 12 to 18 pixels, while the radius for standard star photometry was 18 pixels. Therefore, an aperture correction was made to the 18 pixel (72) aperture. The photometric errors are about 1% at , and 5 – 10% at . The aperture correction is accurate to 1 – 2% in general.
We used imwcs in wcstools (Mink, 1999) version 2.7.2 for the astrometric solutions. The positions of stars were determined using the Gaussian centroid algorithm in IRAF phot routine, then the astrometric solution was derived by fitting the pixel coordinates of stars to the known positions of USNO-A2.0 astrometric standards (Monet 1998) located in each image. The imwcs package projects the image onto the tangent plane of the sky, rotates the image, and fits a polynomial to the x and y coordinates. In each image, about 120 – 150 stars were matched with USNO-A2.0 astrometric standards with an average error of 01. We then averaged the positions measured in the V, R, and I band images for each star to give the final position.
2.3 Near-IR photometry
We obtained JHK images covering all the X-ray sources using the CIRIM detector on the CTIO 1.5m telescope during February 5 – 6, 1996 and February 17 – 20, 1997. CIRIM uses a 256256 HgCdTe NICMOS 3 array, and at f/13.5 gives a pixel scale of 044/pixel. Images were dithered by 15″ in RA and DEC, and median filtered to determine level of the sky. For the targets we used a 6-point dither pattern. We used a 4–point dither pattern for the standard stars.
We reduced and analyzed the data using the IDL/DoCIRIM software (Walter, 2000) and custom written IDL codes. We first generated median sky filtered and subtracted images. Standard stars were chosen from the Elias (Elias 1982) and UKIRT FS standard star lists.222http://www.jach.hawaii.edu/UKIRT/astronomy/calib/phot_cal/fs_fundamental.html For astrometry we match stars in an image with USNO A2.0 catalog stars, and determine the image center and plate scale. We performed standard star photometry using a radius of 20 pixels (88), and generated the photometric solution on the CIT system. For object stars we used a default aperture radius of 31, but we also used smaller apertures for objects that are faint or close to neighboring stars. We derived the aperture corrections from the standard stars, and corrected our targets to 20 pixel apertures. In this study, we used only those stars with photometric error 5%, which corresponds to K 15 – 16 magnitudes.
2.4 Matching optical, near-IR counterparts, and X-ray sources
We matched the coordinates of X-ray sources with those of optical and near-IR stars to identify potential counterparts. The ROSAT/HRI X-ray source positions have data has much larger positional error (see Table 1) than those of the optical and near-IR catalogs. The matching algorithm, therefore, identified optical and near-IR sources within the X-ray error circles (Table 1). The HRI flux limit was such that a star matching the 10-4 criterion has 16. Since X-ray, optical, and near-IR data were not obtained simultaneously, and PMS stars are variable, we also considered stars up to 1 mag fainter. Twelve of the HRI sources have bright ( 17; 13) optical and near-IR counterparts within the 3 X-ray error circles. For the X-ray sources that were matched with more than one optical and IR source, we chose the brightest sources among all the sources within the error circle. The faintest optical counterpart, XRS 3, has magnitude of 17.27; XRS 1 does not have an optical counterpart with 17 within its X-ray error circle.
2.5 Optical spectroscopy
During March 6 – 8, 2002 we obtained multi-object high resolution spectra of the candidate PMS stars (see Section 3), using the HYDRA multi-fiber spectrograph on the CTIO Blanco 4m telescope in echelle mode. The goals of these spectroscopic observations were to confirm the youth of these stars using Li I 6708Å absorption lines and to measure their radial velocities. The spectra also reveal the spectral types, and we can estimate extinction toward the PMS stars by comparing the measured colors with the intrinsic colors expected for the observed spectral types. The radial velocities let us determine membership probabilities, by comparing the distribution of velocities with that of the CGs. Using CTIO/HYDRA, one can obtain spectra of up to 135 objects (stars and sky) in a 40′ field of view simultaneously. Since the overall efficiency of the HYDRA in echelle mode is about 3%, we chose targets that were brighter than mag. The S/N was sufficient to detect Li I lines with strengths expected of PMS stars.
2.5.1 Spectroscopic sample selection
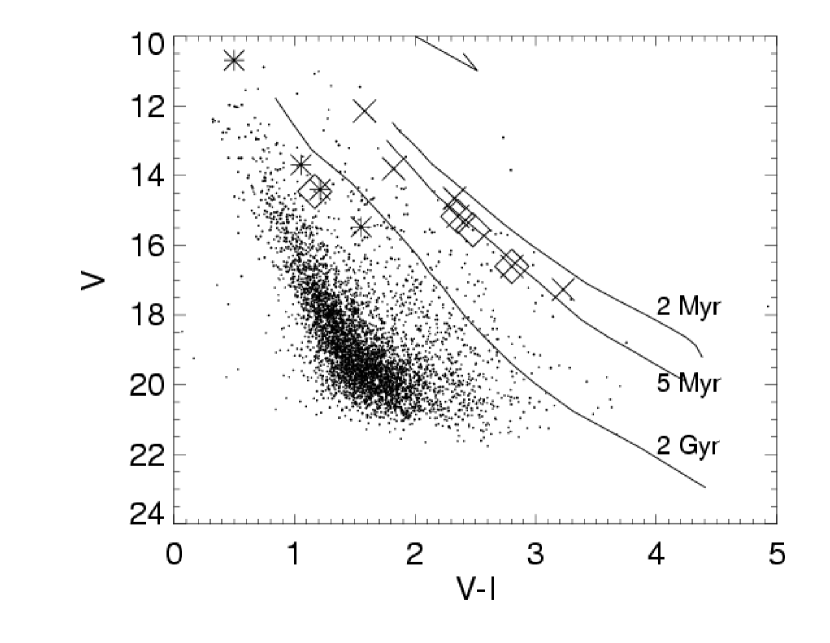
We selected as targets those stars that are coincident with the HRI X-ray sources and other stars whose colors lie in the appropriate region in the Color-Magnitude Diagram (CMD) for PMS stars at a distance of 200 pc. magnitudes of targets range between 10 and 17. In each field there are between 50 and 200 objects near the PMS locus in the CMD (Figure 2). At the bluer end (1.0) of the CMD, the non-X-ray emitting stars in the PMS locus are heavily contaminated by background stars in the galaxy, but the fainter and redder candidates are less likely to be contaminated. Since the Gum Nebula is located in the Galactic plane, some of the fields suffer severe contamination.
2.5.2 Spectroscopic observations, data reduction, and wavelength calibration
We observed 144 objects in two 40′ diameter fields on March 6 and 7, 2002. Three exposures were taken of each target field. These were combined using the IRAF combine with the median sigma clipping algorithm. Three offset sky spectra were also taken at a position offset 10″ from the targets after each target exposure. These sky spectra have 10% of the integration time of the target spectra. These sky offset images were used to identify background nebula emission line profiles. The sky subtraction is discussed in more detail in section 2.5.3.
We used the IRAF/HYDRA package for basic data reduction, and also some custom written IDL codes for various calibration purposes. We first fit the CCD overscan of the each image interactively, and trimmed all images. We then created a combined bias (zero) for each night, and subtracted it from all images. We created a milky flat image from daylight sky exposures, which we used to flatten all other images.
Scattered light was subtracted from images using abscat task. The scattered light is a global 2-D feature, and is subtracted before each aperture is traced and extracted. Then the IRAF/apall task was used to extract spectra. The FWHM of a fiber is about 6 – 7 pixels, so we selected 3 pixels for upper and lower widths, and extracted a total of 6 pixels centered at the center of each trace.
We took about 5 dusk and 5 dawn twilight sky spectra each night to make combined dusk and dawn sky spectra. Th-Ar comparison lamp exposures were taken at the beginning and end of each night for wavelength calibration. The mean residual of the wavelength solutions is Å (0.5 pixel). Etalon comparison lamp exposures were taken before and after taking Th-Ar lamps, and between every configuration of object fields to correct for the zero point shift throughout the night. We selected as reference the etalon spectrum which was taken immediately before or after the Th-Ar comparison exposure each night; all other etalon spectra were cross-correlated in pixel space. We calculated the zero point shifts in pixels, and then applied the shift to derive wavelength vectors for all object spectra.
Since the Th-Ar signal was weak during the first night of observation, because of a faulty lamp, we used the second night’s Th-Ar solution. Some apertures that contained high enough S/N in first night’s Th-Ar spectra were cross-correlated with the second night’s Th-Ar spectra. The median pixel shift of 0.023 pixels is very small. We applied this shift to first night’s Th-Ar solution; the rest of the wavelength calibration using the etalon was done the same way as on night 2. IRAF/dispcor was then used to dispersion-correct sky spectra and object spectra using Th-Ar solution as reference spectrum. The starting wavelength and dispersion (Å/pix) were derived for each of the 135 fibers; then the zero point was shifted using the cross-correlation results from Th-Ar and etalon spectra.
2.5.3 Sky Background Subtraction
The nebulosity in these regions complicates the sky subtraction. In addition to the offset sky spectra, we also devoted between 10 and 20 fibers in each configuration field to sky. Here we use the term sky background to refer to the emission lines due to nebulosity, which is particularly important for measuring the strength of the stellar H lines. The sky emission line strengths of H and [N II] vary across the 40 ′ field of view. The background sky line profiles vary spatially due to the kinematics of the expanding gas shell in the Gum Nebula.
We group the sky spectra into three general categories, based on the H and [N II] line profiles and strength. Group 1 has narrow and strong H and [N II]; group 2 has asymmetric and broader line widths than group 1; and group 3 has broader line widths than group 2, possibly with double-peaked lines.
To check the strength and profile of night sky emission lines, we compared the night sky spectra obtained during the long exposure with the combined three offset sky spectra which were taken 10″ offset from the target field immediately following each of the three sub-exposures. Although the strength of the H lines in the offset sky spectra were 10% of long exposure sky lines, the offset sky spectra helped determining which subgroup of sky profile should be used for each star.
We subtracted the appropriate sky spectrum from the object spectra. Due to the spatially variable background sky line profiles, sky background can not be perfectly subtracted. However after careful checking, we are confident that we can derive the equivalent width of H to an accuracy of 0.8Å. Line emission is not a problem at the 6708 Å wavelength of Li I.
3 Results
From X-ray, optical, near-IR photometry, and optical spectroscopy, we have identified 16 young stars (Table 2). Eight of the 13 X-ray sources (XRS) listed in the Table 1 are spectroscopically confirmed young stars, two X-ray sources were not observed, and three do not appear to be young stars. We identified eight more young stars, not detected in the ROSAT/HRI observations, based on the Li I 6708 Å absorption line. Of the 16 stars, radial velocities of eleven are consistent with that of the CGs (Sridharan, 1992; Nielsen et al., 1998). In the next section we discuss our results from X-ray photometry; optical and near IR photometry; and optical spectroscopy.
3.1 X-ray photometry
In Table 1 we present X-ray count rates of the 13 X-ray sources. We also present the offsets in X-ray coordinates and the optical counterparts. Table 2 lists spectroscopically confirmed young stars along with their spectral types, H and Li equivalent widths, Li abundances, and AV values.
Using the ROSAT/HRI photometry, optical photometry and spectroscopy, we derived X-ray to bolometric flux ratio for 10 X-ray sources (Table 1). Using the spectral types (see section 3.3.1), we adopted bolometric correction values from a color table that was compiled using published color tables by Kenyon & Harmann (1995); Luhman (1999); Leggett et al. (2001), which can be found in Table 3 of Sherry et al. (2004).
We used Table 3 from Sherry et al. (2004) to estimate unreddened colors and bolometric corrections for our spectroscopic sample. This table combines spectral types, bolometric corrections, and colors from Kenyon & Harmann (1995) and Leggett et al. (2001) with the PMS temperature scale of Luhman (1999). We derived AV for each star by comparing its predicted unreddenned B – V color to the observed B – V color. As a check on the derived AVs, we compared the spectral energy distribution (SED) for each star derived from our V, R, I, J, and H band data to model SEDs for K and M stars with a range of AVs. AVs derived from the SEDs were consistent with the AVs we calculated from the B – V colors, but with larger uncertainties on AV. This suggested that our uncertainties on AV were two – three times as large as we had estimated from the B – V colors. The larger uncertainties are incorporated into Table 2 and Figures 3 and 4.
3.1.1 and
Figure 3 shows X-ray flux vs. bolometric flux ratio of 10 X-ray sources listed in Table 1 in logarithmic scale ( vs. ). XRS 5 and XRS 12 are confirmed not to be PMS stars, and since we do not have optical flux of XRS 9, we do not include these three sources in this plot. Two high points are KWW 1863 (XRS 4) and KWW 1637 (XRS 6). These high count rates suggest strong coronal activity or flaring. All the sources appear above () = -3 line.
Figure 4 is a X-ray to bolometric flux ratio vs. effective temperature in logarithmic scale (() vs. (Teff) plot of the 10 X-ray sources plotted in Figure 3. The () values ranges from -3 up to -1.5. Active K and M type stars are known to have () ratio from 4 up to 1, while () of PMS stars with spectral types earlier than G type range between -4 to -2.
In Figure 4 we overplot 3 detection limits. These stars lie just at or slightly above this 3 detection limit. The mean () for other star forming regions is about 3.5 (Feigelson et al., 2002; Flaccomio et al., 2003a, b, and references therein). This suggests that the HRI sources represent 15% of the X-ray bright PMS population if we assume that of the 0.1 2 M⊙ PMS stars follows that of typical young star clusters. If the log() of this star forming region follows the distribution of ONC (Flaccomio et al., 2003a, b), for the mass range of 0.2 M⊙ – 1.0 M⊙, there could be roughly six times more PMS stars with log() 3.0.
3.1.2 Variability
We examined the X-ray light curves for variability. Since the number of source counts is small, we could look only for evidence of gross changes in the count rate. Of the brighter sources, only KWW 1637 (XRS 6), a double-lined spectroscopic binary PMS system, shows any evidence of variability, at about the 2 confidence level, in 30 ksec bins. The variation on timescales between 30 and 250 ksec is no more than about 30% from the mean. Among the weaker sources, KWW 1055 (XRS 10) appears variable. All the counts arrived in the first half of the observation. The probability that the source is constant is 0.007 based on statistics.
3.2 Color-magnitude diagram
Figure 2 is the CMD for objects in the CG 30/31/38 region. Stars that are likely counterparts of X-ray sources are indicated with crosses and asterisks. The limiting magnitude of X-ray flux, assuming log() = -4, corresponds to magnitude of 16. The reddening vector, plotted on upper part of the CMD, is a line running almost parallel to the isochrones. Evolutionary tracks and isochrones are from Bareffe et al. (1998) modified using temperature scale and colors of Kenyon & Harmann (1995); Luhman (1999); Leggett et al. (2001) for low mass stars. Isochrones for ages of 2 Myr, 5 Myr, and 2 Gyr are plotted for a distance of 200 pc.
The positions X-ray sources plotted in the CMD (Figure 2) seem to delineate two distinct loci parallel to either the ZAMS or a PMS isochrone. The upper locus is defined by six X-ray sources ( symbols) and three previously cataloged PMS stars (diamond symbols; Herbig & Bell (1988)). A 5 Myr isochrone (Bareffe et al., 1998) at the 200 pc distance of the cloud complex is a good match to this locus (see Figure 2). Four X-ray sources (asterisks) and one H source (diamond; Schwartz et al. (1990)) trace a distinctly different locus about 2 – 3 magnitudes fainter than the upper locus. At a 200 pc distance these objects lie below the main sequence; they must represent a distinct and more distant population.
By using the minimum likely distance of 200 pc to CG 30/31/38 complex (Knude et al., 1999), we can place an upper limit on the age of the stars if they are indeed PMS stars at a common distance. The uncertainty in the age does correlate with the uncertainty in the distance. However, for young low mass stars one may use Lithium abundance to further constrain the age (see §3.4). For example, M stars with log N(Li) 3 are likely to be younger than 5 Myrs old (Walter et al., 1994; Martín et al., 1994, and references therein). Conversely, by assuming (or measuring) an age we can constrain the distance to the cloud complex, if spatially related to the stars.
3.3 Spectra
Multi-wavelength photometry enables us to produce a large and unbiased sample of candidate PMS stars, but is subject to contamination. Because photometry alone can be ambiguous, spectroscopy is necessary to confirm the youth and membership of stars using Li I 6708 Å lines and radial velocities. In the previous sections, we described selection of candidate PMS stars using X-ray, optical, and near IR photometry. To confirm the youth of our photometrically selected PMS stars, we obtained high resolution multi-object spectra of our candidates. In section 2.5 we described the multi-fiber spectroscopic observations using CTIO-4m/HYDRA, data reduction, and calibration. Here we present the spectra and results from our spectroscopic observations and analysis.
3.3.1 Spectral type determination
Spectra of PMS stars are shown in Figures 5a – 5e. We flattened the continua of the spectra using a polynomial fit, and normalized to unity. We estimated the spectral types by comparing with spectra of 26 standard stars obtained at comparable dispersions.
The 6400 – 6720 Å wavelength range is not ideal for spectral type determination, because of the paucity of strong lines that can be used for spectral type determination. We estimated the spectral types mainly using Fe I and Ca I lines. The strength and structure of the 6495 Å blend was used to distinguish spectral types for spectral range of F – K. TiO bands were used for the determination of late K and M spectral types.
The results are summarized in Table 2, and also discussed in the Appendix. The uncertainties on the spectral type are about 0.5 subtypes for K and M stars, and are larger for stars with earlier spectral types.
3.3.2 Spectroscopically confirmed PMS stars
In Figures 5a – 5e we show the spectra of the confirmed and possible PMS stars. Two of the confirmed PMS stars (KWW 1892 and KWW 1953) were observed twice. Three of the X-ray sources (XRS 5, 11, and 12) in the photometrically selected sample do not appear to be PMS stars. Spectra of KWW 1043 (XRS 8) and XRS 13 were not obtained, because these were too faint. We identified the Li I 6708 Å absorption line in 15 stars. Ten of these also have H in emission. Only KWW 873 shows near-IR excess. One star on the lower locus, KWW 314, is an early type star with an H profile reminiscent of an Ae star. The spectral type is A3 (see the Appendix). Not surprisingly, no Li absorption is evident.
Based primarily on the presence of the Li I 6708 Å line (next section), we confirm that eight X-ray sources. KWW numbers 464, 1892, 598, 1863, 1637, 873, 1055, and XRS 9, are PMS stars. H line profiles of these PMS stars are described in more detail in the Appendix. We also find 8 other young or active stars that were not detected (or not observed) in X-rays, KWW 314, 975, 1125, 1302, 1333, 1806, 1953, and 2205 (see Table 2).
Three PMS stars from the Herbig-Bell catalog (Herbig & Bell 1988), HBC 553, 554, and 555, also lie along the upper locus in the , CMD (diamonds in Figure 6). We observed two of these stars, KWW 1892 (HBC 553) and KWW 975 (HBC 554). We did not observe KWW 1043 (XRS 8), the likely counterpart of HBC 555. Table 2 includes the derived properties of these HBC sources.
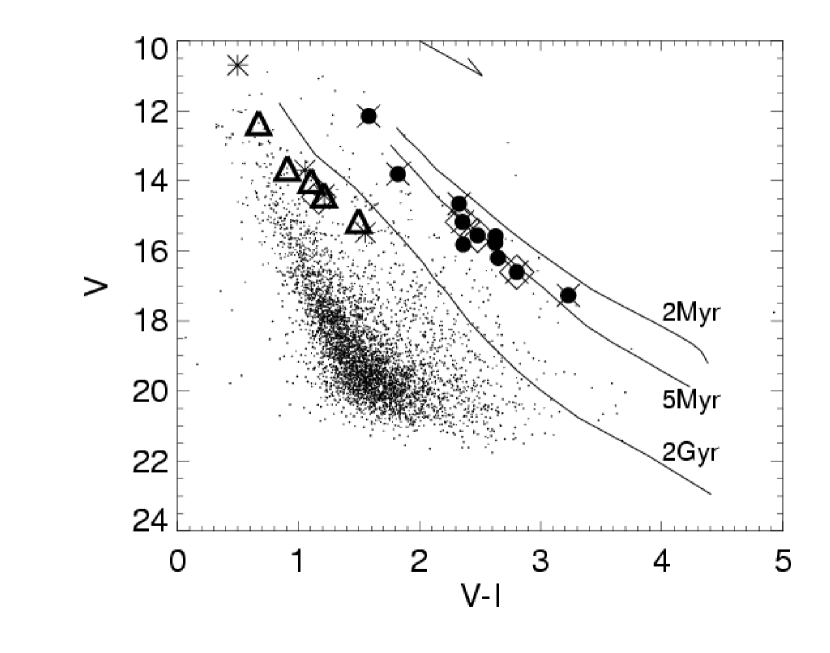
Short descriptions of each of these stars can be found in Appendix. Table 2 summarizes our results. In Figure 6 the stars marked with ’s and asterisks are the X-ray sources as in Figure 2. We mark the confirmed PMS stars with filled circles (upper locus) and open triangles (lower locus). Note that the PMS stars in the upper locus are clustered spatially below the CG 31 complex (boxes with circles in Figure 1).
Inclusion of the optically-identified young stars strengthens the case for the existence of 2 parallel loci in this CMD (Figure 6) The upper locus is idefined by the X-ray sources (), HBC sources (diamonds), and spectroscopically-young stars (filled circles). The Li abundance, ratio, and the H emission, are all consistent with the interpretation of the upper locus as an isochrone defining a PMS stellar population.
The lower locus is defined by X-ray sources (asterisks) and spectroscopically confirmed young stars (open triangles). Note that only one X-ray source (KWW 1055) is confirmed to be a PMS star, while XRS 11 and 12 are not PMS stars. As mentioned earlier, the spectrum of XRS 13 was not obtained. If the stars on the lower locus are at 400 pc, the age inferred from isochrone fitting is 100 Myr. If young, these stars are likely to be at a distance greater than 400 pc. They may be unrelated to the CG complex and the stars on the upper locus.
3.4 Lithium abundance
The lithium abundance is of interest because it both probes stellar structure and age, and also constrains primordial nucleosynthesis models (Duncan, 1991, and references therein). The universal primordial Li abundance, logN(Li), is 3.1 (on the scale of logN(H)=12), however the Li abundance of halo stars is 2.1, while the mean distribution of logN(Li) values for PMS stars in young clusters peaks at 3.1 (Duncan, 1991; Martín et al., 1994).
High Li abundances can be indicative of the youth of solar mass or less massive stars, because the temperature at the base of convection zone is still too low to burn lithium for 1 – 10 Myrs. These cool stars (M 1 M⊙) have deeper convective envelopes, and processes such as convective overshooting mix the surface and deeper (hotter) layers causing faster Li depletion than in higher mass stars. For higher mass stars (M 1 M⊙) Li depletion is not significant, because they spend less time in the PMS stage, and the convection zone is thinner than in low mass stars (King, 1993; Ventura & Zappieri, 1998). Because of this fast lithium depletion, lithium can be a good indicator of ages in low mass stars.
We derive lithium abundances, log N(Li) using both NLTE (Pavlenko & Magazzu, 1996) and LTE (Duncan, 1991) analyses. The results are presented in Table 2. Since these curves of growth are valid for T 3500 K, the curve of growth for lower temperature were extrapolated for the stars 3200 K T 3500 K. The derived Li abundances for K6 and K7 stars (XRS 6 and XRS 7) are higher than the universal value (3.82 and 3.56 for NLTE). The high value for these K stars are consistent with observations of other PMS stars, e.g., Basri et al. (1991); Martín et al. (1994); Walter et al. (1997).
The individual values of log N(LI) among the M stars, all on the upper locus, range from 2.19 to 3.08 (in NLTE), with a mean of 2.68 0.28 (3.26 0.15 in LTE), where the uncertainties are the standard deviation of the means. The uncertainly on any single log N(Li) value is about 0.2 dex. The mean Li abundance is consistent with the expected age of the cloud complex (3Myr). The wide range in log N(Li) among the individual stars could be due to the difficulty of determining the continuum level. The uncertainty in the adopted Teff of up to 200 K compounds the uncertainty. For KWW 1892 and KWW 975, the Wλ(Li) for two different nights vary by 0.14 and 0.16Å, which caused 0.38 and 0.52 dex differences in the Li abundances.
The F – G stars on the lower locus also show high Li abundances. Since F – G stars do not burn lithium as fast as late K or M stars do, such stars need not be pre-main sequence, but could be 50 – 100 Myr old main sequence stars.
3.5 Kinematics of PMS stars and CGs
Radial velocities were derived using Li I 6707.8 Å and Ca I 6717.685 Å lines. The FWHM of a fiber of the HYDRA/echelle spectrograph is about 6 pixels (0.96Å, 43.9 km s-1), however we can derive radial velocity good to about 3 km s-1 by centroiding. To estimate radial velocities, we derived ( ), where is observed wavelength, and for Li I and Ca I are from Rao & Lambert (1993). The heliocentric correction of -8.2 km s-1 was then applied. To compare the velocity with VLSR (velocities with respect to the Local Standard of Rest) for the CGs, we then derived VLSR for all the stars. The correction to VLSR is about -17.3 km s-1 (Lang, 1980). We present the radial velocities in Table 2.
The VLSR of the K – M type PMS stars range from 4.2 – 8.9 km s-1, with a mean measurement error 2.9 km s-1. This is similar to that of the CG clouds (Nielsen et al., 1998) of 5.1 – 7.4 km s-1. This strongly supports the association of the PMS stars with the CG 30/31/38 clouds. The 2.7 km s-1VLSR of XRS 10 is not significantly lower than the rest of the PMS stars. The radial velocities of the stars along the lower locus are inconsistent with of CGs, unless some of these are single-lined spectroscopic binaries.
3.6 Spectroscopic Binaries
Binary stars yield fundamental astrophysical parameters: stellar masses and occasionally, radii. It is very difficult to estimate masses and ages of PMS stars by only fitting models, as it is the case in our study. Dynamical determination of masses of binary PMS stars would enable us to better estimate the ages.
Spectroscopic binaries have short (few days) periods. This means that the separation of two stars are very small. Mayor & Mermilliod (1984) suggested that the dynamical evolution of the short period low mass binary systems depends on their PMS history. These spectroscopic binaries are, therefore, a very important resource to help us better understand the star formation history of multiple systems.
We identified two double-lined spectroscopic binary systems (SB2): KWW 1637 and KWW 1125 (in Figures 5b, 5d). The separation between the Li I 6708 Å lines is 0.7 – 0.8 Å (33 km s-1) for XRS 6, and 4.5 Å (200 km s-1) for KWW 1125. XRS 6 is a strong X-ray source which also shows significant X-ray variability. KWW 1125 has broad H and Li absorption lines with a large separation between the lines of the two components, which means that this system may have a very short, few days, orbital period.
HBC 554, also known as PH 14 (Pettersson, 1987), is a visual binary star (Reipurth & Zinnecker, 1993). Therefore, of the 17 stars listed in the Table 2, there are at least three binary systems. Unfortunately, we have only single epoch observations on these systems; we can not determine any orbital parameters with only the current data.
3.7 Color-Color Diagrams and the Circumstellar Disk Fraction
In the color-color diagrams (Figures 7, 8) we plot the young stars using filled circles (K – M stars from the upper locus) and triangles (lower locus). In Figure 7 the X-ray sources are plotted as crosses and asterisks for comparison.
Among the stars in the upper locus, only KWW 873 shows a convincing near-IR excess in both Figures 7 and 8, with H – K 0.2 mag. KWW 1892 and KWW 1637 may have marginal excesses. KWW 1892 is clearly a CTTS, based on its H equivalent width. However, a small excess (H – K 0.1) of KWW 1892 is within the uncertainties of spectral type and AV measurements. KWW 1637, a SB2 binary system, shows variability in X-ray, and also between the near-IR photometry from this study and 2MASS photometry, therefore it is unclear if this system has near-IR excess (H – K 0.1) due to a circumstellar disk. Four upper locus stars lie along the CTTS star locus (Meyer et al., 1997) in Figure 8, but they have reddened photospheres with AV values between 0.5 – 1.3, and do not have near-IR excess. The stars in the lower locus (triangles) have normal photospheric colors within the scatter.
A near-IR excess may indicate the presence of an inner circumstellar disk around a young star, e.g., (Hillenbrand, 2003, and references therein). In our color-color diagrams, one PMS star among the eleven on the upper locus shows a convinving near-IR excess. The circumstellar disk fraction for this group of stars is 9%. The disk fraction derived using only JHK colors will under-estimate the true disk fraction, especially among the cooler stars. therefore we consider the 9% as a lower limit. This low circumstellar disk fraction is consistent with those seen in star forming regions where O stars are present, such as Upper-Sco (Walter et al., 1994; Hillenbrand, 2003) or NGC 2362, which shows about a 10% disk fraction at the age of 5 1 Myr. However it is lower than some other known star forming regions, such as NGC 2264 (55% at 3 Myr, Haisch et al. 2001), and the TW Hydrae association ( 20% at 10 Myr).
The survival time of inner circumstellar disks in T associations is suggested to be about 3 – 10 Myr, however exceptions exist in some cases which show very low circumstellar disk fraction in young (3 Myr) associations, e.g., (Walter et al., 1988; Haisch, 2001; Hillenbrand, 2003, and references therein). When exposed to strong UV radiation from nearby O stars, surrounding reservoir gas that supplies gas to the circumstellar disks evaporate quickly. By losing reservoir gas due to the photoevaporation, those circumstellar disks exposed to UV radiation would likely have shorter lifetime than the systems without a source of UV radiation nearby.
4 Discussion
We have identified 16 young low mass stars along the line of sight to the CG 30/31/38 complex. These stars trace out two distinct loci in the CMD.
The eleven stars that lie along the upper locus have K – M spectral types. Their Li abundances are consistent with an age 5 Myr. Their location in the CMD is consistent with a 5 Myr isochrone at the 200 pc distance of the GC complex. The 4.2 to 8.9 km s-1 (2.9 km s-1) stellar radial velocities agree well with the 5 – 7.5 km s-1 radial velocities of the CG 30/31/38 complex (Sridharan, 1992; Nielsen et al., 1998). This supports the interpretation that these eleven PMS stars are physically associated with the CG complex.
The stars on the lower locus must be in the background, whether or not they form a coherent group. However, they show neither coherent radial velocities (see Table 2) nor a spatial concentration. We suggest that these stars are unlikely to be associated with CGs or with the 11 PMS stars along the upper locus. These stars all have spectral types earlier than K and all lack H emission. Five of the F – G stars exhibit strong Li I absorption lines. Of the three X-ray sources on the lower locus (KWW 1055, XRS 11, and XRS 12) only KWW 1055 shows Li I 6708 Å line.
KWW 314, which lies on the lower locus, is an early-type star. We obtained a low dispersion (4.3/AA/ resolution) blue spectrum using the SMARTS 1.5m RC spectrograph in February 2004. The spectral type is A3; the extinction EB-V is 0.9 0.2 mag. There is no emission above the continuum between 3500 and 5100Å. The is consistent with a reddened early A star reddened by 3 mag. This suggests an intrinsic 12. The distance modulus then places this star at 1.2 kpc. The extinctions to the other stars on the lower locus are much smaller, and inconsistent with that of KWW 314. We conclude that the lower locus is not a physical association, but a spurious alignment of 6 young, possibly PMS, background stars and a perhaps unrelated A3e star.
The log() values of the PMS stars imply that all the K and M stars detected in X-rays are active PMS stars. Since the X-ray detections are only slightly above the sensitivity limit, we are likely seeing only the peak of the luminosity distribution if the log() relation of this region is similar to that of other star forming regions, e.g., Flaccomio et al. (2003a, b). If we assume that the log() of this star forming region follows the distribution of Orion Nebula Cluster (ONC) (Flaccomio et al., 2003a, b), in the mass range of 0.2M⊙ – 1.0M⊙, there should be roughly six times as many PMS stars, all with log() -3.0, as we have detected here. This suggests that deeper X-ray exposures may find about 35 more PMS stars with log() -3.0 in this region.
The CMD (Figure 6) shows a cut-off of the upper locus at 18, below which no stars are found. The optical photometry is complete to 20, therefore the lack of stars below 18 (M 0.2 M⊙) is significant. This may be due to selective reddening of lower mass stars, or it may be interpreted as an evidence of a truncated mass function below a certain mass. Deeper and more complete X-ray and IR observations will help us to obtain more complete census of PMS stars to answer whether or not the mass function of this star forming region is indeed truncated, and differ from other star forming regions.
In the color-color diagrams (Figures 7, 8), about 9% of the PMS stars show the near-IR excesses indicative of an inner circumstellar disk. This low circumstellar disk fraction, also seen in other OB associations, may be due to the influence of ionizing sources, such as Pup, the progenitor of Vela SNR, and other O stars. The parent gas cloud, which feeds the accretion disks, may be destroyed by the photoevaporation process from nearby O stars at the early stages of PMS evolution. This photoevaporation could result in a short disk survival time as well as low final masses of those stars. The lifetime of truncated disks with a mass of 1 M⊙ is about 1 Myr if the mass accretion rate onto the star is about M⊙ yr-1. Therefore, about 1 Myr after the disk ceases to accrete from the surrounding cloud the circumstellar disks should dissipate, which may explain the low circumstellar disk fraction seen here compared to that of quiet star forming regions like Taurus.
Three PMS stars show evidence of accretion in their H emission line profiles. Even though their near-IR excesses are not significant, they may still possess circumstellar disks. We suggest that the circumstellar disk fraction and disk lifetime depends not only on age, but also the environment. Mid-IR photometry will help us to derive a more reliable estimate of the circumstellar disk fraction of these systems.
We identified two double-lined spectroscopic PMS binary systems (KWW 1637 and KWW 1125). KWW 1953 was observed twice on different nights: the Li I 6708 line profiles are very wide (about 2Å) and are also varying. This may due to the fast rotation of the star, or could also be a potential double-lined binary that were not completely resolved.
4.1 Star formation in photoevaporating globules & Star formation history of CG 30/31/38 complex
For globule-size triggered star formation, the triggering mechanism can be shock compression by a supernova explosion (Vanhala at al., 1996), an expanding H II region (Fukuda et al., 2000), radiation driven implosion (Lefloch & Lazaref, 1994, 1995; Lefloch et al., 1997), and the stellar wind from massive stars (Boss, 1995, and references therein). Ionizing photons from OB stars photoevaporate the molecular clouds, destroying giant molecular clouds. However before the total destruction of whole cloud occurs, pre-existing dense parts or cores of the parent molecular cloud can survive and form one star or a group of stars.
The CG formation scenario was discussed by Bertoldi & McKee (1990). Lefloch & Lazaref (1994) imply that these small globules in H II regions are evaporating and being compressed due to the external ionizing sources. Theoretical studies involving “rocket effects” and the “radiation driven implosion” models (Oort & Spitzer, 1955; Reipurth, 1983; Lefloch & Lazaref, 1994) explain how a shock can drive into a spherical clump, compress it, and produce the cometary shape of clouds in pressure equilibrium with surrounding photoevaporating gas. The globule then can be accelerated away from the UV source as it photoevaporates.
Whether or not small scale triggered star formation can happen in globules depends on a number of physical conditions, such as the time scale needed to form a star, the rate of photoevaporation, the shock velocity, magnetic field strength and orientation, etc. The theoretical studies mentioned above show that star formation can be triggered in globules on a time scale short compared to the time needed to destroy or evaporate globules via UV radiation and/or shocks.
Here we suggest a simple star formation history of the CG 30/31/38 complex in the broader context of the star formation history of the Gum Nebula.
About 6 – 15 Myr ago, young clusters (now Vela OB2 and Tr 10) formed in a giant molecular cloud; OB stars in these clusters ionized their neighboring clouds and the H II region expanded (the Gum Nebula). Their wind-blown shells may have been comparable in size to those commonly seen in the giant H II regions of other galaxies, such as those seen in the HST image of NGC 4214.
Approximately 5 Myr ago, the clouds photoevaporated in the UV radiation field of the luminous O stars, while low mass stars formed in dense cores of the pre-CG 30/31/38 complex. Under the strong UV radiation from the O stars, the surrounding gas reservoir of these young stellar objects began to dissipate. This resulted in accretion disk lifetime shorter than those of stars forming far from sources of ionizing radiation.
Some 1 million years ago the runaway early O star Pup moved closer to this CG complex, dissipating the clouds surrounding of these young stars. The kink in the direction of the CG 31 tails is consistent with direction of motion of Pup. By now, the UV radiation has evaporated most of the clouds, though a few dense cores remain. The most recent episode of triggered star formation has occurred in the dense core of CG 30, as evidenced by the Herbig-Haro object HH 120. Note that the average age of this kind of HH objects are suggested to be 105 years, e.g., (Reipurth et al., 2000).
5 Summary
1. Using multi-wavelength photometry and spectroscopy, we identify 14 new PMS stars, adding to the three previously known H -emitting stars in the CG 30/31/38 region. The spectroscopic sample is complete to V16.5; the optical limiting magnitude is about 20.
2. The stars in the CG 30/31/38 complex lie along two distinct loci in the CMD.
3. The upper locus has an age of 5 Myr at d = 200 pc. The spectral types of the stars on the upper locus are K6 – M4. The mean Li abundance for M stars, logN(Li) = 2.68 0.28 for NLTE and 3.26 0.15 for LTE), implies an age of 2 – 5 Myr and supports the youth of the PMS stars. The radial velocities of these stars are consistent with the published velocities of CG 30/31/38 cloud complex.
4. The lower locus has an age of 100 Myr at d kpc. The stars along the lower locus have spectral types F – G, with one Ae star. With an exception of KWW 1055, these stars have radial velocities that are not consistent with those of the CG 30/31/38 complex.
5. The 9% circumstellar disk fraction derived using optical and near-IR excesses is consistent with those seen in other star forming regions with O stars, such as the Upper-Sco, and is lower than those typical of quiet regions, such as Taurus. This suggests that the loss of the gas reservoir for accretion disks at this early stage of star formation is due to the radiation from the OB stars.
6. We find two double-lined spectroscopic binaries in the sample. Including the known visual binary HBC 554, the observed multiplicity fraction among the 17 PMS stars is 18%, which sets the lower limit to the true multiplicity fraction in this region.
8. We conclude that there have been at least two episodes of star formation in the CG 30/31/38 region: (1) On-going star formation triggered by UV radiation from OB stars in the head of CG 30 cloud, as exemplified by HH 120. (2) 5 Myr old low mass (0.2 – 1 M⊙) PMS stars that outline the CG 31 complex, whose formation may have been triggered by pre-existing O stars like the progenitor of Vela SNR and Pup, as well as other OB stars in Vela OB2 and Tr 10.
Appendix A Notes on individual PMS stars
In this appendix we discuss some of the spectroscopically confirmed PMS stars. Coordinates, optical, and near-IR photometry are in Tables 3 and 4 in the discussion section.
KWW 464
This star 17″ away from XRS 1, a 4 deviation.
The M3 spectral type is based on the TiO band strengths.
(Li I) 0.66Å indicates that this is a young star that is
unlikely to be older than 5 - 10 Myr.
The equivalent width of H is -4Å, therefore it is a NTTS/WTTS
(see Table 2).
KWW 1892 XRS 2 HBC 553
Figure 5a shows two spectra of KWW 1892 (XRS 2; M1 – M2),
obtained on consecutive nights. This object, also known as HBC 553
(Pettersson, 1987; Herbig & Bell, 1988) has the strongest H emission line
(-30Å) in our sample. The H emission line profile
shows changes on the second night, while the absorption line profiles do not.
The FWHM of H line varied from 4 – 5Å (night 1) to 3Å (night 2).
Based on , this is the only classical T Tauri star in our sample.
KWW 1637 XRS 6
Li I 6708Å, Ca I 6717Å, and other Fe I lines all are
doubled, strongly indicating that it is a double-lined spectroscopic
PMS binary system which has 0.8 – 1Å separation (40 – 45 km s-1) at
this epoch. The X-ray emission was strong and variable.
KWW 873 XRS 7
Although is less than 10Å, the line profile, with a
blue shifted absorption reversal, implies a strong wind in this system.
KWW 975 HBC 554
The spectrum of KWW 975 (HBC 554) in Figure 5b
shows asymmetric H and Li I line profiles. The H line profile has dips
(stronger on the redshifted side), which could indicate accretion or
infalling gas in the system. Background sky emission subtraction affects only
the narrower component, and not the broader line profile. Herbig & Bell (1988)
identified HBC 554 as a visual binary system, and classified the spectral
type of this star as M 1.5, which is consistent with our spectral type
estimate (M 2).
KWW 1953
The Li I 6708Å line and Fe I lines show asymmetric and broad line profiles.
KWW 1953 may be a rapidly rotating star, or a unresolved double line binary
system.
KWW 1055 XRS 10
The H line is in absorption (Figure 5d).
The Li line equivalent width is consistent with no Li depletion.
Although appear on the lower locus, and hence at a greater distance,
the radial velocity is marginally consistent with that of the CG 30/31/38
complex.
XRS 9
XRS 9 is a fast rotator. It is not a H emission source, but shows a marginal
Li I line (Figure 5d).
All the absorption lines are broadened, most likely due to rotation.
All the lines, including the metal lines Fe I and Ca I, show flat bottoms
which may suggest a spot on its surface.
The radial velocity is inconsistent with those of the
of CGs and associated PMS stars. It is likely a young star in the
background.
KWW 314
The double-peaked H emission arising from a broad
H absorption line is typical of a Ae/Be star (and not necessarily of a
young object). A low dispersion spectrum confirms that this is an
A3 (2) star with EB-V = 0.90.2 mag. Av is 3 mag,
(see tables 3 and 4), and thus
12mag. The distance modulus is then magnitude
(1.2 kpc). The radial velocity ( = -15.11 km s-1) is
inconsistent with that of the CGs and PMS stars. This is therefore likely
a background star unrelated to the CG 30/31/38 complex.
KWW 1125
This is a young double-lined spectroscopic binary system with undepleted Li
abundances. The spectrum (Figure 5d) shows broad and double
peaked H and Li I absorption lines. Fe I and Ca I lines also seem to have
double lines. The two components are 4Å (180 km s-1) apart
at the epoch of observation; this is likely to be a short period system
with a period of a few days. The redshifted component has 50% of
the line strength of the blueshifted component in H , but the Li I strengths
of both components are similar.
At this epoch the radial velocities are -65.6 km s-1 for
the blue shifted component and 152.6 km s-1 for the redshifted component.
Since only one epoch was observed, we have no information on the
systemic velocity or the mass ratio.
References
- Alves et al. (1997) Alves, J., Hartmann, L., Briceno, C., & Lada, C. J. 1997, AJ, 113, 1395
- Bally et al. (1998) Bally, J., Yu, K. C., Rayner, J. & Zinnecker, H. 1998, AJ, 116, 1868
- Bally et al. (2001) Bally, J., Johnstone, D., Joncas, G., Reipurth, B., & Mallen-Ornelas, G. 2001, AJ, 122, 1508
- Bareffe et al. (1998) Baraffe, I., Chabrier, G., Allard, F., & Hauschildt, P. H. 1998, A&A, 337, 403
- Basri et al. (1991) Basri, G., Martin, E. L., Bertout, C. 1991, A&A, 252, 625
- Bertoldi & McKee (1990) Bertoldi, F. M., & McKee, C. 1990, ApJ, 354, 529
- Bok & Reilly (1947) Bok, B. J., & Reilly, E. F. 1947, ApJ, 105, 255
- Bok (1977) Bok, B. J. 1977, PASP, 89, 597
- Boss (1995) Boss, A.P. 1995, ApJ, 439, 224
- Brandt et al. (1971) Brandt, J. C., Stecher, T. P., Crawford, D. L., & Maran, S. P. 1971, ApJ, 163, 99 1997, in Astrophysical Implications of the Laboratory Study of Presolar Materials, ed. Bernatowicz, T. J., & Zinner, E. Woodbury, N.Y.: American Institute of Physics, 1997., 665
- Chanot & Sivan (1983) Chanot, A., & Sivan, J. P. 1983, A&A, 121, 19
- Clemens & Barvainis (1988) Clemens, D. P. & Barvainis, R. 1988, ApJS, 68, 257
- de Zeeuw et al. (1999) de Zeeuw, P. T., Hoogerwerf, R., de Bruijne, J. H. J., Brown, A. G. A., & Blaauw, A. 1999, AJ, 117, 354
- Duncan (1991) Duncan, D. K. 1991, ApJ, 373, 250
- Elias et al. (1982) Elias, J. H., Frogel, J. A., Matthews, K., Neugebauer, G. 1982, AJ, 87, 1029
- Elmegreen (1998) Elmegreen, B. G. 1998, in ASP Conf. Ser. 148, Origins of Galaxies, Stars, Planets and Life, ed. Woodward, C. E., Thronson, H. A., & M. Shull (San Francisco: ASP), 150
- Feigelson et al. (2002) Feigelson, E. D. et al. 2002, ApJ, 574, 258
- Flaccomio et al. (2003a) Flaccomio, E. et al. 2003a, ApJ, 582, 398
- Flaccomio et al. (2003b) Flaccomio, E., Micela, G., & Sciortino, S. 2003b, A&A, 402, 277
- Frerking & Langer (1982) Frerking, M. A., & Langer, W. D. 1982, ApJ, 256, 523
- Fukuda et al. (2000) Fukuda, N., & Hanawa T. 2000, ApJ, 533, 911 & Van Buren, D. 2001, PASP, 113, 1326
- Gum (1952) Gum, C. S. 1952, Observatory, 72, 151
- Gum (1955) Gum, C. S. 1955, MemRAS, 67, 155
- Haisch (2001) Haisch Jr., K. E., Lada, E. A., & Lada, C. J. 2001, ApJ, 553, L153
- Hawarden & Brand (1976) Hawarden, T.G., & Brand, P.W.J.L. 1976, MNRAS, 175, 19
- Henning & Launhardt (1998) Henning Th., & Launhardt R., 1998, A&A 338, 223
- Herbig & Bell (1988) Herbig, G. H., & Bell, K. R. 1988, Lick Obs. Bull. 1111
- Hester et al. (1996) Hester, J. J., et al. 1996, AJ, 111, 2349 Merrill, K. M.,Gatley, I., Makidon, R. B., Meyer, M. R., & Skrutskie, M. F. 1998, AJ, 116, 1816
- Hillenbrand (2003) Hillenbrand, L.A. 2003, Origins 2002: The Heavy Element Trail from Galaxies to Habitable Worlds, eds. Woodward, C.E., & Smith, E.P., (ASP Conf. Ser.), astro-ph/0210520 A&A, 302, 861
- Hoogerwerf et al. (2001) Hoogerwerf, R., de Bruijne, J. H. J., & de Zeeuw, P. T. 2001, A&A, 365, 49
- Keene et al. (1983) Keene, J., Davidson, J. A., Harper, D. A., Hildebrand, R. H., Jaffe, D. T., Loewenstein, R. F., Low, F. J., & Pernic, R. 1983, ApJ, 274, 43
- Kenyon & Harmann (1995) Kenyon, S. J., & Hartmann, L. 1995, ApJS, 101, 117
- Khanzadyan et al. (2002) Khanzadyan, T., Smith, M. D., Gredel, R., Stanke, T., & Davis, C. J. 2002, A&A, 383, 502
- Kim (2002) Kim, J. S. 2002, Ph.D. thesis, State University of New York, Stony Brook, NY
- Kim et al. (2003) Kim, J. S., Walter, F. M., & Wolk, S. J. 2003, In Galactic Star Formation Across the Stellar Mass Spectrum, ASP Conference Series, Vol. 287, proceedings of the 2002 International Astronomical Observatories in Chile workshop, held 11-15 March 2002 at La Serena, Chile. Edited by James M. De Buizer and Nicole S. van der Bliek. San Francisco: Astronomical Society of the Pacific, ISBN: 1-58381-130-3, 2003, p. 275
- King (1993) King, J. R. 1993, AJ, 105, 1087
- Knude et al. (1999) Knude, J., Jønch-Sørensen, H., & Nielsen, A. S. 1999, A&A, 350, 985
- Knude & Nielsen (2000) Knude, J., & Nielsen, A. S. 2000, A&A, 362, 1138
- Landolt (1992) Landolt, A. U. 1992, AJ, 104, 340
- Lang (1980) Lang, K.R. 1980, Astrophysical Formulae, Springer-Verlag Berlin Heidelberg New York
- Lefloch & Lazaref (1994) Lefloch, B., & Lazareff, B. 1994, A&A, 289, 559
- Lefloch & Lazaref (1995) Lefloch, B., & Lazareff, B. 1995, A&A, 301, 522
- Lefloch et al. (1997) Lefloch, B., Lazareff, B., & Castets, A. 1997, A&A, 324, 249
- Leggett et al. (2001) Leggett. S. K., et al. 2001, ApJ, 548, 908
- Luhman (1999) Luhman, K. 1999, ApJ, 525, 466 2001, LPI, 32, 1041
- Martín et al. (1994) Martín, E.L., Rebolo, R., Magazzu, A., & Pavlenko, Ya. V. 1994, A&A, 282, 503
- Mayor & Mermilliod (1984) Mayor, M. & Mermilliod, J. C. 1984, IAUS, 105, 411
- Megeath et al. (1996) Megeath, S. T., Cox, P., Bronfman, L., & Roelfsema, P. R. 1996, A&A, 305, 296
- Meyer et al. (1997) Meyer, M.R., Calvet, N., & Hillenbrand, L.A. 1997, AJ, 114, 288
- Mink (1999) Mink, D. J. 1999 in Astronomical Data Analysis Software and Systems VIII, ASP Conference Series, Vol. 172. Ed. David M. Mehringer, Raymond L. Plante, and Douglas A. Roberts. ISBN: 1-886733-94-5 (1999), p. 498
- Monet et al. (1998) Monet, D., Bird A., Canzian, B., et al. 1998, The USNO-A2.0 Catalogue, (U.S. Naval Observatory, Washington DC)
- Montmerle et al. (1983) Montmerle, T., Koch-Miramond, L., Falgarone, E., & Grindlay, J. 1983, ApJ, 269, 182.
- Nielsen et al. (1998) Nielsen, A. S., Olberg, M., & Booth, R. S. 1998, A&A, 336, 329
- Nielsen et al. (2000) Nielsen, A. S., Jønch-Sørensen, H., & Knude, J. 2000, A&A, 358, 1077
- O’Dell et al. (1993) O’Dell, C.R., Wen, Z., & Hu., X. 1993, ApJ, 410, 996
- Oort & Spitzer (1955) Oort, J.H., & Spitzer, Jr. L. 1955, ApJ, 121, 6
- Pavlenko & Magazzu (1996) Pavlenko, Y.V., & Magazzu, A. 1996, A&A, 311, 961
- Pettersson (1984) Pettersson, B. 1984, A&A, 139, 135
- Pettersson (1987) Pettersson, B. 1987, A&A, 171, 101
- Pettersson & Reipurth (1994) Pettersson, B., & Reipurth B. 1994, A&AS, 104, 233
- Pozzo et al. (2000) Pozzo, M., Jeffries, R.D., Naylor, T., Totten, E.J., Harmer, S., & Kenyon M. 2000, MNRAS 313, 2310
- Rao and Lambert (1993) Rao, K. N., & Lambert, D. L. 1993, AJ, 105, 1915
- Reipurth (1983) Reipurth, B. 1983, A&A, 117, 183
- Reipurth & Zinnecker (1993) Reipurth, B., & Zinnecker, H. 1993, A&A, 278, 81
- Reipurth et al. (2000) Reipurth, B., Yu, K. C., Heathcote, S., Bally, J., & Rodr´guez, L. F. 2000, AJ, 120, 1449
- Reynolds (1976a) Reynolds, R.J. 1976a, ApJ, 203, 151
- Reynolds (1976b) Reynolds, R.J. 1976b, ApJ, 206, 679 Lewis, R. S., & Grossman, L. 1998, Nature, 391, 559S
- Sahu (1992) Sahu, M., 1992, Ph.D. Thesis, Groningen Univ.
- Sahu & Sahu (1993) Sahu, M., & Sahu, K.C. 1993, A&A, 280, 231
- Sandqvist (1976) Sandqvist, A. 1976, MNRAS, 177, 69
- Schwartz (1977) Schwartz, R.D. 1977, ApJ, 212, L25
- Schwartz et al. (1990) Schwartz, R. D., Persson, S. E., & Hamann, F. W. 1990, AJ, 100, 793
- Sherry et al. (2004) Sherry, W.H., Walter, F.M., & Wolk, S.J. 2004, to be published in AJ, astro-ph/0410244
- Sridharan (1992) Sridharan, T.K. 1992, JA&A, 13, 217
- Strom et al. (1989) Strom, K.M., Wilkin, F.P., Strom, S.E., & Seaman, R. L. 1989, AJ, 98, 1444
- Sugitani et al. (1986) Sugitani, K., Fukui, Y., Ogawa, H., & Kawabata, K. 1986, ApJ, 303, 667
- Sugitani et al. (1995) Sugitani, K., Tamura, M., & Ogura, K. 1995, ApJ, 455, 39
-
SAO (1997)
U.S. ROSAT science data center/SAO 1997,
http://hea-www.harvard.edu/
rosat/rsdc_www/HRI_CAL_REPORT/hri.html - Vanhala at al. (1996) Vanhala, H., Cameron, A.G.W., & Hoflich, P. 1996, LPI, 27, 1357
- Ventura & Zappieri (1998) Ventura, P. & Zappieri, A. 1998, A&A, 340, 77
- Walter et al. (1988) Walter F.M., Brown, A., Mathieu, R.D., Myers, P. C., & Vrba, F. J. 1988, AJ, 96, 297
- Walter et al. (1994) Walter F.M., Vrba, F.J., Mathieu, R.D., Brown, A., & Myers, P.C. 1994, AJ, 107, 692 & Schmitt, J. H. M. M. 1997a, MmSAI, 68, 1081
- Walter et al. (1997) Walter, F.M., Vrba, F.J., Wolk, S.J., Mathieu, R.D., Neuhauser, R. 1997, AJ, 114, 1544
- Walter (2000) Walter, F.M. 2000, http://sbast3.ess.sunysb.edu/fwalter/CIRIM/cirim.html
- Wolk & Walter (1998) Wolk, S.J., & Walter, F.M. 1997, in Cool Stars, Stellar Systems, and the Sun 10th, eds. R. Donahue & J. Bookbinder (ASP: San Francisco), 1800
- Zealey et al. (1983) Zealey, W. J., Ninkov, Z., Rice, E., Hartley, M., & Tritton, S. B. 1983, ApJ, 23, 119
| XRS # | (2000.0) | (2000.0) | aaX-ray - optical position offset in RA | bbX-ray - optical position offset in DEC | DCccDetect cell size in arcsec | CRddNet count rate within the 90% encircled energy radius | neteeNet source counts (above background) within the 90% encircled energy radius | SNRffsignal-to-noise ratio within the detect cell | |||
|---|---|---|---|---|---|---|---|---|---|---|---|
| h : m : s | s | : : | s | cts s-1 | cts | ||||||
| 1 | 0.5 | 4.2 | 0.87 | 16.82 | 24 | 0.00756 | 0.00106 | 107 | 3.4 | ||
| 2 | 0.5 | 4.2 | 0.65 | 9.58 | 24 | 0.00108 | 0.00051 | 18 | 3.2 | ||
| 3 | 0.2 | 1.9 | 0.19 | 3.58 | 12 | 0.00102 | 0.00041 | 17 | 3.6 | ||
| 4 | 0.1 | 0.6 | 0.02 | 1.55 | 12 | 0.02042 | 0.00112 | 360 | 15.9 | ||
| 5 | 0.6 | 4.6 | 0.17 | 4.33 | 24 | 0.00138 | 0.00073 | 21 | 3.2 | ||
| 6 | 0.1 | 0.6 | 0.29 | 3.40 | 12 | 0.01937 | 0.00109 | 340 | 15.3 | ||
| 7 | 0.2 | 1.3 | 0.20 | 2.14 | 12 | 0.00232 | 0.00046 | 41 | 5.8 | ||
| 8 | 0.6 | 4.5 | 0.22 | 11.56 | 24 | 0.00111 | 0.00038 | 14 | 3.0 | ||
| 9 | 0.2 | 1.2 | 0.02 | 3.12 | 12 | 0.02126 | 0.00149 | 300 | 7.7 | ||
| 10 | 0.3 | 2.5 | 0.39 | 0.71 | 12 | 0.00085 | 0.00035 | 16 | 3.2 | ||
| 11 | 0.2 | 1.9 | 0.05 | 3.67 | 12 | 0.00120 | 0.00038 | 22 | 3.6 | ||
| 12 | 0.3 | 2.4 | 0.09 | 0.90 | 12ggNot detected in the 24 arcsec detection cell | 0.00064 | 0.00036 | 11 | 3.0 | ||
| 13 | 0.2 | 1.8 | 0.05 | 2.30 | 12 | 0.00343 | 0.00055 | 60 | 4.7 | ||
Note. — Values are taken from the Standard Analysis Software System (SASS) output. Note that the uncertainty on the count rate does not directly translate to a Signal to Noise (S/N) ratio: the former corresponds to a larger radius containing 90% of the encircled energy. The significance of the count rate of the weak sources is decreased because background noise dominates.
| KWW# | XRS# | Sp. | (2000.0) | (2000.0) | Wλ(H ) | Wλ(Li I) | aaThe errors were determined by measuring Wλ(Li I) multiple (10) times. | logN(Li)bbLithium abundance for both LTE and NLTE model (NLTE from Pavlenko & Magazzu 1996; LTE from Duncan 1991) | AV | (AV) ccThe uncertainty in AV value is mainly introduced by the uncertainty of spectral type determination (0.5 – 1 subtype for K and M stars, 1 for G type and earlier). | log() | VLSR | Note |
|---|---|---|---|---|---|---|---|---|---|---|---|---|---|
| h : m : s | ° : ′ : ″ | Å | Å | (NLTE/LTE) | mag | km s-1 | |||||||
| 464 | 1 | M3V | 08:08:00.667 | -35:57:33.68 | -2.8 | 0.67 | 0.02 | 2.70/3.31 | 0.2 | 0.2 | 0.0186 | 6.69 | |
| 1892 | 2 | M1V | 08:08:22.153 | -36:03:47.08 | -26.6 | 0.54 | 0.04 | 2.54/3.08 | 0.3 | 0.3 | 0.0028 | 4.87 | night 1, HBC 553ddPettersson (1987), Herbig & Bell (1988) |
| -31.3 | 0.70 | 0.05 | 3.01/3.35 | – | – | night 2 | |||||||
| 598 | 3 | M2V | 08:08:37.586 | -36:09:50.48 | -11.5 | 0.70 | 0.04 | 2.83/3.35 | 0.3 | 0.3 | 0.0147 | 4.21 | |
| 1863 | 4 | M1V | 08:08:37.824 | -36:03:55.25 | -2.8 | 0.74 | 0.03 | 3.08/3.41 | 0.4 | 0.2 | 0.0335 | 8.92 | |
| 1637 | 6 | K6V | 08:08:39.286 | -36:05:01.90 | -2.4 | 0.63 | 0.01 | 3.65/3.41 | 0.1 | 0.1 | 0.0061 | 5.51 | SB2 |
| 873 | 7 | K7V | 08:08:45.403 | -36:08:40.24 | -7.9 | 0.68 | 0.02 | 3.57/3.37 | 0.6 | 0.2 | 0.0028 | 4.95 | P Cyg profile in H |
| 1043 | 8 | M3V | 08:08:46.821 | -36:07:52.76 | – | – | – | – | 0.8 | 0.2 | 0.0019 | – | HBC 555ddPettersson (1987), Herbig & Bell (1988) |
| 975 | – | M2V | 08:08:33.870 | -36:08:09.82 | -8.43 | 0.50 | 0.06 | 2.19/3.00 | 1.3 | 0.2 | – | 6.30 | Visual binary, HBC 554ddPettersson (1987), Herbig & Bell (1988) |
| 1302 | – | M4V | 08:09:51.778 | -36:23:02.87 | -8.23 | – | – | – | 0.7 | 0.4 | – | – | |
| 1953 | – | M3V | 08:08:26.929 | -36:03:35.45 | -4.24 | 0.56 | 0.03 | 2.39/3.12 | 0.5 | 0.3 | – | 7.20 | night 1, |
| – | -4.93 | 0.70 | 0.04 | 2.77/3.35 | – | – | – | night 2 | |||||
| 2205 | – | M4V | 08:08:14.872 | -36:02:09.46 | -4.34 | 0.62 | 0.04 | 2.58/3.23 | 0.3 | 0.3 | – | 8.03 | |
| – | 9 | G5V | 08:09:02.9 | -35:51:28.6 | 3.23 | 0.14 | 0.02 | 2.89/2.86 | – | – | – | -91.35 | Rapid rotator |
| 1055 | 10 | G2V–K0V | 08:09:13.493 | -36:10:29.71 | 2.17 | 0.27 | 0.02 | 3.74/4.00 | 1.0 | 0.2 | 0.0031 | 2.74 | |
| 314 | – | A3e | 08:09:52.001 | -36:00:36.92 | 6.2 | – | – | – | 3 | – | – | -15.11 | Ae star |
| -1.58 | – | – | – | – | |||||||||
| 1125 | – | F8V | 08:09:15.140 | -36:09:14.22 | 5.75 | 0.32 | 0.02 | 3.87/4.00 | 0.12 | 0.12 | – | 152.60 | SB2eefootnotemark: |
| 1333 | – | F8V | 08:08:34.749 | -36:06:40.90 | 5.23 | 0.12 | 0.02 | 3.05/3.00 | 0.16 | 0.16 | – | 19.08 | |
| 1806 | – | F8V | 08:09:33.525 | -36:13:09.14 | 0.81 | 0.13 | 0.02 | 3.09/3.00 | 0.08 | 0.08 | – | -10.70 |
Note. — The spectral types and equivalent widths of H 6563Å and Li I 6708Å for PMS stars are presented. Note that XRS 9, KWW 1055, KWW 1125, KWW 1333, and KWW 1806 are more likely 50 – 100 Myr old field stars with strong magnetic activity.
| ID | ||||||||||
|---|---|---|---|---|---|---|---|---|---|---|
| KWW 464 | - | - | 1.52 | 0.04 | 15.82 | 0.03 | 1.14 | 0.04 | 1.22 | 0.05 |
| KWW 1892 | 1.04 | 0.03 | 1.42 | 0.03 | 15.17 | 0.02 | 1.12 | 0.03 | 1.23 | 0.02 |
| KWW 598 | 0.81 | 0.08 | 1.35 | 0.04 | 17.27 | 0.02 | 1.45 | 0.03 | 1.77 | 0.02 |
| KWW 1863 | -0.29 | 0.47 | 3.01 | 0.34 | 14.65 | 0.01 | 1.10 | 0.02 | 1.22 | 0.03 |
| KWW 1637 | 1.05 | 0.02 | 1.20 | 0.02 | 12.15 | 0.01 | 0.92 | 0.02 | 0.66 | 0.03 |
| KWW 873 | 0.99 | 0.02 | 1.35 | 0.02 | 13.81 | 0.01 | 0.92 | 0.02 | 0.90 | 0.02 |
| KWW 1043 | 0.36 | 0.04 | 1.31 | 0.03 | 16.61 | 0.02 | 1.25 | 0.03 | 1.55 | 0.06 |
| KWW 1055 | 0.41 | 0.02 | 0.96 | 0.01 | 14.40 | 0.01 | 0.58 | 0.02 | 0.63 | 0.03 |
| KWW 975 | -0.10 | 0.03 | 1.15 | 0.02 | 15.56 | 0.01 | 1.12 | 0.02 | 1.35 | 0.03 |
| KWW 314 | - | - | 1.11 | 0.01 | 15.14 | 0.00 | 0.73 | 0.00 | 0.77 | 0.00 |
| KWW 1806 | 0.71 | 0.02 | 0.94 | 0.01 | 13.99 | 0.01 | 0.68 | 0.22 | 0.43 | 0.06 |
| KWW 1125 | -0.01 | 0.02 | 0.47 | 0.02 | 12.35 | 0.01 | 0.30 | 0.02 | 0.37 | 0.02 |
| KWW 1302 | - | - | 1.39 | 0.01 | 15.76 | 0.00 | 1.20 | 0.00 | 1.42 | 0.00 |
| KWW 1333 | 0.24 | 0.02 | 0.65 | 0.01 | 13.64 | 0.01 | 0.47 | 0.02 | 0.44 | 0.02 |
| KWW 1953 | 1.05 | 0.03 | 1.37 | 0.03 | 15.58 | 0.02 | 1.21 | 0.02 | 1.42 | 0.02 |
| KWW 2205 | 0.49 | 0.49 | 2.38 | 0.35 | 16.20 | 0.02 | 1.25 | 0.02 | 1.40 | 0.17 |
| ID | ||||||||||||
|---|---|---|---|---|---|---|---|---|---|---|---|---|
| KWW 464 | 11.237 | 0.040 | 0.907 | 0.042 | 0.206 | 0.048 | 12.126 | 0.024 | 11.392 | 0.026 | 11.173 | 0.026 |
| KWW 1892 | 10.416 | 0.040 | 1.027 | 0.042 | 0.313 | 0.048 | 11.402 | 0.023 | 10.663 | 0.023 | 10.323 | 0.021 |
| KWW 598 | 11.232 | 0.040 | 0.815 | 0.042 | 0.267 | 0.048 | 12.150 | 0.024 | 11.519 | 0.023 | 11.281 | 0.023 |
| KWW 1863 | 9.876 | 0.040 | 0.999 | 0.042 | 0.281 | 0.048 | 10.873 | 0.028 | 10.194 | 0.033 | 9.940 | 0.024 |
| KWW 1637 | 8.650 | 0.040 | 0.877 | 0.041 | 0.241 | 0.048 | 9.529 | 0.023 | 8.880 | 0.022 | 8.708 | 0.024 |
| KWW 873 | 9.609 | 0.040 | 1.066 | 0.042 | 0.311 | 0.048 | 10.676 | 0.023 | 9.947 | 0.023 | 9.578 | 0.023 |
| KWW 1043 | 10.854 | 0.040 | 1.115 | 0.042 | 0.409 | 0.048 | 11.925 | 0.028 | 11.135 | 0.025 | 10.628 | 0.024 |
| XRS 9 | 9.383 | 0.040 | 0.396 | 0.042 | 0.068 | 0.048 | 9.783 | 0.021 | 9.464 | 0.022 | 9.346 | 0.023 |
| KWW 1055 | 11.850 | 0.041 | 0.561 | 0.043 | 0.136 | 0.048 | 12.424 | 0.026 | 12.028 | 0.025 | 11.890 | 0.023 |
| KWW 975a | 10.312 | 0.025 | 1.087 | 0.033 | 0.342 | 0.041 | 11.387 | 0.022 | 10.640 | 0.025 | 10.299 | 0.023 |
| KWW 314a | 11.937 | 0.028 | 0.592 | 0.038 | 0.230 | 0.039 | 12.546 | 0.024 | 12.155 | 0.023 | 11.931 | 0.026 |
| KWW 1125 | 11.055 | 0.040 | 0.266 | 0.042 | 0.061 | 0.048 | 11.285 | 0.023 | 11.085 | 0.023 | 11.015 | 0.023 |
| KWW 1302a | 10.421 | 0.027 | 1.080 | 0.040 | 0.332 | 0.040 | 11.500 | 0.032 | 10.761 | 0.036 | 10.429 | 0.023 |
| KWW 1806a | 11.681 | 0.028 | 0.458 | 0.040 | 0.014 | 0.037 | 12.262 | 0.028 | 11.820 | 0.031 | 11.678 | 0.027 |
| KWW 1333a | 11.671 | 0.029 | 0.257 | 0.042 | 0.117 | 0.045 | 12.074 | 0.024 | 11.788 | 0.027 | 11.694 | 0.026 |
| KWW 1953 | 10.571 | 0.040 | 0.883 | 0.042 | 0.215 | 0.048 | 11.438 | 0.023 | 10.722 | 0.022 | 10.510 | 0.023 |
| KWW 2205 | 10.923 | 0.041 | 0.871 | 0.043 | 0.241 | 0.048 | 11.780 | 0.023 | 11.122 | 0.022 | 10.840 | 0.021 |
: data from the 2MASS All-Sky Release Point Source Catalog.