Abstract
To make direct comparisons in the rest-far-ultraviolet between LBGs at and more local star-forming galaxies, we use HST/STIS to image a set of 12 nearby () H II galaxies in the FUV and a set of 14 luminous compact blue galaxies (LCBGs) at moderate redshift () in the NUV, corresponding to the rest-FUV. We then subject both sets of galaxy images and those of LBGs at to the same morphological and structural analysis. We find many qualitative and quantitative similarities between the rest-FUV characteristics of distant LBGs and of the more nearby starburst samples, including general morphologies, sizes, asymmetries, and concentrations. Along with some kinematic similarities, this implies that nearby H II galaxies and LCBGs may be reasonable local analogs of distant Lyman break galaxies.
Are there local analogs of Lyman break galaxies?
1 Lyman break galaxies
Lyman break galaxies (LBGs) at redshifts are the current gold standard for star-forming galaxies in the early universe, at least rest-UV and -optically selected ones. Many of their properties are revealed by deep multi-wavelength imaging and spectroscopic surveys (e.g., presentations at this conference by Bremmer, Erb, Huang, Mehlert, Papovich, Sawicki, and others). These include small sizes kpc, high luminosities , significant clustering, and diverse morphologies. LBGs are also copiously star-forming, easily qualifying as starbursts according to the star formation intensity (SFR per unit mass or gas mass) definition advocated by Tim Heckman at this conference (e.g., Meurer et al. 1997).
Significant questions remaining about the nature of LBGs include their masses, their mass assembly histories, their fate, and their environments, including any dark matter. Comparison to local galaxies with similar properties may help illuminate some or all of those issues, since nearby systems can generally be studied in much greater detail.
2 Compact starbursts at in the Rest-UV
We face two problems in attempting to draw parallels between distant LBGs and nearby starbursts: (1) LBGs are best seen in the optical, corresponding at to the rest-UV; and (2) it is not obvious which kind or kinds of local systems are the best proxies.
Two classes of galaxy at seem especially promising as nearby cousins of LBGs: H IIgalaxies at and luminous compact blue galaxies (LCBGs) at . Both classes show, in the optical, the small sizes, high luminosities, diverse morphologies, and copious star formation that also characterize LBGs. To push the comparison further, we have obtained rest-UV images with the Space Telescope Imaging Spectrograph onboard Hubble Space Telescope (HST/STIS) of 12 H II galaxies and 14 LCBGs. The samples are drawn from the UCM survey (Perez-Gonzalez et al. 2001) and the Kitt Peak Galaxy Redshift Survey (Munn 1997), respectively. Many have also been imaged with HST/WFPC2 and/or NICMOS and/or studied spectroscopically at Keck and Arecibo (e.g. Pisano et al. 2001).
3 Rest-UV Morphologies
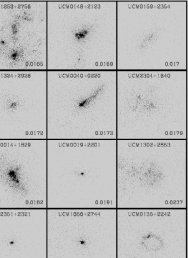
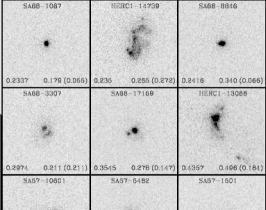
The HST/STIS UV images of the 26 low- and intermediate-redshift starburst galaxies in our sample are shown in Fig. 1. It is immediately obvious that the rest-UV morphologies represent a diverse panoply, rather than a uniform class. Multiple knots, tails, and extended emission – almost all invisible at ground-based resolution in the optical – are the rule rather than the exception.
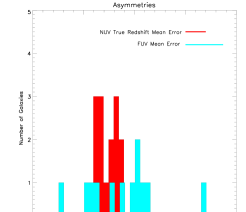
We attempted to quantify the UV morphologies of our nearby and intermediate compact starbursts using the CAS (compactness, asymmetry, and clumpiness) methodology of Conselice et al. (2003). The measured asymmetry is very sensitive to the exact radius at which it is measured; we tried both half-light radii and Petrosian radii. Fig. 2 shows the distribution of asymmetries . We find that the mean of our two samples is roughly consistent with that of LBGs measured in the HDF by Conselice et al. (2003), although the formal measurement uncertainties are very large.
4 Simulating LBGs at
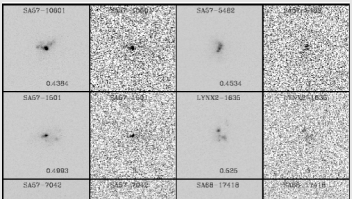
What would the H II galaxies and LCBGs look like if placed at redshift ? We simulated that view by resampling our HST/STIS images and adding noise to reproduce the Hubble Deep Field sensitivity. The H II galaxies are too faint to detect, but the LCBGs, which are more luminous, are all easily detected (Fig. 3). Despite the loss of low-surface brightness features, the similarities to the appearances of real LBGs are striking.
We conclude that H II galaxy and LCBG morphologies, like their sizes, colors, and star-formation rates and intensities, are qualitatively and quantitatively similar to those of LBGs. They are therefore reasonable local testbeds for further comparative study of LBGs, including constraints on mass.
Our future plans include applying other morphological measures such as the Gini coefficient (Lotz et al. 2004) and combining these STIS UV images with WFPC2 and NICMOS images in hand to constrain stellar populations, dust content, and merger scenarios.
¡widest bib entry¿
References
- [1] Conselice, C.J., Bershady, M.A., Dickinson, M. & Papovich, C. 2003, ApJ, 136, 1183
- [2] Koo, D.C., Guzman, R. Faber, S.M., Illingworth, G.D., Bershady, M.A., Kron, R.G., & Takamiya, M. 1995 ApJL, 440, 49
- [3] Guzman, R., Jangren, A. Koo, D.C. Bershady, M.A., & Simard, L. 1998, ApJL, 495, 13
- [4] Lotz, J. M., Primack, J., & Madau, P. 2004, AJ, 128, 163
- [5] Meurer, G., Heckman, T., Lehnert, M., Leitherer, C. & Lowenthal, J.D. 1997, AJ, 114, 54.
- [6] Munn, J.A., Koo, D.C., Kron, R.G., Majewski, S.R., Bershady, M.A., & Smetanka, J.J. 1997, ApJS, 109, 45
- [7] Perez-Gonzalez, P.G., Gallego, J., Zamorano, J., & Gil de Paz, A. 2001, A&A, 365, 370
- [8] Pisano, D. J., Kobulnicky, H. A., Guzman, R., Gallego, J., & Bershady, M.A. 2001, AJ, 122 1194