Dynamical and Spectral Modeling of the Ionized Gas and Nuclear Environment in NGC 3783
Abstract
We present a new approach for calculating the physical properties of highly ionized X-ray flows in active galactic nuclei (AGN). Our method relies on a detailed treatment of the structure, dynamics and spectrum of the gas. A quantitative comparison of our model predictions with the 900 ksec Chandra/HETG X-ray spectrum of NGC 3783 shows that: (1) The highly ionized outflow is driven by thermal pressure gradients and radiation pressure force is less important. (2) A full featured dynamical model that provides a very good fit to the high resolution X-ray spectrum requires a multi-phased flow with a density power spectrum reminiscent of the interstellar medium. (3) Adiabatic cooling is an important factor and so is an additional heating source that may be related to the apparent multi-phase and turbulent nature of the flow. (4) The base of the flow is pc from the central object, in agreement with some, but not all previous estimates. (5) The mass loss rate is in the range which is smaller than previous estimates and of the same order of the mass accretion rate in this object.
Subject headings:
acceleration of particles — ISM: jets and outflows — galaxies: Seyfert — quasars: absorption lines — X-rays: individual (NGC 3783)1. introduction
Highly ionized gas (HIG) in active galactic nuclei (AGN), also known as “warm absorber”, was first detected in the early 1980s (Halpern 1984) and was observationally and theoretically investigated in hundreds of papers (see e.g., Netzer et al. 2003, hereafter N03, and references therein). This component is believed to be photoionized by the central X-ray continuum source and is observed in some 50% of all type-I (broad line) AGN (e.g., George et al. 1998, 2000, Porquet, Reeves, O’Brien, & Brinkmann 2004). The poor resolution of the pre-Chandra & XMM instruments did not allow full investigation of the HIG properties and its possible relation to the UV outflowing gas (e.g., Crenshaw et al. 1999). The launch of Chandra & XMM allowed an in-depth analysis of the spectral properties of this gas component (e.g., Kaastra et al. 2000, Kaspi et al. 2000, Branduardi-Raymont et al. 2001, Lee et al. 2001, Steenbrugge et al. 2005). X-ray absorption lines were detected in several sources and found to be blueshifted by a few relative to the systemic velocity (though much higher velocities have also been reported, e.g., Chartas et al. 2002).
Detailed photoionization modeling of several AGN show outflows with a stratified density and temperature structure. Such models are partly phenomenological since they do not self-consistently account for the flow dynamics. Specifically, such models cannot be used to predict the velocity and deduce dynamically related quantities such as the mass loss rate. This information is crucial for understanding the effect of AGN flows on their environment (e.g., King 2003, Scannapieco & Oh 2004). A more complete approach requires full, self-consistent dynamical, photoionization, and spectral modeling of the flows. Today there are only a few qualitative works of this type (e.g., Arav, Li, & Begelman 1994, Murray et al. 1995, Chelouche & Netzer 2003a,b).
This paper introduces a novel approach for investigating the properties of highly ionized flows. It utilizes the entire spectral information and employs state-of-the-art photoionization, dynamical, and spectral calculations. We apply this method to the X-ray flow in NGC 3783 and compare our model predictions to the 900 ksec Chandra/HETG spectrum of this source (e.g., Kaspi et al. 2002). The paper is organized as follows: In §2 we summarize the properties of NGC 3783 and its outflow. In §3 we use general arguments to distinguish between several plausible dynamical models. Section 4 outlines the new formalism and §5 presents the self-consistent solution and shows a detailed comparison with the X-ray spectrum of NGC 3783. We elaborate on the implications of our results in §6 and summarize the work in §7.
2. The highly ionized gas in NGC 3783
NGC 3783 is a Seyfert 1 galaxy that has been studied, extensively, in almost all spectral bands. It has been the focus of a large UV and X-ray campaign with several already published papers (Kaspi et al. 2001, 2002, Behar et al. 2003, Gabel et al. 2003a,b, Krongold et al. 2003, N03). While certainly the best studied AGN in the X-ray band, NGC 3783 is by no means unique and its low resolution ASCA spectrum resembles that of other AGN exhibiting warm absorption features (e.g., George et al. 1998).
The bolometric luminosity of NGC 3783, , can be estimated from its 2-10 keV X-ray flux reported by Kaspi et al. (2002) and the spectral energy distribution (SED) presented in N03. This results in which we assume to be the long-term average luminosity of the source. The mass of the black hole, , has been estimated from reverberation mapping to be and the size of the broad line region (BLR) (Peterson et al. 2004; see however Kaspi et al. 2000 for lower values). Assuming solar composition for the gas we define the Eddington ratio, (e.g., Chelouche & Netzer 2001) where is the Eddington luminosity. For NGC 3783 .
The superb 900 ksec Chandra/HETG X-ray spectrum of NGC 3783 allowed the first in-depth study of its HIG outflow. The results were thoroughly discussed in Kaspi et al. (2001, 2002), Krongold et al. (2003) and N03. Here we consider the Kaspi et al. (2002) and N03 results as a basis for our model. The main results of these papers can be summarized as follows: The HIG is outflowing with and the absorption line profiles exhibit extended blue wings. The velocity (either centroid or dispersion) does not show significant correlation with ionization level. The HIG consists of at least three distinct ionization components ([low, intermediate, and high]) whose ionization parameters, (defined as the ratio of the photon density in the energy range 0.54-10 keV to the hydrogen number density) are , respectively. Each component has a different column density, , given by, for the above three values of . The N03 analysis shows that none of the HIG components responded to the large, observed continuum variations. Recombination time arguments suggest, therefore, a lower limit on their distance of pc, respectively. The line of sight covering factor of the flow, , is between 0.7 and 1.0. The global () covering factor of the flow, , obtained from the emission lines is . The mass loss rate, , was estimated to be , where is the volume filling factor. For , it exceeds the expected mass accretion rate by roughly two orders of magnitude.
3. General model considerations
Several models have been proposed to qualitatively explain the acceleration of highly ionized gas in AGN (e.g., Krolik & Begelman 1986, Balsara & Krolik 1993, Königl & Kartje 1995, Bottorff, Korista, & Shlosman 2001, Chelouche & Netzer 2001). The models we consider here assume that the flow is driven either by radiation pressure force, thermal pressure gradients, or a combination of the two. The equation of motion in this case is
| (1) |
where is the distance from the ionizing source, the velocity, () the gas density (electron number density), the Thomson cross-section and the thermal pressure ( where and is the average mass per particle; for fully ionized solar metallicity gas). is the force multiplier defined as the ratio of the total radiation pressure force to that due to Compton scattering (see Chelouche & Netzer 2003a and references therein). For the densities associated with the HIG (), the ionization structure of optically thin flows depends, to a good approximation, only on . In this limit, is a function of and the optical depth in the line per unit thermal velocity width (e.g., Chelouche & Netzer 2003a).
The modeling scheme considered here combines detailed photoionization and spectral calculations (some aspects of which were discussed by N03) with a simplified treatment of the gas dynamics. As shown below, the unique set of observational constraints allows us to quantitatively investigate, for the first time, which of the aforementioned dynamical models is most relevant to the HIG outflow in NGC 3783.
3.1. Radiation pressure driven flows
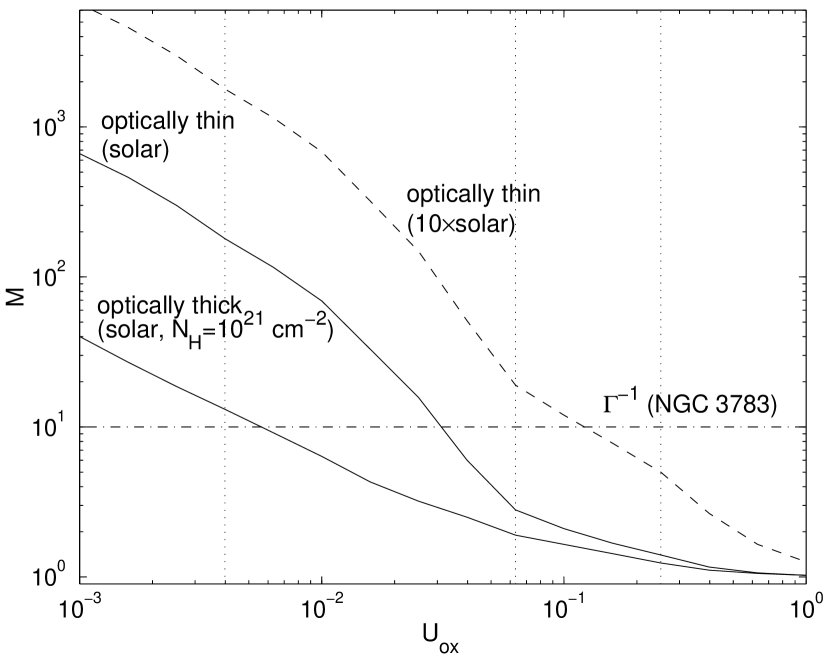
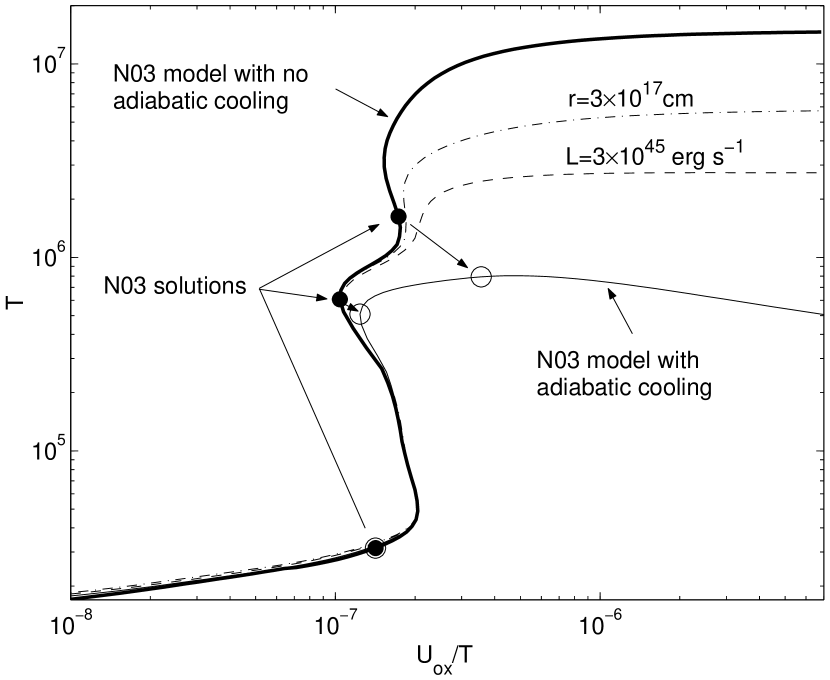
Non-rotating radiation pressure dominated outflows require . Figure 1 suggests that this condition is difficult to meet for solar metallicity, optically thin HIG, assuming the known and SED. Specifically, this condition is not met for the intermediate and high ionization components presented in N03, where we find that for . There is evidence that BLR metallicities can exceed solar (e.g., Hamann & Ferland 1993, see however Shemmer et al. 2004). In our case, the metallicity should exceed about solar for radiation pressure force to overcome gravity for . Such metalicities have never been observed in AGN.
Radiation pressure force can exceed gravity close to the foot-point of rotating flows. As shown by Chelouche & Netzer (2001), HIG flows must be launched within or just outside the broad line region () in order to reach the observed velocities. Unless the line broadening in NGC 3783 is unrelated to the gas dynamics, such models cannot account for the width of the line profiles given the much larger distances implied by the Behar et al. (2003) and N03 analyses. The above considerations do not take into account the effect of dust on the flow dynamics (e.g., Scoville & Norman 1995, Everett 2002) since none has been detected in NGC 3783. We conclude that radiation pressure force is unlikely to drive the flow in NGC 3783 to the observed velocities.
We note that HIG flows may not be steady-state phenomena. In this case, the HIG may have been accelerated in the past (when was larger or the object brighter) and we observe it now at its coasting or even decelerating phase. Although plausible (e.g., Chelouche & Netzer 2001), such a model adds little to our understanding of the general phenomenon.
3.2. Thermal pressure driven flows
Acceleration by thermal pressure gradients (see Parker 1958) has been suggested to drive extremely ionized high temperature gas in AGN (e.g., Begelman, McKee, & Shields 1983, Krolik & Begelman 1986, Balsara & Krolik 1993 and Woods et al. 1996). In particular, Balsara & Krolik (1993) and Woods et al. (1996) presented the results of detailed, time-dependent hydrodynamic calculations of thermal pressure driven flows for a wide range of initial conditions. The conclusion is that highly ionized gas near its Compton temperature may be driven to terminal velocities of up to . Here we investigate the possibility that such a mechanism drives the ionized gas in NGC 3783.
For a spherically expanding flow,
| (2) |
In the limit of (see figure 1), and assuming a polytropic flow with index ( for isothermal gas) we can rewrite equation 1 as
| (3) |
Super-sonic steady-state winds that are launched sub-sonically should cross the sonic point at , where . At this point both the numerator and the denominator vanish thus the equation of motion is defined at all radii. Noting that we find
| (4) |
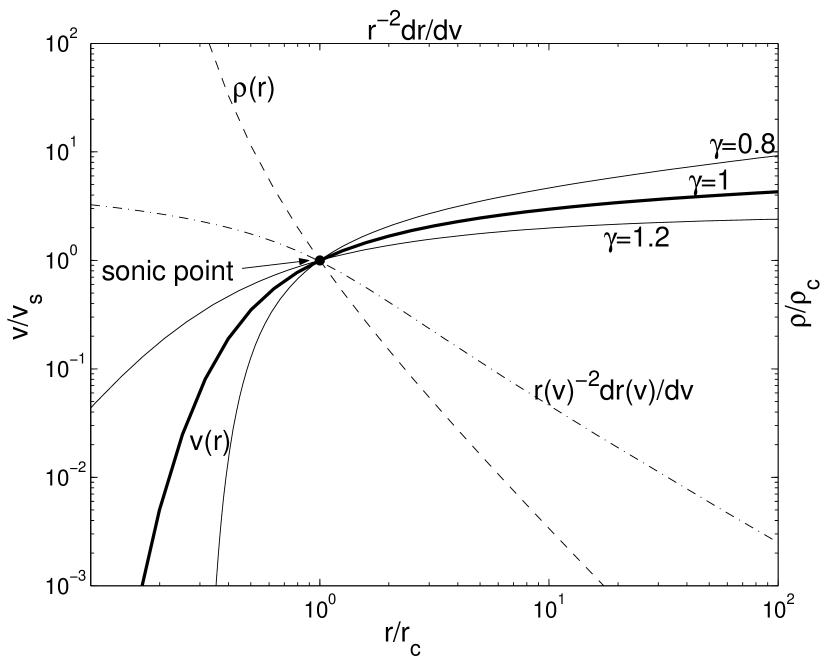
For a given , wind solutions are self-similar and scale with and . Several such solutions for different values of are shown in figure 2. The terminal velocity of such flows is of the order of (or a few times larger than) the sound-speed at the critical point (i.e., the escape velocity). For isothermal flows () the terminal velocity is a few times the sound-speed ( at ) while for polytropic flows with the terminal velocity is lower due to adiabatic losses (e.g., Lamers & Cassinelli 1999). Polytropic flows where imply excessive heating and result in higher flow velocities.
Also shown in figure 2 is the density profile for an isothermal flow. For the density profile is similar to the hydrostatic case. The density beyond the sonic point declines more rapidly compared to the hydrostatic case. The column density of the flow, from some to infinity, is
| (5) |
For super-sonic isothermal flows, and .
Returning to NGC 3783, we notice that the temperature of the high ionization component found by N03, combined with the mass of the central object in this source and assuming gives (equation 4) pc. This distance is consistent with the three lower limits on the distance found by N03. Using equation 5 and the density of the hot component found by N03, we get which is similar to the column density of this component obtained by N03. Thus, the conditions in this source are consistent with a picture where the highest ionization gas is in a state of thermal pressure driven flow. As shown below, there are other observational constraints that are satisfied by such a model.
3.3. The density structure of the flow
The continuity condition (equation 2) implies . This has been shown to result in high ionization absorption line profiles that are more blueshifted and broader compared to low ionization lines (Chelouche & Netzer 2002). Such trends are not observed in NGC 3783 (Kaspi et al. 2002). In fact, lines of different ionization states are remarkably similar which indicates similar dynamics. It is unlikely that different ionization components are launched with different initial conditions and end up showing the same line profiles. A more likely explanation is that all flow components are co-spatial and are accelerated together to their observed velocities (a similar conclusion has been reached by N03 based on the apparent pressure equilibrium between the different phases).
The co-existence of several gas phases is a well known phenomenon in the interstellar medium (ISM) and in molecular clouds. A multi-phase gas naturally occurs for a turbulent medium where the relation between the density and the physical scale follows a powerlaw distribution, (see §4 for the full definition). Such dependences have been observed on large ( pc; e.g., Elmegreen & Scalo 2004) as well as small ( cm; Deshpande 2000) scales.
Consider a small section of the flow over which both and are constant. Since and , we get where (cf. Krolik & Kriss 2001). Thus, there is a simple local relationship between the column density and the ionization parameter involving the size distribution parameter of the medium. This dependence holds also for geometrically thick flows and the integrated column density provided the self-similar scaling holds for all (see §4.3).
Returning to NGC 3783, we find that the N03 three component solution implies . Such a value of usually characterizes turbulent media like the ISM and molecular clouds and is consistent with recent simulations (e.g., Boldyrev, Nordlund, & Padoan 2002).
Our model assumes the following range of densities at every location
| (6) |
where and are the (location dependent) minimum density and maximum length, respectively, and is a constant to be determined later. We require that the surface of a sphere with radius is fully covered by all phases in the density range ,
| (7) |
This results in
| (8) |
where is defined over the surface of the sphere. Assuming that the density contrast, , is a constant of motion then .
The mass loss rate due to all flow components can be calculated by defining the mean density over a (thin) spherical shell,
| (9) |
which may be expressed, using the above relations, as
| (10) |
The mass loss rate is then given by
| (11) |
This conforms with the mass loss rate of a single phase spherical flow in the limits . Assuming a divergence free flow, mass conservation implies
| (12) |
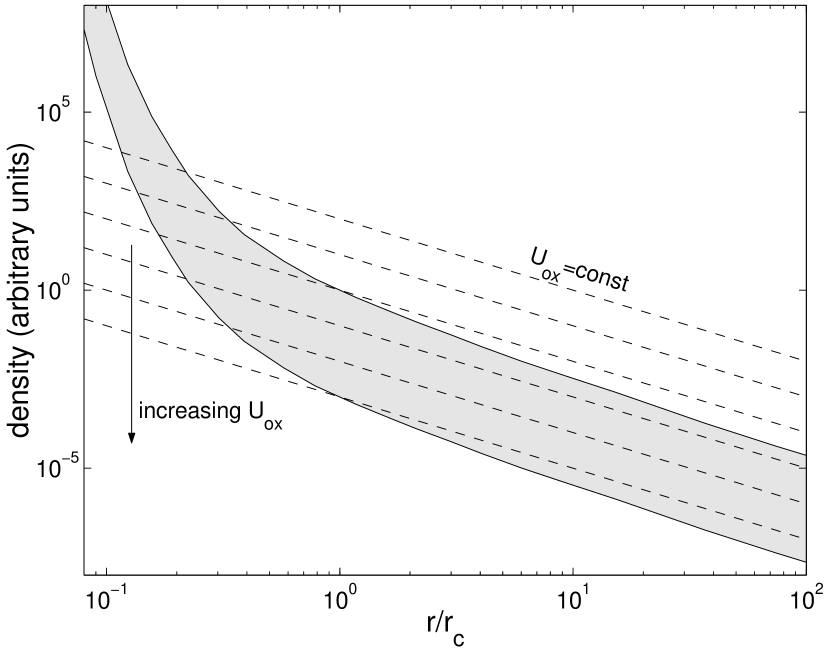
This continuity condition is identical in form to that of a single-phase medium. It means that the highest ionization parameter, , corresponding to the lowest density , is proportional to the velocity. By construction there are fixed density and ionization parameter contrasts at every location (). An example of a density profile of a multi-phase flow is shown in figure 3 together with several iso-ionization parameter curves. Clearly, the mean level of ionization increases as the gas expands.
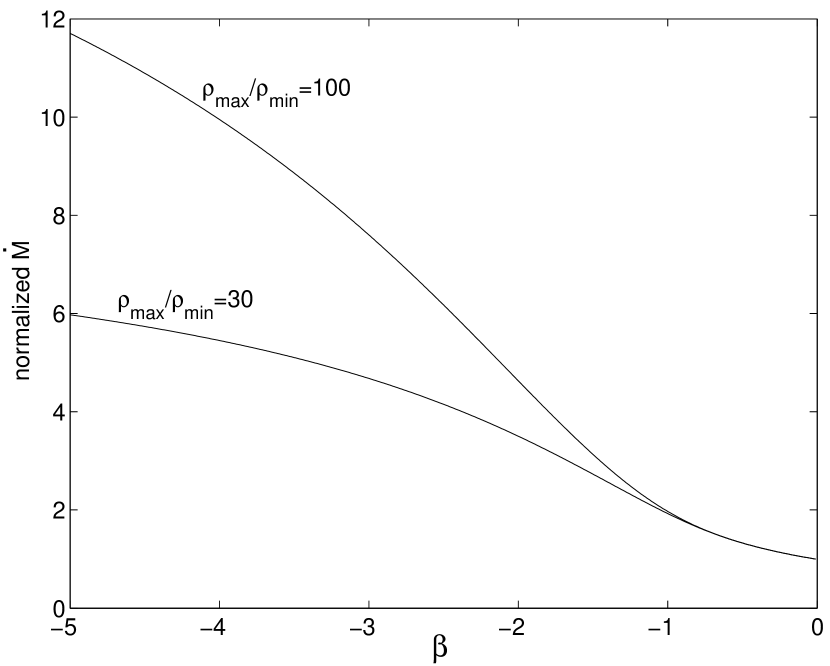
For a given velocity profile, the mass loss rate depends on the density contrast and . For a fixed , smaller and/or larger density contrasts result in denser regions having larger scales and a larger contribution to . The differences are small for since the mass fraction of the denser regions is negligible (figure 4).
The effect of inhomogeneity on the flow dynamics can be approximated by noting that all components in the N03 solution are in a rough pressure equilibrium. Under such conditions one must solve for the combined dynamics of all phases since their coupling is strong and the momentum is quickly (relative to the dynamical timescale) distributed throughout the flow. The dynamical effect can therefore be included by considering their contribution to the inertial mass. The mean (over volume) density is . In this approximation, the critical point is given by
| (13) |
In the above analysis we have neglected the effect of drag forces between the different phases. This is justified if such condensations are constantly forming and evaporating on short timescales compared to the dynamical time and the mean net effect is averaged-out. Thus, the flow considered here is very different from other works in which discrete, dynamically independent clouds, rather than time-dependent condensations, are assumed (e.g., Chelouche & Netzer 2001, Everett 2002).
3.4. Thermal balance in a multi-phase expanding medium
As demonstrated in several works (e.g., Begelman, McKee, & Shields 1983, Balsara & Krolik 1993, Woods et al. 1997), adiabatic cooling can have an important effect on the thermal equilibrium and, hence, on the dynamics of continuously expanding Compton-heated winds in low luminosity AGN. Here we investigate the effect of such cooling on the thermal structure of the multi-phased HIG in NGC 3783 where the temperature is below the Compton temperature and the medium may be turbulent.
Neglecting the small contribution due to velocity gradients, the adiabatic cooling term for a spherically expanding continuous flow is
| (14) |
The N03 model of NGC 3783 did not include adiabatic cooling. Considering the observed properties of NGC 3783 ( and ) and including the process in the ION thermal calculations, we find that adiabatic cooling lowers the maximum temperature by more than an order of magnitude (see figure 5). Since we do not have a numerical hydrodynamic code, we have tested this result against the numerical calculations of Woods et al. (1996) under similar conditions (such as the Eddington ratio, SED, and gas velocity; see their figure 14) and find them to be in good agreement. Thus, the numerical approach adopted here gives the correct temperature and expansion velocity which is required by our calculations. The effect is smaller when the ionizing flux is higher since heating is proportional to (see the individual curves in figure 5). The ionization structure of the flow and, hence , are less affected by adiabatic cooling.
Adiabatic cooling also alters the stability curve for the gas. The three N03 solutions still lie on the stable branches of the stability curve yet the pressure of the high ionization component is smaller by roughly a factor 3 so that strict pressure equilibrium between all components is not maintained.
The flow considered here is multi-phased and turbulent (see §6.3). In such a case there is an additional internal energy source entrained in the large eddies. This energy is transferred to smaller and smaller scales until it dissipates (e.g., via Coulomb collisions) and serves as an additional heat source for the gas. The corresponding heating rate is
| (15) |
where is the turbulence velocity (see Bottorff & Ferland 2002). Typically, is of the order of and the flow velocity, (e.g., Shu 1992). The size of the largest eddy is comparable to the flow extent and, hence, to . Hence, heating by turbulent dissipation can offset the adiabatic cooling. Below we consider several models where the two terms play different roles.
4. A Thermal Pressure Driven Flow Model for NGC 3783
In §3.2 we have shown a qualitative agreement between the predictions of a multi-phase, thermal pressure driven flow model and the observations of NGC 3783. Section 3.3 outlined the physical model in detail. Here we carry out a more quantitative investigation of the model and apply it to the outflowing gas in NGC 3783. The main aim is to give detailed spectral predictions and compare them to the high resolution X-ray observations. We use the simplified, steady-state treatment of the flow dynamics presented in §3.2 and a sophisticated scheme for the calculation of the transmitted spectrum through the flow. As explained, the changes in the gas temperature and the attained velocities are in general agreement with more sophisticated hydro-calculations.
Here the flow is assumed to evaporate from some mass reservoir (e.g., the accretion disk or the putative torus), expands as it is accelerated to cover a fair fraction of the AGN sky, and crosses our line-of-sight at some finite radius (to be determined later). Such flow configurations are often assumed in 1D modeling of AGN flows (e.g., Murray et al. 1995) and have been qualitatively confirmed by detailed hydrodynamical simulations of energy driven flows (e.g., Balsara & Krolik 1993; see also Woods et al. 1996).
4.1. Calculation Scheme
We begin the calculation by specifying the initial conditions. These include the location, , where the flow enters our line-of-sight (and need not be equal to ), , and which also determine the density contrast throughout the flow. An additional parameter is the density powerlaw index, . The other parameters, and , are fixed at their observed values.
The next step involves photoionization and thermal calculations of non-LTE gas in statistical equilibrium (this is justified since the dynamical timescales are larger than the recombination timescales by several orders of magnitude; Krolik & Kriss 2001, N03). These calculations are carried out using ION 2004, the 2004 version of the ION photoionization code (e.g., N03, with the addition of including new di-electronic recombination rates for iron; see Netzer 2004) which includes all important heating and cooling mechanisms and is suitable for exploring the physics of HIG in photoionization equilibrium. The code includes also the effect of adiabatic cooling on the thermal structure of the highest ionization phase (see equation 14). Once the temperature profile of the high ionization phase is calculated, we approximate it by a polytropic relation () which provides a good approximation for the cases considered here, and solve the equation of motion. (We note that, for the relevant parameter space, radiation pressure force acting on the low ionization phases of the gas has a negligible effect on the global flow dynamics). The process iterates several times until and converge.
The next step is to calculate the ionization and thermal structure of all flow phases at location . This is done for a flow section of length in the radial direction. is taken as the scale over which the flow velocity changes by . This ensures high resolution spectral predictions for the absorption lines. For this purpose we use a discrete version of the continuous density distribution (equation 6) that includes 50 phases corresponding to roughly 0.1 dex intervals in . When calculating the transmitted spectrum through sections of the flow we assume that equation 8 holds also for the line-of-sight direction albeit with a different normalization (spherical condensations or “clouds” are not the general case under such conditions; e.g., Blumenthal & Mathews 1979). This means that
| (16) |
where is the length scale in the radial direction and
| (17) |
is determined by the somewhat arbitrarily defined and is therefore independent of . The ratio is constant, by construction, for all phases, and is their geometrical aspect ratio (e.g., Blumenthal & Mathews 1979). This arbitrariness in the shape and the number of condensations (see the appendix) has no bearing on the results presented in this work which rely on observationally deduced quantities, and is related to our ignorance concerning the hydrodynamical properties of such flows and the exact shape (e.g., the number of absorption systems) of the X-ray line profiles.
The contribution of all phases to the line and continuum opacity at each section of the flow is calculated assuming full line-of-sight coverage of the continuum source (see below). The transmitted continuum then serves as the ionizing spectrum for the photoionization calculation of the successive section at . The velocity shifts at each point are taken into account when calculating the transmitted spectrum. The calculation continues to large and produces a high resolution, theoretical X-ray spectrum.
The global covering fraction of a phase with density in the range at a distance is given by
| (18) |
Clearly, the covering factor, expressed in this way, can be much smaller than unity for the denser phases and can significantly effect the transmitted continuum through the flow. However, this is only a geometrical definition and the more relevant quantity is the velocity dependent covering factor, , which takes into account the gas motion and thus enables the proper treatment of the opacity (e.g., Gabel et al. 2003). We note that, in a turbulent flow, there is no one-to-one correspondence between and . Turbulence broadens the lines and increases (see also §5).
4.2. Dependence on initial conditions
The solution of the self-consistent model depends on several initial and boundary conditions. The dependence on the initial conditions of the problem, , and is discussed here for the case of isothermal flows. Qualitatively similar results are obtained also for polytropic flows.
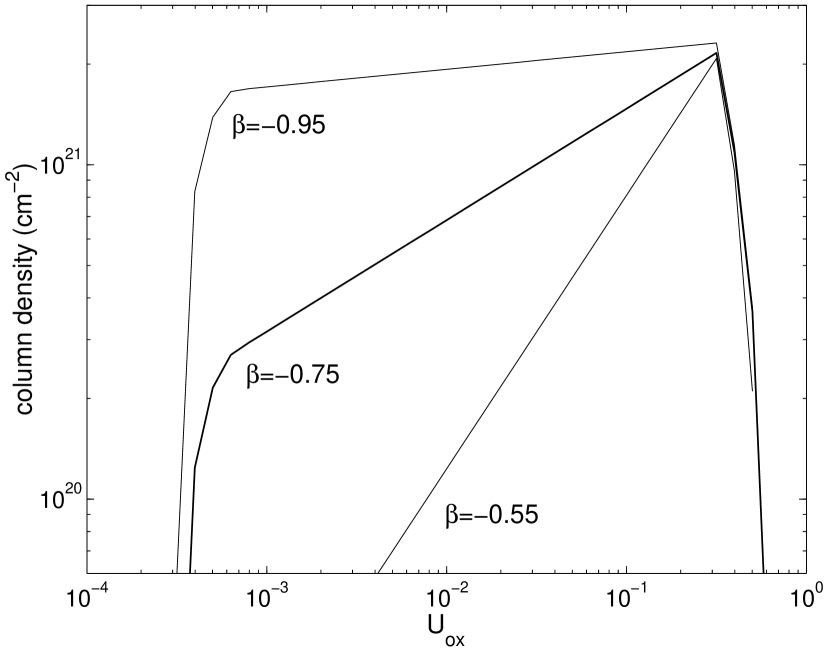
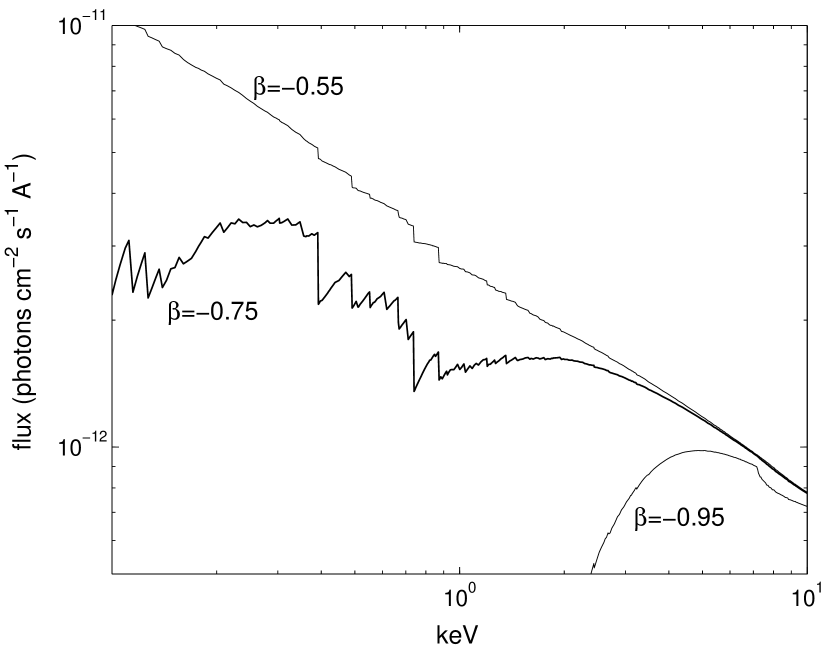
We first explore the dependence of the column density distribution on and . As discussed in §3.3 and shown in figure 6, affects the column density distribution such that smaller results in larger columns of low ionization gas. The expansion of the flow and the imposed boundary conditions result in rapid decline of the column density for extreme values of . Different column densities result in different transmitted spectra. This is shown in figure 7 where we find that smaller result in more opaque flows. The effect can be dramatic even for 0.2 change in in cases of large integrated columns.
Smaller density contrasts, i.e., larger at a fixed , result in smaller columns of less ionized gas (figure 6) and therefore lower opacity and higher transmitted soft X-ray flux (i.e., softer spectra, figure 7).
The distance, , where the flow crosses our line-of-sight with velocity , affects the total column density of the flow. The effect is manifested as a change in the X-ray “color”. For example, smaller imply larger densities, more opaque gas, and harder X-ray spectrum. This is especially important if our line-of-sight crosses the subsonic section of the flow () given the nearly hydrostatic structure of the gas.
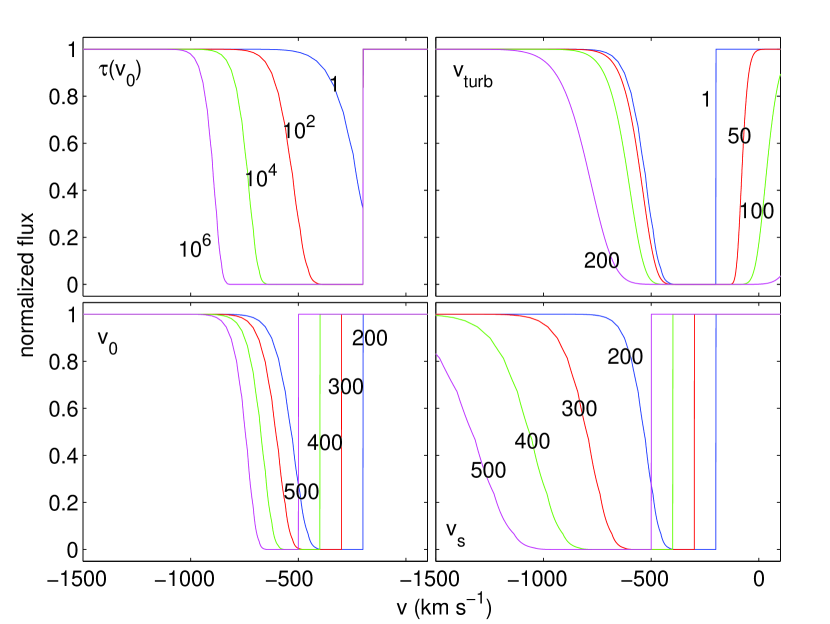
We next consider the effect of initial conditions on the absorption line profiles and assume, for demonstrative purposes, that lines are produced throughout the flow by a single ionization phase (i.e., over a narrow range in ). In such a case, the optical depth as a function of velocity (for a phase with a given ) is
| (19) |
where we have assumed a Gaussian kernel for line broadening due to e.g., a turbulent velocity field. The dependence of the line profile on (the optical depth at ), , and is shown in figure 8. The calculations show that all line profiles exhibit extended blue wings due to the flow expansion with the most extreme line asymmetries occurring for optically thin lines (e.g., ). Larger broadens the lines and makes them more symmetrical with respect to . naturally causes a line shift such that larger will result in more blueshifted, narrower lines for the same . When calculating the effect of the sound-speed (of the highest ionization component), , on the line profile we have assumed which is relevant to super-sonic flows that are optically thin in the continuum. As shown, larger imply larger terminal velocities and considerably broader lines. Obviously, the observed line profiles may have a more symmetrical shape depending on the spectral resolution of the instrument.
5. Fitting the 900 ksec Chandra spectrum of NGC 3783
We resort to an iterative scheme to fit the observed high resolution X-ray spectrum of NGC 3783. We first try to constrain the flow dynamics. This is accomplished by taking the theoretical line profiles, normalizing the column densities to agree with those obtained by N03, and convolving the calculated profile with the known instrumental profile (Kaspi et al. 2002). A comparison between the predicted and the observed line profiles defines a narrow range of (hence, and conversely ), and . An initial estimate for comes from the scaling of the column density with ionization parameter (see §3.3). This allows us to employ the next step in our fitting scheme which is a more systematic and time consuming search in a localized region of the parameter space, involving complex spectral calculations (section 4.2).
The calculated line and continuum spectra take into account the probability for our line-of-sight to intersect any given phase at every location in the flow (see §4.2). We assume that the finite thermal and turbulent broadening results in (the opacity at every velocity bin is properly scaled so that the integrated column density is conserved). The best-fit model is obtained by comparing the detailed theoretical spectrum to the observed spectral shape and to individual absorption line profiles. All calculations assume a photon continuum slope, , which best characterizes the hard X-ray spectrum of this source.
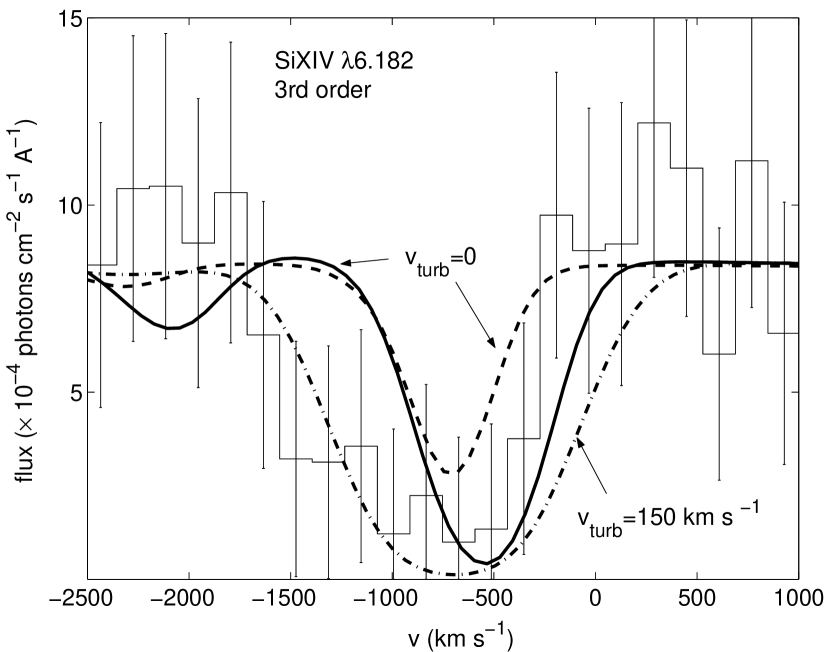
Considering only radiative heating and cooling, and adiabatic cooling, we find a set of models (hereafter adiabatic models) which are consistent with the spectral shape and whose critical point is about pc from the center and . The density contrast of the flows spans more than four orders of magnitude at every location (e.g., at pc). Such flows reach a velocity of about and the absorption line profiles, convolved with the instrumental resolution, are shown in figure 9. Clearly, the predicted lines are narrower and less blueshifted than observed. A better fit is obtained by requiring that the flow crosses our line of sight at large distance ( pc) and the line profiles are broadened by a turbulent velocity field. For Si XIV , a provides a better fit to the data (figure 9).
The observational indication for the existence of turbulence suggests that the thermal equilibrium of the gas may be affected by it. Due to the uncertainties associated with the combined effects of adiabatic cooling and turbulent dissipation heating we study a case where and radiative processes are the only important heating and cooling mechanisms. In this case, the high ionization, volume filling phase of the flow may be considered isothermal (e.g., Begelman, McKee, & Shields 1983). We refer to it as the isothermal model but note that all components which are not fully ionized have radial temperature dependence.
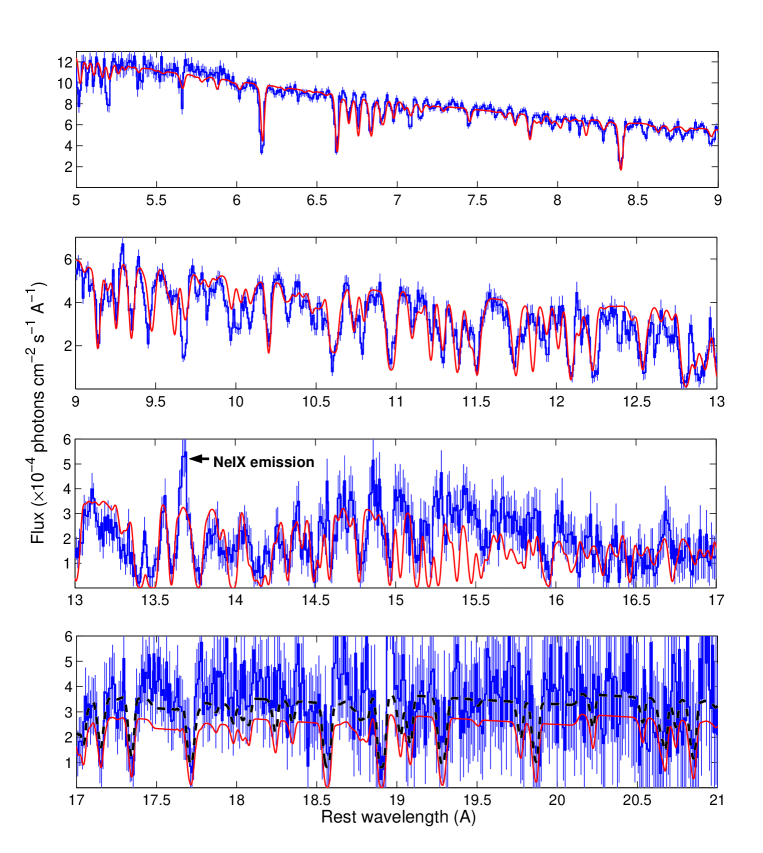
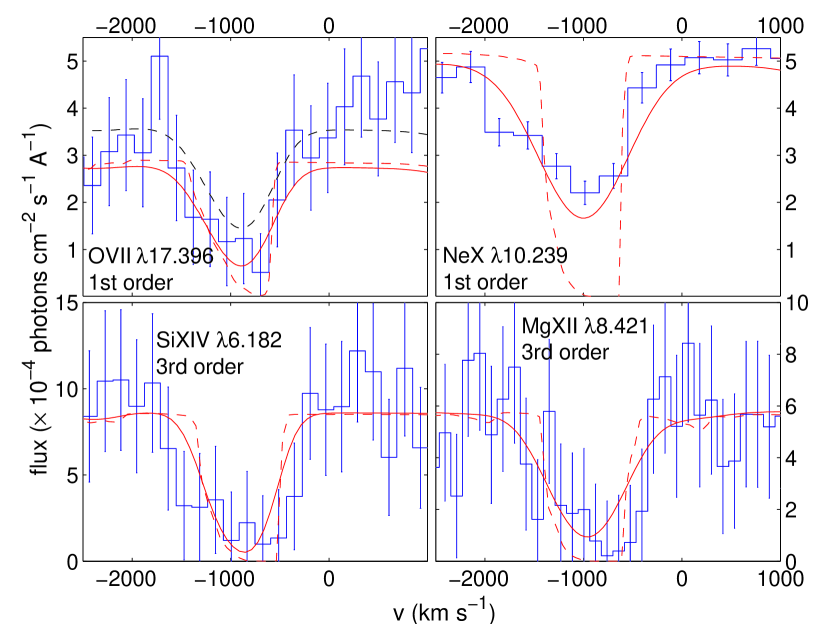
The best-fit isothermal model is shown in figure 10 (a similar fit is obtained for models using either of the full line-of-sight coverage methods described in §4.2). Clearly, the model is acceptable and is qualitatively similar to the best-fit model of N03. Inspection of individual absorption line profiles (figure 11) shows qualitative agreement with respect to the line centroids and widths. The derived mass loss rate is [for (N03), ], i.e., considerably smaller than the N03 and the Behar et al. (2003) estimates. The model also gives detailed predictions for the column densities of various ions. These are given in table 1 for the more abundant elements. Clearly, the stratified structure of the flow results in a wide range of ionization levels having comparable column densities. We discuss the implications of these results in §6.2.
TABLE 1
Ion Column Densities ()
Element
I
II
III
IV
V
VI
VII
VIII
IX
X
XI
XII
XIII
XIV
H
16.5
He
13.7
19.3
C
7.4
12.2
15.3
16.6
17.8
18.0
N
6.5
11.5
14.9
16.5
16.8
17.4
17.5
O
6.8
11.9
15.5
17.0
17.4
17.5
18.1
18.2
Ne
6.0
11.3
14.8
16.2
17.0
17.2
16.8
16.8
17.4
17.6
Mg
7.8
10.4
13.6
14.7
15.3
16.1
16.4
16.6
16.7
16.7
17.1
17.2
Si
6.5
10.2
12.2
13.4
14.9
15.8
16.2
16.5
16.6
16.7
16.7
16.6
17.1
17.2
Column densities of various ions for
our best-fit model. Boldface values mark deviations by more than a
factor two from those deduced from observations and
reported by N03.
TABLE 2
Best-fit model parameters
Parameter
Value
Critical distance [ cm]
Line-of-sight crossing distance [ cm]
Maximum ionization parameter at []
Minimum ionization parameter at []
Density spectrum index ()
Mass loss rate [],
⋆ For (N03), is in the range
The range of parameters characterizing acceptable models are given in table 2. The quoted uncertainties refer to differences between the adiabatic and isothermal models, the mass of the central object, and the degeneracy in the spectral fit. Specifically, the error in the value of each parameter represents the maximum deviation from the best-fit value for which a good fit can be obtained by varying all the other parameters in the table. Thus, uncertainties in different parameters are not independent.
6. Discussion
We have introduced a new approach for modeling highly ionized flows in AGN. The emerging physical picture for the X-ray flow in NGC 3783 is that of a multi-phased, geometrically thick flow that is thermally evaporated from a parsec scale region. The density range ( at ) occupied by the flow is much larger than obtained by Krongold et al. 2003 and N03 and implies a density of the warm absorbing phase which is, on average, lower than that suggested by Reynolds & Fabian (1995) and Bottorff & Ferland (2001). Our model has extremely ionized dynamical components that are not detected spectroscopically. The least ionized components are also absent in previous works since it is difficult to disentangle the ionization-level–column-density degeneracy.
6.1. Is the flow turbulent?
The above analysis suggests that the outflowing HIG may be turbulent for several reasons: 1) The flow is multi-phased with different phases at a rough pressure equilibrium. 2) The density spectrum (i.e., ) is similar to that found in the ISM and in molecular clouds which are known to be turbulent media. 3) The Reynolds number of the flow is . This is obtained by assuming non-magnetic plasma and taking the scale of the largest eddies to be , the velocity , and the density of the highest ionization phase (see e.g., equations 3.25 & 3.30 in Lang 1999). Such a medium is capable of sustaining turbulent motion. The density or range in our model spans roughly five orders of magnitude (corresponding to ). This agrees with the naive theoretical expectation that the maximum density is that at which energy cascade is terminated and the energy is dissipated. This occurs when the density range spans roughly decades (e.g., Shu 1992); i.e., consistent with the results obtained from the spectral fit.
Our model does not explain the onset of turbulence in the flow. One possibility is that it is triggered by the putative central star cluster within the central parsec of NGC 3783.
6.2. The UV–X-ray connection
Table 2 suggests that the X-ray flow in NGC 3783 may also produce strong low ionization UV absorption lines of H I , C IV , and O VI . Our predictions are consistent with the lower limit on the column density of C IV deduced by Crenshaw et al. (1999). The model suggests that the global covering factor is smaller for lower ionization gas phases (equation 18). This, and the fact that the UV continuum emitting source is likely to be larger than the X-ray source, imply that the UV line profiles may be prone to partial line-of-sight coverage effects. This may be manifested either as multi-component absorption (i.e., not all flow phases are represented at every velocity bin; see §4.2) or as non-black saturation (e.g., Gabel et al. 2002). The current resolution of the X-ray gratings and the signal-to-noise level of the observation are not high enough to tell which of these scenarios is relevant to NGC 3783.
The dynamical timescale of the flow, , is about years. Gabel et al. (2003) reported a considerable velocity shift () of the highest velocity component over less than a year. Clearly, the two timescales do not agree. It is however possible that a filament moving across our line-of-sight rather than a real deceleration of the flow is responsible for the observed effect (see also Gabel et al. 2003). The relevant timescale in this case is the time it takes a filament to cross the surface of the UV emitting region. Assuming this region to be of order , where is the Schwartzschild radius ( in the case of NGC 3783) and the velocity across the line-of-sight to be of the order of the thermal speed, we get a crossing timescale of year, i.e., consistent with observations. We conclude that either the high velocity decelerating UV component is not related to the X-ray flow or else the apparent deceleration is caused by line-of-sight effects.
6.3. Extended emission
Some Seyfert 1 galaxies show evidence of extended, diffuse X-ray emission (e.g., NGC 3516; George et al. 2002). This is also common in Seyfert 2 galaxies. A natural question is whether the extended HIG flow is partly responsible for such emission through the scattering of continuum photons into our line-of-sight. The expected scattered X-ray luminosity assuming pure electron scattering is
| (20) |
where is the Compton optical depth and the total X-ray luminosity. It is possible to relate to the total mass loss rate of the flow, , via
| (21) |
where is the distance beyond which is calculated. This gives
| (22) |
The extended ( kpc) X-ray flux from NGC 3783 is (George I., private communication), i.e., consistent with model predictions (see table 1).
6.4. Relation to other AGN components
So far, we have not considered the source of the outflowing gas. Our model suggests that, for NGC 3783, it is located within the central pc. A possible mass reservoir on such scales is the putative molecular torus (e.g., Krolik & Begelman 1988; Krolik & Kriss 1995; and Netzer et al. 2002). Taking the torus parameters from Netzer et al. (2002), we obtain that the torus mass is and that HIG flows may be sustained at their current mass loss rates for years. If, as suggested by Krolik & Begelman (1988), the torus is also responsible for feeding the AGN, than this timescale also corresponds to the present activity life-time.
The narrow line region (NLR) lies at the outskirts of the HIG flow and hence is exposed to a modified type-I AGN continuum. Similar conclusions (albeit with a somewhat more diminished UV fluxes compared to the model presented here) have been reached by Alexander et al. (1999) based on the analysis of narrow emission lines in NGC 4151. A physical interaction between the HIG outflow and the NLR is unlikely to be energetically important given the small mass loss rate derived here (cf. Laor 1998).
6.5. Model limitations and extensions
Despite the success of our model in explaining the observed X-ray features there are several notable problems.
6.5.1 flow dynamics
In its simplest form (without turbulent line-broadening or dissipative heating) our model under-predicted the line widths and blueshifts. One possibility, discussed in §5 and §6.1, is that the flow is turbulent. Alternatively, higher flow velocities and better agreement with the data may be obtained if the flow is launched closer in to the central source. This requires, however, that the mass of the central object be smaller by a factor of a few compared to that reported in Peterson et al. (2004; see also §6.5.2). Another possibility is that the flow dynamics reflects a higher mean past luminosity compared with the one deduced from the present observations. In both cases, adiabatic cooling is less important (see §3.4) and radiative acceleration is more effective (since is larger). Our calculations show that in such cases the terminal velocity is slightly larger (by ) than that of the isothermal model (see §5) and the fit is qualitatively similar.
6.5.2 flow location
The value of derived here is smaller than the lower limit derived by N03 on the distance of the multi-phased flow but is larger than the upper limit for the highest ionization component by itself. Nevertheless, the model is consistent with the lack of appreciable equivalent width (EW) variations of the silicon and sulfur lines since the multi-phase flow is geometrically thick. Note also that and depend linearly on the mass of the central object which is somewhat uncertain. For example, Kaspi et al. (2000) report , i.e., a factor three lower than the new Peterson et al. (2004) estimate. A model having similar spectral properties would have pc and pc (compared with the present pc and pc) for such low (equation 4).
Reeves et al. (2004) reported XMM-Newton Epic-pn observations showing significant EW variations of Fe XXIII and Fe XXIV absorption lines near 2Å. The lines are consistent with the highest ionization N03 model yet, according to Reeves et al, they suggest the gas lies within the central 0.02 pc. We have checked this suggestion within the general N03 model. Assuming the reported line variability is real and using the mean N03 continuum luminosity, we find that the photoionization timescale of Fe XXIII gives an upper limit of pc, basically identical to the value denoted in N03. This is, however, inconsistent with the lower-limits on the location of the two more neutral, higher density components. Thus, the Reeves et al. (2004) observation presents a real difficulty to our multiphase model where all components are present at all locations. It remains to be seen whether the high ionization gas component reported by Reeves et al. is part of the outflow in NGC 3783.
6.5.3 thermal instability
Our model assumes a continuous range of densities and therefore ionization levels and temperatures. However, some phases of our model lie on thermally unstable branches of the stability curve (see figure 5). In this case the gas may undergo non-linear compression or expansion following some initial perturbation and end up in a thermally stable equilibrium. This will effectively change the assumed distribution. The appropriate modeling of such conditions is beyond the scope of this paper.
6.5.4 spectral deviations
Our model predicts lower flux levels then observed at soft X-ray energies. This discrepancy is eliminated if one takes into account partial covering (N03). Such an effect is, in fact, expected since the low ionization gas is likely to have lower global coverage. A continuum leakage of 20% (80% flow coverage) improves our fit and correctly predicts the depth of the (saturated but non-black) O VIII lines. Another discrepancy is evident near Å where our model predicts too much absorption by highly ionized iron lines. This may be related to the di-electronic recombination rates of some of these ions (cf. Netzer 2004). Also, figure 10 does not include emission features from the flow which results in under prediction of the flux in several bands (e.g., near the line of Ne IX at 13.6Å; see Kaspi et al. 2002).
Kaspi et al. (2002) showed that some X-ray line profiles exhibit two absorption components. Our model assumes a smooth flow and, therefore, smooth line profiles. Multi-component absorption may be accounted for in two ways: 1) It is possible that the high velocity component seen in Kaspi et al. (2002) is due to a flow which is launched closer in to the central source where the temperature of the highest ionization component is higher and the escape velocity larger. 2) Absorption deficit at some intermediate velocities (e.g., due to a “missing” phase at some location; see §6.2.2). Modeling such multi-velocity flows is beyond the scope of this paper.
7. Summary
We presented a novel method for modeling the properties of highly ionized flows in AGN. We performed state-of-the-art photoionization, dynamical, and spectral calculations, and compared our results to the 900 ksec Chandra/HETG spectrum of NGC 3783. The model is consistent with several independent observational constraints including the continuum and line spectrum, spectral variations (or the lack of), and the upper-limit on extended emission from this source. Our major conclusions can be summarized as follows: 1) The flow in this source is geometrically thick and is driven primarily by thermal pressure gradients. 2) The flow is multi-phased with a density-size spectrum which resembles that of a turbulent medium. Adiabatic cooling and turbulent heating are likely to be important in the energy balance. 3) The gas is located beyond the broad line region and within the narrow line region. Its origin may be related to the putative torus. 4) The mass loss rate is of order of the mass accretion rate in this object and the kinetic luminosity is very small () compared to the bolometric luminosity of the source. 5) The same flow may also account for some of the UV lines observed in this source.
References
- Alexander et al. (1999) Alexander, T., Sturm, E., Lutz, D., Sternberg, A., Netzer, H., & Genzel, R. 1999, ApJ, 512, 204
- Arav, Li, & Begelman (1994) Arav, N., Li, Z., & Begelman, M. C. 1994, ApJ, 432, 62
- Balsara & Krolik (1993) Balsara, D. S. & Krolik, J. H. 1993, ApJ, 402, 109
- Begelman, McKee, & Shields (1983) Begelman, M. C., McKee, C. F., & Shields, G. A. 1983, ApJ, 271, 70
- Behar et al. (2003) Behar, E., Rasmussen, A. P., Blustin, A. J., Sako, M., Kahn, S. M., Kaastra, J. S., Branduardi-Raymont, G., & Steenbrugge, K. C. 2003, ApJ, 598, 232
- Blumenthal & Mathews (1979) Blumenthal, G. R. & Mathews, W. G. 1979, ApJ, 233, 479
- Boldyrev, Nordlund, & Padoan (2002) Boldyrev, S., Nordlund, Å., & Padoan, P. 2002, Physical Review Letters, 89, 031102
- Bottorff, Korista, & Shlosman (2000) Bottorff, M. C., Korista, K. T., & Shlosman, I. 2000, ApJ, 537, 134
- Bottorff & Ferland (2001) Bottorff, M., & Ferland, G. 2001, ApJ, 549, 118
- Bottorff & Ferland (2002) Bottorff, M. & Ferland, G. 2002, ApJ, 568, 581
- Brandenburg (2001) Brandenburg, A. 2001, ApJ, 550, 824
- Branduardi-Raymont et al. (2001) Branduardi-Raymont, G., Sako, M., Kahn, S. M., Brinkman, A. C., Kaastra, J. S., & Page, M. J. 2001, A&A, 365, L140
- Chartas, Brandt, Gallagher, & Garmire (2002) Chartas, G., Brandt, W. N., Gallagher, S. C., & Garmire, G. P. 2002, ApJ, 579, 169
- Chelouche & Netzer (2001) Chelouche, D., & Netzer, H. 2001, MNRAS, 326, 916
- Chelouche & Netzer (2002) Chelouche, D., & Netzer, H. 2002, Astronomical Society of the Pacific Conference Series, 255, 315
- Chelouche & Netzer (2003a) Chelouche, D. & Netzer, H. 2003a, MNRAS, 344, 223
- Chelouche & Netzer (2003b) Chelouche, D. & Netzer, H. 2003b, MNRAS, 344, 233
- Crenshaw et al. (1999) Crenshaw, D. M., Kraemer, S. B., Boggess, A., Maran, S. P., Mushotzky, R. F., & Wu, C. 1999, ApJ, 516, 750
- Deshpande (2000) Deshpande, A. 2000, MNRAS, 317, 199
- Elmegreen & Scalo (2004) Elmegreen, B. G. & Scalo, J. 2004, ARA&A, in press (astro-ph/0404451)
- Everett (2002) Everett, J., 2002, Ph.D. thesis (astro-ph/0212421)
- Fleck (1981) Fleck, R. C. 1981, ApJ, 246, L151
- Gabel et al. (2003) Gabel, J. R., et al. 2003, ApJ, 583, 178
- Gabel et al. (2003) Gabel, J. R., et al. 2003, ApJ, 595, 120
- George et al. (1998) George, I. M., Turner, T. J., Netzer, H., Nandra, K., Mushotzky, R. F., & Yaqoob, T. 1998, ApJS, 114, 73
- George et al. (2000) George, I. M., Turner, T. J., Yaqoob, T., Netzer, H., Laor, A., Mushotzky, R. F., Nandra, K., & Takahashi, T. 2000, ApJ, 531, 52
- Halpern (1984) Halpern, J. P. 1984, ApJ, 281, 90
- Kaastra et al. (2000) Kaastra, J. S., Mewe, R., Liedahl, D. A., Komossa, S., & Brinkman, A. C. 2000, A&A, 354, L83
- Kaspi et al. (2000) Kaspi, S., Smith, P. S., Netzer, H., Maoz, D., Jannuzi, B. T., & Giveon, U. 2000, ApJ, 533, 631
- Kaspi et al. (2000) Kaspi, S., Brandt, W. N., Netzer, H., Sambruna, R., Chartas, G., Garmire, G. P., & Nousek, J. A. 2000, ApJ, 535, L17
- Kaspi et al. (2002) Kaspi, S., et al. 2002, ApJ, 574, 643
- Konigl & Kartje (1994) Königl, A. & Kartje, J. F. 1994, ApJ, 434, 446
- Krolik & Begelman (1986) Krolik, J. H. & Begelman, M. C. 1986, ApJ, 308, L55
- Krolik & Begelman (1988) Krolik, J. H. & Begelman, M. C. 1988, ApJ, 329, 702
- Krolik & Kriss (1995) Krolik J. H., Kriss, G. A., 1995, ApJ, 447, 512
- Krolik & Kriss (2001) Krolik J. H., Kriss, G. A., 2001, ApJ, 561, 684
- Krongold et al. (2003) Krongold, Y., Nicastro, F., Brickhouse, N. S., Elvis, M., Liedahl, D. A., & Mathur, S. 2003, ApJ, 597, 832
- Lamers & Cassinelli (1999) Lamers, H. J. G. L. M. & Cassinelli, J. P. 1999, Introduction to stellar winds / Henny J.G.L.M. Lamers and Joseph P. Cassinelli. Cambridge ; New York : Cambridge University Press, 1999. ISBN 0521593980,
- Lang (1999) Lang, K. R. 1999, Astrophysical formulae / K.R. Lang. New York : Springer, 1999. (Astronomy and astrophysics library,ISSN0941-7834)
- Laor (1998) Laor, A. 1998, ApJ, 496, 71L
- Lee et al. (2001) Lee, J. C., Ogle, P. M., Canizares, C. R., Marshall, H. L., Schulz, N. S., Morales, R., Fabian, A. C., & Iwasawa, K. 2001, ApJ, 554, L13
- Murray, Chiang, Grossman, & Voit (1995) Murray, N., Chiang, J., Grossman, S. A., & Voit, G. M. 1995, ApJ, 451, 498
- Netzer et al. (2002) Netzer, H., Chelouche, D., George, I. M., Turner, T. J., Crenshaw, D. M., Kraemer, S. B., & Nandra, K. 2002, ApJ, 571, 256
- Netzer et al. (2003) Netzer, H., et al. 2003, ApJ, 599, 933 (N03)
- Netzer (2004) Netzer, H. 2004, ApJ, 604, 551
- Parker (1958) Parker, E. N. 1958, ApJ, 128, 664
- Peterson et al. (2004) Peterson, B. A. 2004, ApJ, submitted
- Porquet et al. (2004) Porquet D., Reeves, J. N., O’Brien, P. & Brinkamnn, W. 2004, A&A, in press (astro-ph/0404385)
- Reeves et al. (2004) Reeves, J. N., Nandra, K., George, I. M., Pounds, K. A., Turner, T. J., & Yaqoob, T. 2004, ApJ, 602, 648
- Reynolds & Fabian (1995) Reynolds, C. S., & Fabian, A. C. 1995, MNRAS, 273, 1167
- Scannapieco & Oh (2004) Scannapieco, E. & Oh, S. P. 2004, ApJ 608, 62
- Schodel et al. (2003) Schödel, R., Ott, T., Genzel, R., Eckart E., Mouawad N., & Alexander, T. 2003, ApJ, 596, 1015
- Scoville & Norman (1995) Scoville N. & Norman C. 1995, ApJ, 451, 510
- Shemmer (2004) Shemmer, O., Netzer, H., Maiolino, R., Oliva, E., Croom, S., Corbett, E., & di Fabrizio L. 2004, ApJ, 614, 547
- Shu (1992) Shu, F. H. 1992, Physics of Astrophysics, Vol. II, by Frank H. Shu. Published by University Science Books, ISBN 0-935702-65-2, 476pp, 1992
- Steenbrugge (2005) Steenbrugge, K. C. et al., 2005, A&A, accepted (astro-ph/0501122)
- Woods et al. (1996) Woods, D. T. , Klein, R. F., Castor, J. I., McKee, C. F., & Bell, J. B. 1996, ApJ, 461, 767
Appendix A Alternative derivation of the flow equations
It is possible to derive the flow equations using the volume filling factor formalism adopted by Arav, Li, & Begelman (1994) in their modeling of outflowing BAL regions. The Arav et al. model assumes confined clouds and may not be suitable for describing the highly ionized gas condensations considered here. Nevertheless, a comparison between the two approaches is useful.
Define a volume filling factor by
| (A1) |
We require that all flow phases fill the entire available volume, i.e., , to obtain
| (A2) |
For a divergence free spherically expanding flow,
| (A3) |
which, for a flow with a fixed density contrast, results in
| (A4) |
This is identical to equation 12 and suggests that the continuity condition is not due to our choice of formalism.
Consider now a volume filled with a number of different density phases where a phase of density occupies of the volume. If that phase is comprised of identical spherical clouds then the volume of each cloud is . The total surface covered by such clouds is . Thus, the global () covering factor due to this phase is .