Neutralino annihilation in the Large Magellanic Cloud
Abstract
I present results on the expected -ray and synchrotron fluxes due to neutralino annihilation in the Large Magellanic Cloud based on Tasitsiomi et al. (2004).
1 Introduction
Decades of observational evidence indicate that galaxies are surrounded by massive dark matter halos. Of the many candidate dark matter particles that have been proposed, the most popular is the neutralino, . Products of annihilation rapidly decay into neutrinos and -rays, as well as electrons and positrons which emit synchrotron radiation in local magnetic fields. At a distance of 50.1 kpc van der Marel et al. (2002), and given a wealth of observations indicating the existence of significant amounts of dark matter (e.g., van der Marel et al., 2002; Sofue, 1999), the LMC is an obvious choice for neutralino detection.
The flux of both -ray and synchrotron emission from neutralino annihilation in the LMC depends on the square of the density profile of the LMC dark halo. To obtain the density profile we fit the rotation velocity HI data from Kim et al. Kim et al. (1998) and carbon star data from Alves and Nelson Alves and Nelson (2000). We considered a range of density profiles, but here I discuss only the Navarro, Frenk and White (NFW) Navarro et al. (1995, 1996) profile, and a shallower profile – an isothermal sphere with a core as derived in Alves and Nelson (2000) by fitting the same LMC rotation curve data we used. This profile represents a less ideal scenario. Instead of making the assumption of a minimum disk, the stellar disk and gas contributions are included in the model, hence the contribution from the dark matter is confined to smaller values compared with the minimum disk assumption. More details on the various fits to the observed rotation curve are given in Tasitsiomi et al. (2004).
2 The -ray Emission
Neutralino annihilation proceeds through a number of channels, many of which produce -rays in the final state (see e.g., Cesarini et al. (2003)). We considered only the continuum -ray emission due to the decay of neutral pions produced in hadronic jets. Given the uncertainties in the dark matter density distribution, we used the approximate Hill spectrum Hill (1983) to calculate the number of photons above a certain energy threshold, . The simplified spectra derived using this approximation vary from the fit obtained in Bergström et al. (2001) by no more than a factor of a few for neutralino masses from 10 GeV up to a few TeV. The -ray emission coefficient is
| (1) |
The quantity is the thermally averaged cross section times velocity for annihilation into -rays, is the neutralino mass, and is the density profile of the halo. The specific intensities and fluxes, discussed in what follows, are obtained by appropriate integration of the emission coefficient (along lines of sight and over volume, respectively). For more details, see Tasitsiomi et al. (2004).
EGRET detected a flux of photons cm-2 s-1 from the LMC Hartman et al. (1999). Using our fit to the NFW profile and an energy threshold of 100 MeV, the maximum flux produced by a viable SUSY model is photons cm-2 s-1, corresponding to GeV and cm3 s-1. While being consistent with the flux detected by EGRET, even the maximum predicted flux is almost two orders of magnitude too low, suggesting that the primary source is cosmic rays. In fact the cosmic ray induced -rays may be an additional background component to consider when trying to detect flux from neutralino annihilation. Following a method similar to that presented in Pavlidou and Fields (2001), we calculated this cosmic ray induced background.
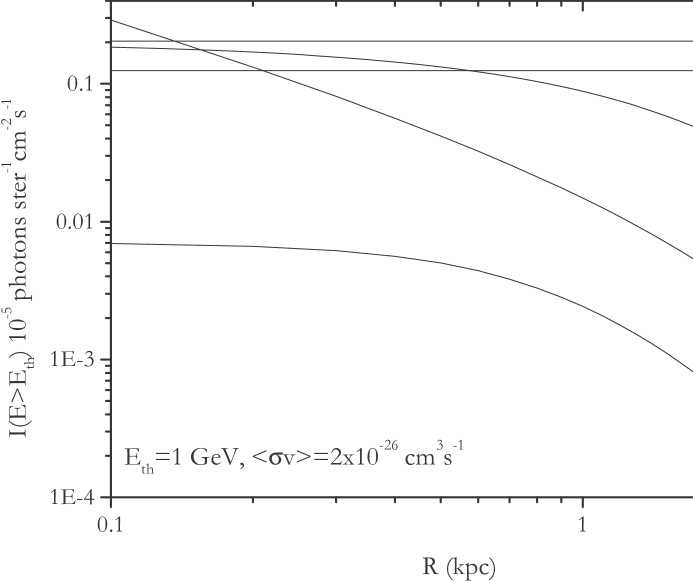
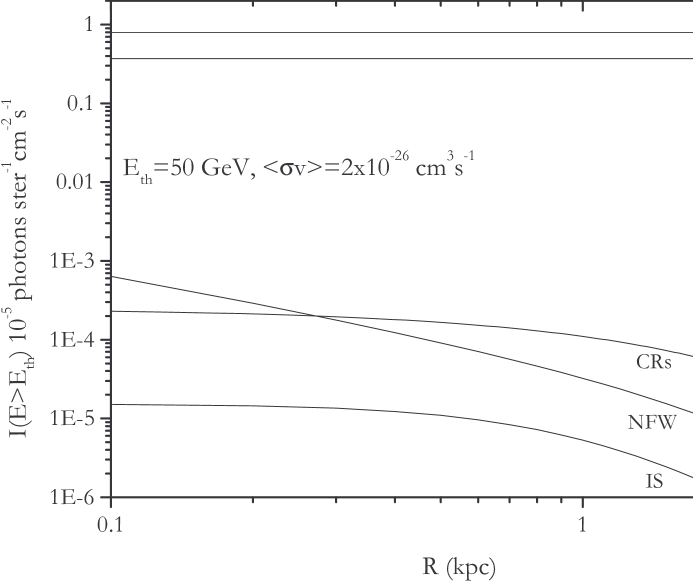
In Figure 1 I show a comparison of the specific intensity of the different backgrounds, as well as that for the NFW profile and the isothermal sphere with a core. The left panel assumes an energy threshold of 1 GeV which is appropriate for GLAST, while the right panel assumes a 50 GeV threshold appropriate for ACTs. For GLAST the relevant backgrounds are the galactic and extragalactic diffuse emission Sreekumar et al. (1998); Bergström et al. (1998) . For ACTs the relevant backgrounds are the hadronic and electronic cosmic ray shower contributions Bergström et al. (1998); Longair (1992), though it is worth noting that ACTs can reject hadronic showers with high efficiency. Clearly, the cosmic ray background is not dominant at these energy thresholds.
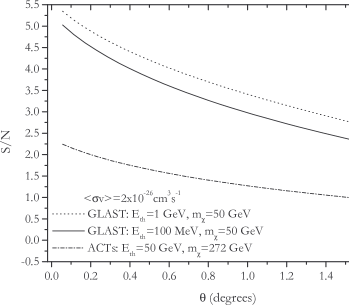
Observationally, the most relevant quantity is the signal-to-noise ratio and its angular and energy dependence. In Figure 2 I present the signal-to-noise for the flux within an angle , assuming the NFW profile. Results are shown for three different energy thresholds with the neutralino parameters for each chosen to optimize the signal. The specifications for each instrument are also indicated. For the noise all the relevant backgrounds, including the cosmic ray induced emission, were used. From the figure it is clear that focusing on the central regions may help to achieve higher signal-to-noise ratios. As expected, for the isothermal sphere with a core (not shown here), the results are less optimistic.
In Fig. 3 I show the parts of the SUSY parameter space that will be detectable. The points represent SUSY models produced using the DarkSUSY package Gondolo et al. (2002). Models with - above a given line are accessible to observation by the corresponding instrument, while models in the lower region do not yield a detectable flux.
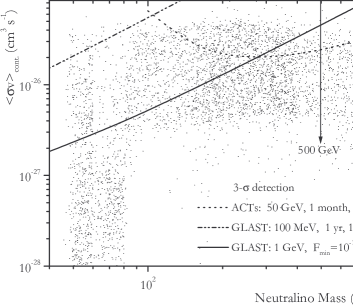
For GLAST, the solid line is derived for the optimistic case of a flux sensitivity of photons cm-2 s-1, which is the expected point source flux sensitivity of GLAST for energies above 1 GeV de Angelis (2000). This flux sensitivity corresponds to a 5- detection and 1 year of on-target observation. If GLAST achieves its expected sensitivity, then it will be able to detect the neutralino signal for a significant portion of the parameter space. This is particularly true in light of the recently derived limit GeV Ellis et al. (2003) (vertical arrow in Fig. 3). If no annihilation signal is detected, the corresponding part of the parameter space can be ruled out. For an energy threshold equal to 100 MeV we take cm2, 1 year of on-target observation and sr for the solid angle relevant for the collection of noise (since the LMC will be resolved by GLAST). With the sensitivity for this energy threshold only a small portion of the parameter space will be detectable (dot-dashed line in Fig. 3). Clearly, the best chance for detection is by using moderate energy thresholds, such as the 1 GeV case, for which the backgrounds are relatively low but the source photons are still numerous. To identify neutralino annihilation as the origin of the observed flux, the spectrum and its characteristic features, such as the cutoff at , may be useful. In addition, monochromatic lines produced by neutralino annihilation (e.g., the line at ) can be useful observational signatures, even though these lines are strongly suppressed (see, e.g., Tasitsiomi and Olinto (2002)).
The detectability prospects for existing and upcoming ACTs are less optimistic. The commonly assumed specifications are cm2, GeV and 100 hours of observation. For these specifications no models will be detectable. A large integration time ( month) and effective area ( cm2) (dotted line in Figure 3) would improve the chances for detection. However, such integration times are fairly long for ACT observations and such large effective areas for an energy threshold of 50 GeV are beyond the goals of existing and upcoming ACTs. Effective areas of order cm2 are expected to be achieved by ACTs for energies TeV, but the number of -rays produced by dark matter annihilation with energies 1 TeV is expected to be zero for models where the upper limit on GeV holds.
3 The synchrotron emission
Neutralino annihilation not only generates neutral pions, but also a comparable number of charged pions. In the presence of magnetic fields, the electrons and positrons produced in this way generate synchrotron radiation. Using again the Hill spectrum for the quark fragmentation, and taking into account synchrotron losses and inverse Compton scattering (ICS) we calculated the synchrotron flux in Jy (1 Jy= ergs cm-2 s-1 Hz-1).
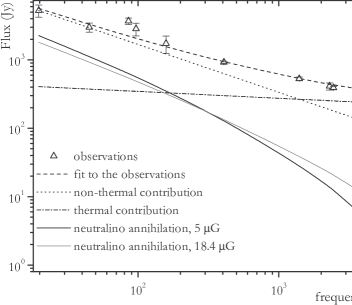
In Figure 4 I show for GeV and cm3 s-1, for the NFW dark matter profile. The thick solid line corresponds to ; the lighter line represents the results for the maximum total magnetic field estimated in literature (18.4 Chi and Wolfendale (1993)). A compilation of radio observations of the LMC from 1959 to 1991 in the frequency range MHz is also shown (Haynes et al., 1991). In the more realistic case of , the neutralino induced synchrotron emission clearly may be part of the observed flux, but is lower than the total observed flux, especially at higher frequencies. In the low frequency region, the signal increases enough to exceed the thermal contribution to the observation.
Clearly, as was the case for the -ray flux, a significant contribution in the osberved radio-emission must be due to CRs. The best hope for distinguishing the synchrotron emission generated by cosmic rays from that produced by neutralino annihilation is to use the fact that the density profile of cosmic rays differs from the dark matter density profile. While the dark matter halo extends significantly beyond the disk, the density of cosmic rays is expected to rapidly decrease at large radii. If low radio frequency observations of the LMC are made with high angular resolution, the change from cosmic ray to neutralino dominance should be apparent as one moves away from the LMC disk. Currently there is no telescope that could carry out observations of the LMC at frequencies less than about MHz. Such low frequencies are extremely difficult to observe from the ground due to ionospheric absorption and scattering. One promising ground-based project is the Low Frequency Array (LOFAR) Röttgering et al. (2003) which should reach frequencies down to 10 MHz and a flux sensitivity of a few Jy in 1 hour. However, the site of the instrument has not yet been decided, so the LMC may not necessarily be observable. To reach even lower frequencies, where ionospheric absorption is very intense, space-based instruments are required. The proposed Astronomical Low Frequency Array (ALFA) Jones et al. (2000) should reach down to MHz.
References
- Tasitsiomi et al. (2004) Tasitsiomi, A., Gaskins, J., and Olinto, A. V., Astropart. Phys., 21, 637 (2004).
- van der Marel et al. (2002) van der Marel, R. P., Alves, D. R., Hardy, E., and Suntzeff, N. B., Astron. J., 124, 2639 (2002).
- Sofue (1999) Sofue, Y., Pub. Astron. Soc. Jap., 51, 445 (1999).
- Kim et al. (1998) Kim, S., Staveley-Smith, L., Dopita, M. A., Freeman, K. C., Sault, R. J., Kesteven, M. J., and McConnell, D., Astrophys. J., 503, 674 (1998).
- Alves and Nelson (2000) Alves, D. R., and Nelson, C. A., Astrophys. J., 542, 789 (2000).
- Navarro et al. (1995) Navarro, J. F., Frenk, C. S., and White, S. D. M., MNRAS, 275, 720 (1995).
- Navarro et al. (1996) Navarro, J. F., Frenk, C. S., and White, S. D., Astrophys. J., 462, 563 (1996).
- Cesarini et al. (2003) Cesarini, A., Fucito, F., Lionetto, A., Morselli, A., and Ullio, P., astro-ph/0305075 (2003).
- Hill (1983) Hill, C. T., Nuclear Physics B, 224, 469 (1983).
- Bergström et al. (2001) Bergström, L., Edsjö, J., and Ullio, P., Phys. Rev. Lett., 87, 251301 (2001).
- Hartman et al. (1999) Hartman, R. C., et al., Astrophys. J. Suppl. Ser., 123, 79 (1999).
- Pavlidou and Fields (2001) Pavlidou, V., and Fields, B. D., Astrophys. J., 558, 63 (2001).
- Sreekumar et al. (1998) Sreekumar, P., et al., Astrophys. J., 494, 523 (1998).
- Bergström et al. (1998) Bergström, L., Ullio, P., and Buckley, J. H., Astroparticle Physics, 9, 137 (1998).
- Longair (1992) Longair, M., High Energy Astrophysics, Cambridge University Press, Cambridge, England, 1992.
- Gondolo et al. (2002) Gondolo, P., Edsjo, J., Ullio, P., Bergstrom, L., Schelke, M., and Baltz, E. A., astro-ph/0211238 (2002).
- de Angelis (2000) de Angelis, A., astro-ph/0009271 (2000).
- Ellis et al. (2003) Ellis, J., Olive, K. A., Santoso, Y., and Spanos, V. C., hep-ph/0303040 (2003).
- Tasitsiomi and Olinto (2002) Tasitsiomi, A., and Olinto, A. V., Phys. Rev. D, 66, 83006 (2002).
- Chi and Wolfendale (1993) Chi, X., and Wolfendale, A. W., Nature, 362, 610 (1993).
- Haynes et al. (1991) Haynes, R. F., et al., Astron. Astrophys., 252, 475 (1991).
- Röttgering et al. (2003) Röttgering, H., de Bruyn, A. G., Fender, R. P., Kuijpers, J., van Haarlem, M. P., Johnston-Hollitt, M., and Miley, G. K., astro-ph/0307240 (2003).
- Jones et al. (2000) Jones, D. L., et al., Advances in Space Research, 26, 743 (2000).