The near-infrared size-luminosity relations for Herbig Ae/Be disks
Abstract
We report the results of a sensitive K-band survey of Herbig Ae/Be disk sizes using the 85-m baseline Keck Interferometer. Targets were chosen to span the maximum range of stellar properties to probe the disk size dependence on luminosity and effective temperature. For most targets, the measured near-infrared sizes (ranging from 0.2 to 4 AU) support a simple disk model possessing a central optically-thin (dust-free) cavity, ringed by hot dust emitting at the expected sublimation temperatures (1000-1500K). Furthermore, we find a tight correlation of disk size with source luminosity for Ae and late Be systems (valid over more than 2 decades in luminosity), confirming earlier suggestions based on lower-quality data. Interestingly, the inferred dust-free inner cavities of the highest luminosity sources (Herbig B0-B3 stars) are under-sized compared to predictions of the “optically-thin cavity” model, likely due to optically-thick gas within the inner AU.
1 Introduction
Young stellar objects (YSOs) are often observed to be surrounded by an optically-thick accretion disk, presumably left-over from early stages of star formation. These disks are expected to evolve into optically-thin “debris” disks as the circumstellar material either accretes onto the central star, is blown out of the system, or coagulates into planetessimals. The disappearance of the optically-thick protostellar accretion disk thus marks a transition between the final stages of star formation and the onset of planet formation. High angular resolution studies of these transition disks effectively test our physical models of accretion as well as reveal the initial conditions for planet-building. In particular, infrared interferometers directly probe the temperature and density structure of gas and dust within the inner AU of YSO disks, critical ingredients in any recipe for planet formation.
Millan-Gabet et al. (1999) first discovered the marked discrepancy between theoretical predictions and the observed near-infrared (NIR) sizes of Herbig Ae/Be stars using the Infrared-Optical Telescope Array (IOTA) Interferometer – the AB Aur disk was found to be many times larger than expected.111In this paper, the “disk size” generally refers to the extent of the disk emission at a particular wavelength, not the physical extent of all the disk material. This pattern has been confirmed again and again, with “large” disk sizes for Herbig Ae/Be stars being found by Keck aperture masking (Tuthill et al. 2001; Danchi et al. 2001), additional IOTA work (Millan-Gabet et al. 2001a), and Palomar Testbed Interferometer observations (Akeson et al. 2000, 2002; Eisner et al. 2003, 2004). More recently, a similar pattern has been found for bright T Tauri disks too (Akeson et al. 2005, 2000; Colavita et al. 2003).
Popular disk theories of that time (e.g., Lynden-Bell & Pringle 1974; Adams et al. 1987; Calvet et al. 1991; Hillenbrand et al. 1992; Hartmann et al. 1993; Chiang & Goldreich 1997) incorporated an optically-thick, geometrically-thin disk (with flaring, which is not so relevant for NIR wavelengths). In these models, the optically-thick disk midplane shields inner dust from much of the stellar radiation, thus hot dust near sublimation temperature () can exist quite close to the star. Interferometer measurements showed this emission to be much further from the stars than these models predicted, thus arose the size controversy. About the same time, Natta et al. (2001) revisited the problem of the unrealistically high accretion rates inferred for some Herbig Ae/Be stars (based on NIR excess; Hillenbrand et al. 1992; Hartmann et al. 1993) using spectroscopic observations from the Infrared Space Observatory (ISO). These two observational “problems” would be resolved by the same solution.
First suggested by Tuthill et al. (2001) and independently developed by Natta et al. (2001) and Dullemond et al. (2001), the large disk sizes and excess NIR flux were naturally explained by the presence of an optically-thin cavity surrounding the star. Thus, the innermost disk is not optically thick, presumably because dust, which is the primary source of opacity for , is absent due to evaporation by the stellar radiation field. This geometry explains the NIR excess flux as well since a frontally-illuminated dust wall efficiently emits in the NIR. Interestingly, earlier modellers had already realized the inner cavity would be devoid of dust due to the high temperatures (e.g., Hillenbrand et al. 1992), but the temperature profile adopted by these workers still implicitly incorporated an optically-thick disk midplane. These central cavities are not necessarily devoid of gas; indeed, the optical depth of the gas depends on many factors (most notably, the accretion rate and geometry). Central clearings in YSO disks are not only interesting in the context of accretion disk physics but have been implicated in halting migration of the extrasolar hot Jupiter planets (Kuchner & Lecar 2002).
Monnier & Millan-Gabet (2002) put the “optically-thin cavity” model to the most stringent test thus far by analyzing the full set of published interferometer measurements (including both T Tauri and Herbig Ae/Be stars for the first time) and found overall consistency through the use of a “size-luminosity” diagram. This diagram is particularly powerful because the inner radius of dust destruction is nearly independent of stellar temperature and almost a pure function of luminosity. This work also uncovered evidence for possible absorption by the gaseous inner disk of the most luminous sources in the sample, although interpretation was limited by significant data scatter due (at least in part) to the heterogeneous nature of the datasets.
Recently, Eisner et al. (2003, 2004) made significant contributions to the studies of these disks in a number of ways. Firstly, they measured elongated NIR emission from some Herbigs, evidence for disk-like structure that had eluded the shorter-baseline IOTA work. Furthermore, the size-luminosity relations of Monnier & Millan-Gabet (2002) were confirmed for the Herbig Ae stars. Perhaps most interestingly, Eisner et al. (2004) presented the clearest evidence to-date for under-sized disk emission around the early B stars in their sample. In fact, the NIR sizes of these disks were found consistent with the “classical” optically-thick, geometrically-thin disk models.
Within this context, our group has carried out a survey of YSOs as part of “shared-risk” commissioning of the Keck Interferometer. The Keck Interferometer boasts 10100 the sensitivity over previous-generation instruments, allowing a large number of Herbig Ae/Be, T Tauris, and FU Orionis objects to be targeted. In order to extend beyond existing work, we designed our survey as follows. First, great care was taken to choose targets with reliable spectral types and luminosities (early interferometers could detect relatively few targets and many had ambiguous classifications). Second, the greater instrumental sensitivity allowed us to probe systems spanning a larger range of spectral types and stellar luminosities.
Here we report our results for the Herbig Ae/Be portion of the survey, where we have significantly reduced the observational “scatter” that hampered previous studies. With the improved data quality, we can definitively characterize the size-luminosity relations of Herbig Ae/Be disks.
2 Observations
The Keck Interferometer (KI) was used during its visibility science commissioning period (2002-2004) to observe 14 Herbig Ae/Be stars as part of this survey (see Table 1). The KI is formed by two 10-m aperture telescopes (each consisting of 36 hexagonal mirror segments) separated by 85 m along a direction 38 degrees East of North, corresponding to a minimum fringe spacing of 5.3 milli-arcseconds at 2.2m. In order to coherently combine the NIR light from such large apertures, each telescope utilizes a natural guide star adaptive optics system (Wizinowich et al. 2003). Optical delay lines correct for sidereal motion and the telescope beams are combined at a beamsplitter before the light is focused onto single-mode (fluoride) fibers which impose a 50 milliarcsecond (FWHM) field-of-view for all data reported herein. While both H and K-band observations are now possible, only broad K-band (2.18m, m) data are reported here. Owing to the large apertures and excellent site, the Keck Interferometer is currently the world’s most sensitive infrared interferometer, recently becoming the first such instrument to measure fringes on an extra-galactic object (Swain et al. 2003). Further technical details can be found in recent Keck Interferometer publications (Colavita et al. 2003; Colavita & Wizinowich 2003, 2000).
Table 1 summarizes the basic properties of the target stars, including spectral type, distance, luminosity, and literature references for photometry used herein. Calibration of fringe data was performed by interspersing target observations with those of unresolved calibrators (see Table 2). The square of the fringe visibility (V2) was measured using the ABCD-method (using a dither mirror; see also Shao & Staelin 1977) and we followed the well-tested strategies described for the Palomar Testbed Interferometer (Colavita 1999), except that corrections for uneven telescope ratios were improved and jitter corrections were not applied. We refer the reader to Colavita et al. (2003) and Swain et al. (2003) for further description of calibration procedures.
The calibrated V2 results appear in Table 3 along with with the projected baseline (u,v) and date for each independent dataset. The V2 errors reported in this table only include statistical errors. Internal data quality checks have established a conservative upper limit to the systematic error . Model fitting in this paper includes both sources of error in the uncertainty analysis.
3 Methodology
In this study, we wish to measure the characteristic NIR sizes of YSO accretion disks. By using a target sample spanning a wide range of stellar properties, we aim also investigate the size dependence on stellar luminosity. Interferometers have been successfully used to resolve stars since 1921 (Michelson & Pease 1921), and a full discussion of the methodology will not be given here. A single-baseline interferometer can effectively determine the characteristic size of an astronomical object by measuring the fringe “visibility,” a measure of the fringe contrast; unresolved sources produce high contrast fringes (visibility unity) while resolved objects have low visibility (for further discussion, see Thompson et al. 2001). Visibility data can be converted into a quantitative “size” estimate by using a model for the brightness distribution and applying a Fourier Transform. Since we can not image the disks directly yet, we must adopt a simple empirical model capable of parameterizing the spatial extent of the disk emission.
Monnier & Millan-Gabet (2002) discuss the merits of using a “ring” model for describing the NIR emission from a circumstellar disk, based on the argument that only the hottest dust at the inner edge of the disk can contribute significantly to the NIR emission (see also Natta et al. 2001). Ring models have been fit to visibility data by other workers in the field as well (Millan-Gabet et al. 2001b; Eisner et al. 2003, 2004). Furthermore, the first imaging results for the LkH 101 disk (Tuthill et al. 2001) appear to support this class of models.
We have fitted our visibility data with a simple model consisting of a point source (representing the unresolved stellar component) and a thin (circular) ring with average diameter (representing the circumstellar dust emission). The thickness of the ring can not be easily constrained for measurements on the main lobe of the visibility curve (i.e, when the fringe spacing is less than the ring diameter) and thus our results are only sensitive to the average ring diameter, not the ring thickness. For the fits reported here, we have used a uniform brightness ring with a fractional thickness of 20%, inspired by the LkH 101 image.
Because our interferometer measurements lack the requisite (u,v) coverage to fully constrain our ring model, the fraction of the total K-band emission coming from the disk must be estimated separately through SED fitting. This method was first applied to interferometry observations of YSOs by Millan-Gabet et al. (1999) and is now in common usage (Millan-Gabet et al. 2001a; Akeson et al. 2000, 2002; Eisner et al. 2003, 2004). Here, we fit the broadband SED with a two-component model, consisting of a stellar spectrum and a single-temperature dust blackbody. We have slightly improved on the standard procedure by using a Kurucz model (Kurucz 1979) for the underlying stellar spectrum instead of a simple blackbody, which makes some difference for sources with small IR excess or cool stellar atmospheres. Reddening of the central star must also be included in the fit, and here we adopted the reddening law from Mathis (1990); this choice affects our (de-reddened) luminosity estimates for the most obscured targets.
Figure 1a shows an example of our spectral decomposition for the A8V target HD 142666; the two-component fit is quite acceptable. From the fitting results, only two parameters are used in subsequent analysis: the K-band IR excess and the star luminosity (in cases where good literature estimates are unavailable; see Table 1). In particular, the best-fit dust temperature and flux are not directly used in visibility fitting since the ring model is purely geometric. We note that scattered stellar light can not be distinguished from direct stellar emission in the SED, thus the point source component might be somewhat underestimated; this effect is minimized by observing at K band, where scattering is much less efficient than for J or H bands.
Because YSOs are often variable sources, we were concerned with making reliable estimates of the K-band IR excess based on non-contemporaneous photometry. We have adopted the following procedure to conservatively estimate our observational uncertainties. We created multiple synthetic SEDs using various combinations of visible (typically, B,V,R) and infrared photometric datasets drawn from the literature. For each SED we obtained an estimate of the fraction of light at K-band arising from the circumstellar dust through model-fitting. The fitting results for the IR excess naturally depended on the exact photometry data used, and this variation was quantified (typically 10%) and reported in Table 4 for all targets. The “best estimate” was based on the SED with the most recent IR photometry (usually from 2MASS).
Once the NIR excess has been separately estimated, a ring model can be fit to the KI visibility data with only one free parameter, the ring diameter (having already adopted a 20% ring thickness). This process is illustrated for HD 142666 in Figure 1b, showing fitting results for 3 different estimates of the fraction of K-band emission coming from the dust component (“dust fraction”). Table 4 contains the complete fitting results for all sources, listing the ring diameters along with errors including both the visibility measurement error and our uncertainty in dust fraction. The reported uncertainty in the ring diameter is often dominated by our uncertainty in estimating the dust fraction, instead of measurement errors.
With our current single-baseline observations, we are unable to detect disk elongations if present, such as those reported by Eisner et al. (2003, 2004). Based on these workers’ data, we can expect up to a 50% variation in ring diameter depending on the orientation of the disk on the sky, and this source of scatter will be discussed further in §4.1.
4 Results
The results of our model fits can be found in Table 4. All but one source were resolved by the Keck Interferometer (the transition object HD 141569 was unresolved), and the ring diameters ranged from 1.5 mas to 4 mas. In order to compare the ring diameters of different sources, we have converted angular diameters (milliarcseconds) into physical sizes (AU) using the estimated distances (drawn from the literature), and these values are also tabulated.
A few of our survey targets (MWC 758, HD 141569, v1685 Cyg, v1977 Cyg) were observed recently by Eisner et al. (2004) using the Palomar Testbed Interferometer (PTI). Comparing average ring diameter results, we find that PTI and KI results agree at the 1-2 level. This reasonable agreement suggests that neither experiment is contaminated with large-scale scattered light, since the PTI experiment has a 20 larger field-of-view than the KI observations. While agreement between these two datasets is generally satisfactory, we note an apparent inconsistency between the PTI and KI data for v1685 Cyg along one particular position angle. The current PTI data has a relatively low signal-to-noise ratio, making a definitive comparison uncertain; future work will investigate this apparent discrepancy in more detail.
4.1 Size-Luminosity Diagram
In order to investigate specific accretion disk models, we wish to compare the observed physical sizes of the NIR emission to model predictions. Since the NIR emission should be dominated by hot dust at the inner edge of the dusty disk, we expect the truncation radius to be some function of the stellar luminosity. Thus, we have plotted our results on a size-luminosity diagram (Figure 2) using the parameters compiled in Table 1, as first described in Monnier & Millan-Gabet (2002). Since we have used a ring model for our emission geometry, the ring radius (which we measured by fitting to the visibility data) can be identified with the dust destruction radius, the location where the dust temperature exceeds the sublimation temperature.
In Figure 2, we compare our observational results to predictions of a simple physical model for the dusty circumstellar environment. Here, we assume the star is surrounded by an optically-thin cavity and that dust is distributed in a disk geometry at larger radii. The size of the inner cavity is set by the dust sublimation radii (for sublimation temperature ) and can be calculated from basic radiation transfer (see Figure 3a for schematic drawing). In this model, spherical dust grains at the inner edge are in thermal equilibrium with the unobscured central star of luminosity , leading to a standard result (Monnier & Millan-Gabet 2002):
| (1) |
where the ratio of the dust absorption efficiencies for radiation at color temperature T of the incident and reemitted field respectively.
We note that the sublimation radius derived by Dullemond et al. (2001, see Eq. 14) is a factor of 2 times larger than Eq. 1, since these workers assume the dust forms an optically-thick “hot inner wall” at . Recent work by Whitney et al. (2004) found sublimation radii close to that expected in this optically-thick limit. In reality, will be between these limits depending how abruptly the dust becomes optically thick as a function of radius.
Inspection of Figure 2 reveals that Herbig targets between have ring radii consistent with the calculated dust sublimation radii for sublimation temperatures 1000-1500K, and the observed sizes are tightly correlated with stellar luminosity. The data points in the Keck Interferometer size-luminosity diagram show much less scatter around the trendlines than was seen in previous studies (especially, Monnier & Millan-Gabet 2002). We owe the reduced scatter to the homogeneous nature of our dataset and the improvements in the experimental methodology, including better target vetting for reliable spectral types, higher angular resolution, use of K band (instead of H band) and smaller field-of-view to reject scattered light, and lastly higher signal-to-noise ratio. These high-quality data offer definitive confirmation of the size-luminosity relations for Herbig Ae and late Be disks, strong evidence for the optically-thin cavity model.
The remaining size scatter of about 50% is likely due to inclination effects, consistent with the range of elongations observed by Eisner et al. (2003, 2004). Further evidence for this comes from the fact that UX Ori, which is widely believed to be viewed at high inclination angle (e.g., Natta et al. 1999), is one of the most extreme targets in Figure 2, showing the lowest apparent sublimation temperature. We note that our visible-light sensitivity limit () introduces a bias against edge-on sources if the disk heavily obscures the star.
We appreciate that the true NIR brightness distribution of YSO disks may not be adequately described by the ring model adopted here, despite our sound scientific motivations. Only future imaging work by IOTA, CHARA, and/or VLTI interferometers will unambiguously establish the true emission geometry. However, regardless of the exact emission morphology, the size-luminosity trends presented here should still remain valid if the targets in our sample share a common emission geometry.
4.2 “Under-sized” disks around high luminosity sources
While the “optically-thin cavity” model can explain the observed sizes of Herbig Ae and late Be stars, the higher luminosity (high-L) sources clearly deviate from the model predictions. These measured disk sizes are many times too small to be consistent with the size-luminosity relations found for the lower luminosity sources. While our sample only contains two such sources, v1685 Cyg (B3) and Z CMa A (B0?), the results must be taken seriously given the unambiguous discrepancy that can not be explained by known sources of uncertainty (however, see §4.3 for specific discussion of the problematic Z CMa system).
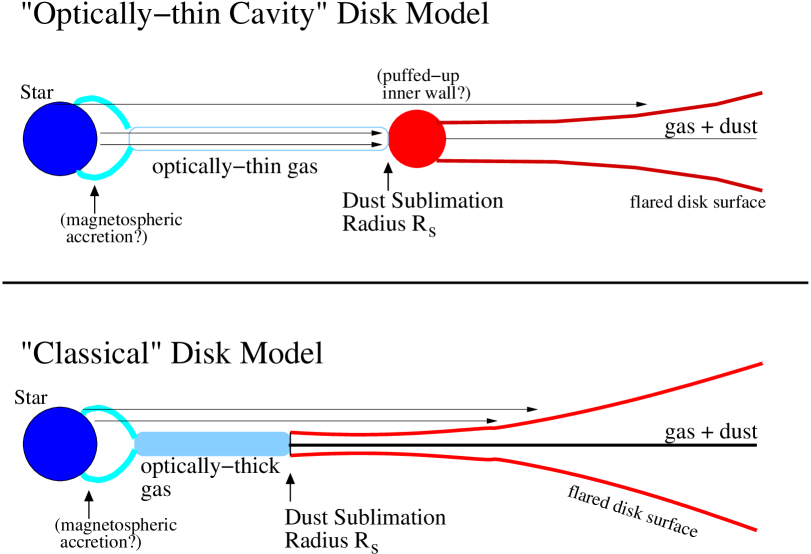
In order to investigate this further, we have calculated the dust sublimation radii for an alternate disk model: the “classical” optically-thick, geometrically thin disk model for 1500 K and 1000 K (e.g., Hillenbrand et al. 1992; Millan-Gabet et al. 2001a). The main difference from the previous model is that a thin disk of gas acts to shield the dusty disk from direct stellar illumination. Thus, the expected sublimation radii are significantly smaller than for the corresponding optically-thin cavity model. Figure 3 contains a sketch contrasting the two model geometries under investigation here.
The dust destruction radius for the classical accretion disk model is not a pure function of luminosity (see above references for derivation of analytical formulation) and thus a separate model estimate must be made for each target based on specific stellar parameters. The results of this calculation are plotted in Figure 4 along with the Keck Interferometer disk sizes and the previously-derived size-luminosity relations (e.g., Eq. 1). Here we see that the high-L targets are fit better by “classical” accretion disk models than by the optically-thin cavity models, confirming recent analysis of Eisner et al. (2004, based on v1685 Cyg, MWC 1080, and MWC 297).
We can look for further confirmation of this trend by re-considering the results of Monnier & Millan-Gabet (2002). These authors also found many high-L disks to have “undersized” emission, although a few notable targets showed order-of-magnitude larger sizes than their high-L peers. Notably, MWC 349 and LkH 101 (targets resolved by aperture masking) were much larger than their counterparts measured with long-baseline interferometry. Perhaps these sources represent more evolved systems where strong stellar winds have either cleared the inner disk of gas or photo-evaporation has eroded the inner disk. Regardless, our Keck Interferometer results reveal a population of high-luminosity YSOs with disk sizes much smaller than possible for models with optically-thin inner cavities.
In summary, our new Keck Interferometer data support the conclusions of previous studies that some high-luminosity (early Herbig Be) stars show evidence for significant gaseous inner disks. There appears to be a diversity of such disks, from those consistent with completely optically-thick disk midplanes (Eisner et al. 2004, and this work) to those with intermediate-tau inner cavities (perhaps optically-thick only in the ultraviolet; see Monnier & Millan-Gabet 2002). We note that dust destruction radii data alone can not directly constrain the geometry of the inner gaseous material – a completely optically-thick midplane has a similar effect to an intermediate-tau spherical gas distribution. In order to distinguish between these scenarios, one must incorporate other observations that also probe the inner accretion disk, such as mid-infrared disk sizes (e.g., recently reported by Hinz et al. 2001; Leinert et al. 2004) and high-resolution spectroscopy of the molecular gas (e.g., Najita et al. 2003; Brittain et al. 2003).
4.3 Comments on individual sources
HD 141569: HD 141569, the only unresolved target in our survey, is thought to be in a transition stage between pre-main sequence disk and debris disk. Although disk structures can be seen in scattered light (Clampin et al. 2003), SED modeling by Li et al. (2003) (and others) suggest that nearly all the NIR emission is from the star and that the disk emits significant radiation only at longer wavelengths. Our own SED-fitting and Keck interferometry data support this picture.
UX Ori: UX Ori is the prototype of pre-main sequence objects showing deep visual minima interpreted as obscuration by dust clouds. UXOR behavior is thought to arise for YSOs (typically Herbig Ae/Be stars) which are viewed at high inclination (e.g., Natta et al. 1999), such that our line-of-sight partially intercepts the accretion disk. Under these conditions, we expect the simple “ring” emission geometry (assumed here for visibility fitting) to break down. As we discussed in §4.1, UX Ori has a relatively large disk size, showing a deviation from the mean size-luminosity relations of Figure 2. The NIR emission of UX Ori is likely not ring-like and we may be seeing scattered light if the inner disk emission is partially obscured by the outer flared disk. Clearly, UX Ori is a prime target for interferometric imaging with VLTI and CHARA.
HD 58647: According to Figure 2, this disk is unusually small considering its luminosity. In fact, it has the hottest inferred dust sublimation temperature of the low-luminosity Herbigs. Recently, Manoj et al. (2002) argued that this source is more likely a classical Be star rather than a pre-main-sequence object. Indeed, if the NIR emission is partly arising from free-free (gas) emission, we would expect the observed interferometric size to be small.
Z CMa: This binary source consists of a Herbig (Z CMa A) and an FU Orionis object (Z CMa B) in a close ( milliarcsecond) orbit (e.g., Garcia et al. 1999; Koresko et al. 1991). The Keck Interferometer was able to observe both sources independently using the 50 milliarcsecond resolution of the adaptive optics system (the FUOR component will be treated in Millan-Gabet et al., in preparation). Determining the photometric contributions of the two components separately is problematic due to strong variability and the small angular separation.
This source is also highly embedded (Hartmann et al. 1989; Whitney et al. 1993) and thus the applicability of the “ring model” for describing the NIR emission is suspect. In addition, the spectral type and luminosity of the Herbig component is highly uncertain – with a factor of 100 in luminosity separating two reasonable estimates. We adopt a lower limit of 3000 L⊙ here based on the bolometric luminosity of the system (Hartmann et al. 1989), while an upper limit of 310000 L⊙ comes from de-reddening an assumed B0III spectral type (van den Ancker et al. 2004). Obviously this large luminosity uncertainty makes definitive analysis of the Keck Interferometer data impossible, and we encourage follow-up spectroscopic and interferometric observations to confirm the properties of this unique and challenging source.
5 Conclusions
We have definitively measured the near-infrared size-luminosity relations for disks around Herbig Ae/Be stars for . Valid over more than 2 decades in stellar luminosity , the NIR sizes obey the simple scaling relation . This relation is predicted by the “optically-thin cavity” model for YSO disks (Tuthill et al. 2001; Natta et al. 2001; Monnier & Millan-Gabet 2002) and our results imply dust sublimation temperatures in the expected range of .
In contrast, the infrared sizes of circumstellar disks for the high-luminosity sources in our sample () are more consistent with optically-thick inner disks, supporting recent conclusions of Eisner et al. (2004). Significant gas in the inner disk midplane could explain these observational results, although the gas spatial distribution is not directly constrained here. Exceptions to this trend are notable (LkH 101 and MWC 349, reported elsewhere), perhaps signaling the clearing of the inner gaseous disk by the strong stellar winds and ionizing radiation from evolved O and early B stars.
Future work will progress on two fronts, one theoretical and the other observational. We will focus on using state-of-the-art physical models to fit SEDs and visibilities at both near-IR and mid-IR wavelengths. Such work will allow us to move beyond merely-qualitative tests of new disk models (e.g., the DDN models, Dullemond et al. 2001), for instance by quantifying the optical depth and geometry of the inner gaseous disk. These studies will provide the density and temperature profiles needed for studies of planet formation.
To advance observationally, more single-baseline data are still needed for classical T Tauri disks (Akeson et al., in preparation), FU Orionis stars (Millan-Gabet et al., in preparation), and also for the highest luminosity sources. In contrast, studies of Herbig Ae disks will not be significantly advanced with more single-baseline data, given the (now) large body of existing results; Herbig Ae disks should now be imaged to make additional progress. With closure phase imaging from IOTA, VLTI and/or CHARA interferometers, we will test predictions of the next-generation of physical models, such as those incorporating a “puffed-up inner wall” (DDN).


References
- Adams et al. (1987) Adams, F. C., Lada, C. J., & Shu, F. H. 1987, ApJ, 312, 788
- Akeson et al. (2002) Akeson, R. L., Ciardi, D. R., van Belle, G. T., & Creech-Eakman, M. J. 2002, ApJ, 566, 1124
- Akeson et al. (2000) Akeson, R. L., Ciardi, D. R., van Belle, G. T., Creech-Eakman, M. J., & Lada, E. A. 2000, ApJ, 543, 313
- Akeson et al. (2005) Akeson, R. L., Walker, C. H., Wood, K., Eisner, J. A., Scire, E., Penprase, B., Ciardi, D. R., van Belle, G. T., Whitney, B., & Bjorkman, J. E. 2005, ApJ, 0, 0
- Beskrovnaya et al. (1999) Beskrovnaya, N. G., Pogodin, M. A., Miroshnichenko, A. S., Thé, P. S., Savanov, I. S., Shakhovskoy, N. M., Rostopchina, A. N., Kozlova, O. V., & Kuratov, K. S. 1999, A&A, 343, 163
- Brittain et al. (2003) Brittain, S. D., Rettig, T. W., Simon, T., Kulesa, C., DiSanti, M. A., & Dello Russo, N. 2003, ApJ, 588, 535
- Calvet et al. (1991) Calvet, N., Patino, A., Magris, G. C., & D’Alessio, P. 1991, ApJ, 380, 617
- Chiang & Goldreich (1997) Chiang, E. I. & Goldreich, P. 1997, ApJ, 490, 368
- Clampin et al. (2003) Clampin, M., Krist, J. E., Ardila, D. R., Golimowski, D. A., Hartig, G. F., Ford, H. C., Illingworth, G. D., Bartko, F., Benítez, N., Blakeslee, J. P., Bouwens, R. J., Broadhurst, T. J., Brown, R. A., Burrows, C. J., Cheng, E. S., Cross, N. J. G., Feldman, P. D., Franx, M., Gronwall, C., Infante, L., Kimble, R. A., Lesser, M. P., Martel, A. R., Menanteau, F., Meurer, G. R., Miley, G. K., Postman, M., Rosati, P., Sirianni, M., Sparks, W. B., Tran, H. D., Tsvetanov, Z. I., White, R. L., & Zheng, W. 2003, AJ, 126, 385
- Colavita et al. (2003) Colavita, M., Akeson, R., Wizinowich, P., Shao, M., Acton, S., Beletic, J., Bell, J., Berlin, J., Boden, A., Booth, A., Boutell, R., Chaffee, F., Chan, D., Chock, J., Cohen, R., Crawford, S., Creech-Eakman, M., Eychaner, G., Felizardo, C., Gathright, J., Hardy, G., Henderson, H., Herstein, J., Hess, M., Hovland, E., Hrynevych, M., Johnson, R., Kelley, J., Kendrick, R., Koresko, C., Kurpis, P., Le Mignant, D., Lewis, H., Ligon, E., Lupton, W., McBride, D., Mennesson, B., Millan-Gabet, R., Monnier, J., Moore, J., Nance, C., Neyman, C., Niessner, A., Palmer, D., Reder, L., Rudeen, A., Saloga, T., Sargent, A., Serabyn, E., Smythe, R., Stomski, P., Summers, K., Swain, M., Swanson, P., Thompson, R., Tsubota, K., Tumminello, A., van Belle, G., Vasisht, G., Vause, J., Walker, J., Wallace, K., & Wehmeier, U. 2003, ApJ, 592, L83
- Colavita (1999) Colavita, M. M. 1999, PASP, 111, 111
- Colavita & Wizinowich (2000) Colavita, M. M. & Wizinowich, P. L. 2000, in Proc. SPIE Vol. 4006, p. 310-320, Interferometry in Optical Astronomy, Pierre J. Lena; Andreas Quirrenbach; Eds., 310–320
- Colavita & Wizinowich (2003) Colavita, M. M. & Wizinowich, P. L. 2003, in Interferometry for Optical Astronomy II. Edited by Wesley A. Traub. Proceedings of the SPIE, Volume 4838, pp. 79-88 (2003)., 79–88
- Cutri et al. (2003) Cutri, R. M., Skrutskie, M. F., van Dyk, S., Beichman, C. A., Carpenter, J. M., Chester, T., Cambresy, L., Evans, T., Fowler, J., Gizis, J., Howard, E., Huchra, J., Jarrett, T., Kopan, E. L., Kirkpatrick, J. D., Light, R. M., Marsh, K. A., McCallon, H., Schneider, S., Stiening, R., Sykes, M., Weinberg, M., Wheaton, W. A., Wheelock, S., & Zacarias, N. 2003, VizieR Online Data Catalog, 2246, 0
- Danchi et al. (2001) Danchi, W. C., Tuthill, P. G., & Monnier, J. D. 2001, ApJ, 562, 440
- Dullemond et al. (2001) Dullemond, C. P., Dominik, C., & Natta, A. 2001, ApJ, 560, 957
- Dunkin et al. (1997) Dunkin, S. K., Barlow, M. J., & Ryan, S. G. 1997, MNRAS, 286, 604
- Eisner et al. (2003) Eisner, J. A., Lane, B. F., Akeson, R. L., Hillenbrand, L. A., & Sargent, A. I. 2003, ApJ, 588, 360
- Eisner et al. (2004) Eisner, J. A., Lane, B. F., Hillenbrand, L. A., Akeson, R. L., & Sargent, A. I. 2004, ApJ, 613, 1049
- ESA (1997) ESA. 1997, VizieR Online Data Catalog, 1239, 0
- Friedemann et al. (1993) Friedemann, C., Riemann, H. G., Gurtler, J., & Toth, V. 1993, A&A, 277, 184
- Garcia et al. (1999) Garcia, P. J. V., Thiébaut, E., & Bacon, R. 1999, A&A, 346, 892
- Gezari et al. (1999) Gezari, D. Y., Pitts, P. S., & Schmitz, M. 1999, VizieR Online Data Catalog, 2225, 0
- Hartmann et al. (1993) Hartmann, L., Kenyon, S. J., & Calvet, N. 1993, ApJ, 407, 219
- Hartmann et al. (1989) Hartmann, L., Kenyon, S. J., Hewett, R., Edwards, S., Strom, K. M., Strom, S. E., & Stauffer, J. R. 1989, ApJ, 338, 1001
- Hernández et al. (2004) Hernández, J., Calvet, N., Briceño, C., Hartmann, L., & Berlind, P. 2004, AJ, 127, 1682
- Hillenbrand et al. (1992) Hillenbrand, L. A., Strom, S. E., Vrba, F. J., & Keene, J. 1992, ApJ, 397, 613
- Hinz et al. (2001) Hinz, P. M., Hoffmann, W. F., & Hora, J. L. 2001, ApJ, 561, L131
- Høg et al. (2000) Høg, E., Fabricius, C., Makarov, V. V., Urban, S., Corbin, T., Wycoff, G., Bastian, U., Schwekendiek, P., & Wicenec, A. 2000, A&A, 355, L27
- Joint IRAS Science Working Group (1988) Joint IRAS Science Working Group. 1988, in IRAS Point Source Catalog (1988), 0–+
- Kharchenko (2001) Kharchenko, N. V. 2001, Kinematika i Fizika Nebesnykh Tel, 17, 409
- Koresko et al. (1991) Koresko, C. D., Beckwith, S. V. W., Ghez, A. M., Matthews, K., & Neugebauer, G. 1991, AJ, 102, 2073
- Kuchner & Lecar (2002) Kuchner, M. J. & Lecar, M. 2002, ApJ, 574, L87
- Kurucz (1979) Kurucz, R. L. 1979, ApJS, 40, 1
- Lada (1985) Lada, C. J. 1985, ARA&A, 23, 267
- Leinert et al. (2004) Leinert, C., van Boekel, R., Waters, L. B. F. M., Chesneau, O., Malbet, F., Köhler, R., Jaffe, W., Ratzka, T., Dutrey, A., Preibisch, T., Graser, U., Bakker, E., Chagnon, G., Cotton, W. D., Dominik, C., Dullemond, C. P., Glazenborg-Kluttig, A. W., Glindemann, A., Henning, T., Hofmann, K.-H., de Jong, J., Lenzen, R., Ligori, S., Lopez, B., Meisner, J., Morel, S., Paresce, F., Pel, J.-W., Percheron, I., Perrin, G., Przygodda, F., Richichi, A., Schöller, M., Schuller, P., Stecklum, B., van den Ancker, M. E., von der Lühe, O., & Weigelt, G. 2004, A&A, 423, 537
- Li et al. (2003) Li, A., Lunine, J. I., & Bendo, G. J. 2003, ApJ, 598, L51
- Lynden-Bell & Pringle (1974) Lynden-Bell, D. & Pringle, J. E. 1974, MNRAS, 168, 603
- Manoj et al. (2002) Manoj, P., Maheswar, G., & Bhatt, H. C. 2002, MNRAS, 334, 419
- Mathis (1990) Mathis, J. S. 1990, ARA&A, 28, 37
- Meeus et al. (2001) Meeus, G., Waters, L. B. F. M., Bouwman, J., van den Ancker, M. E., Waelkens, C., & Malfait, K. 2001, A&A, 365, 476
- Michelson & Pease (1921) Michelson, A. A. & Pease, F. G. 1921, ApJ, 53, 249
- Millan-Gabet & Monnier (2002) Millan-Gabet, R. & Monnier, J. D. 2002, ApJ, 580, L167
- Millan-Gabet et al. (2001a) Millan-Gabet, R., Schloerb, F. P., & Traub, W. A. 2001a, ApJ, 546, 358
- Millan-Gabet et al. (2001b) —. 2001b, ApJ, 546, 358
- Millan-Gabet et al. (1999) Millan-Gabet, R., Schloerb, F. P., Traub, W. A., Malbet, F., Berger, J. P., & Bregman, J. D. 1999, ApJ, 513, L131
- Monnier & Millan-Gabet (2002) Monnier, J. D. & Millan-Gabet, R. 2002, ApJ, 579, 694
- Mora et al. (2001) Mora, A., Merín, B., Solano, E., Montesinos, B., de Winter, D., Eiroa, C., Ferlet, R., Grady, C. A., Davies, J. K., Miranda, L. F., Oudmaijer, R. D., Palacios, J., Quirrenbach, A., Harris, A. W., Rauer, H., Cameron, A., Deeg, H. J., Garzón, F., Penny, A., Schneider, J., Tsapras, Y., & Wesselius, P. R. 2001, A&A, 378, 116
- Morel & Magnenat (1978) Morel, M. & Magnenat, P. 1978, A&AS, 34, 477
- Morrison et al. (2001) Morrison, J. E., Röser, S., McLean, B., Bucciarelli, B., & Lasker, B. 2001, AJ, 121, 1752
- Najita et al. (2003) Najita, J., Carr, J. S., & Mathieu, R. D. 2003, ApJ, 589, 931
- Natta et al. (1999) Natta, A., Prusti, T., Neri, R., Thi, W. F., Grinin, V. P., & Mannings, V. 1999, A&A, 350, 541
- Natta et al. (2001) Natta, A., Prusti, T., Neri, R., Wooden, D., Grinin, V. P., & Mannings, V. 2001, A&A, 371, 186
- Pérez et al. (2004) Pérez, M. R., van den Ancker, M. E., de Winter, D., & Bopp, B. W. 2004, A&A, 416, 647
- Shao & Staelin (1977) Shao, M. & Staelin, D. H. 1977, Optical Society of America Journal A, 67, 81
- Swain et al. (2003) Swain, M., Vasisht, G., Akeson, R., Monnier, J., Millan-Gabet, R., Serabyn, E., Creech-Eakman, M., van Belle, G., Beletic, J., Beichman, C., Boden, A., Booth, A., Colavita, M., Gathright, J., Hrynevych, M., Koresko, C., Le Mignant, D., Ligon, R., Mennesson, B., Neyman, C., Sargent, A., Shao, M., Thompson, R., Unwin, S., & Wizinowich, P. 2003, ApJ, 596, L163
- Terranegra et al. (1994) Terranegra, L., Chavarria-K., C., Diaz, S., & Gonzalez-Patino, D. 1994, A&AS, 104, 557
- Thompson et al. (2001) Thompson, A. R., Moran, J. M., & Swenson, G. W. 2001, Interferometry and synthesis in radio astronomy (Interferometry and synthesis in radio astronomy by A. Richard Thompson, James M. Moran, and George W. Swenson, Jr. 2nd ed. New York : Wiley, c2001.xxiii, 692 p. : ill. ; 25 cm. ”A Wiley-Interscience publication.” Includes bibliographical references and indexes. ISBN : 0471254924)
- Tuthill et al. (2001) Tuthill, P. G., Monnier, J. D., & Danchi, W. C. 2001, Nature, 409, 1012
- van den Ancker et al. (2004) van den Ancker, M. E., Blondel, P. F. C., Tjin A Djie, H. R. E., Grankin, K. N., Ezhkova, O. V., Shevchenko, V. S., Guenther, E., & Acke, B. 2004, MNRAS, 349, 1516
- van den Ancker et al. (1998) van den Ancker, M. E., de Winter, D., & Tjin A Djie, H. R. E. 1998, A&A, 330, 145
- Whitney et al. (1993) Whitney, B. A., Clayton, G. C., Schulte-Ladbeck, R. E., Calvet, N., Hartmann, L., & Kenyon, S. J. 1993, ApJ, 417, 687
- Whitney et al. (2004) Whitney, B. A., Indebetouw, R., Bjorkman, J. E., & Wood, K. 2004, ApJ, 617, 1177
- Wizinowich et al. (2003) Wizinowich, P. L., Le Mignant, D., Stomski, P. J., Acton, D. S., Contos, A. R., & Neyman, C. R. 2003, in Adaptive Optical System Technologies II. Edited by Wizinowich, Peter L.; Bonaccini, Domenico. Proceedings of the SPIE, Volume 4839, pp. 9-20 (2003)., 9–20
| Source | RA (J2000) | Dec (J2000) | V | K | Spectral | Distance | Adopted | Photometry |
|---|---|---|---|---|---|---|---|---|
| Names | magaaMany of the targets are variable stars and these magnitudes (V band from Simbad, and K band from 2MASS) are merely representative. | magaaMany of the targets are variable stars and these magnitudes (V band from Simbad, and K band from 2MASS) are merely representative. | Type | (pc) | Luminosity (L⊙) | References | ||
| UX Ori, HIP 23602 | 05 04 29.9908 | 03 47 14.280 | 9.6 | 7.2 | A3 (1) | 460 (10) | 513 (1) | 10, 15, 16, 17, 18, 19, 20, 21, 22 |
| MWC 758, HD 36112 | 05 30 27.5296 | 25 19 57.083 | 8.3 | 5.8 | A8V (9) | 200 (4,5) | 254 (14) | 15, 16, 19, 20, 21, 23 |
| Z CMa AbbZ CMa is a binary system (Millan-Gabet & Monnier 2002) consisting of an Herbig Component (A) and an FU Orionis star (B). The V and K magnitudes in the table are for the entire system, although our data reduction isolate the contribution from the Herbig component. The spectral type and luminosity for Z CMa A is highly uncertain – see §4.3 for discussion., HIP 34042 | 07 03 43.1619 | 11 33 06.209 | 9.9 | 3.8 | B0III (13) | 1050 (13) | 3000 – 310000 (13,26) | 13, 20, 24, 25 |
| HD 58647, HIP 36068 | 07 25 56.0989 | 14 10 43.551 | 6.8 | 5.4 | B9IVe (3,4) | 280 (4,5) | 29550 (14) | 15, 16, 19, 20, 21 |
| HD 141569, HIP 77542 | 15 49 57.7489 | 03 55 16.360 | 7.0 | 6.8 | A0Vev (3,6) | 99 (4,5) | 18.51.0 (14) | 15, 16, 18, 19, 20, 21 |
| HD 142666, v1026 Sco | 15 56 40.023 | 22 01 40.01 | 8.8 | 6.1 | A8Ve (3,6,7) | 116 (7) | 8.82.5 (14) | 15, 16, 18, 19, 20, 21 |
| HD 143006, HIP 78244 | 15 58 33.4177 | 09 00 12.174 | 8.4 | 7.1 | G5V (6) | 9435 (5) | 1.40.5 (14) | 15, 16, 18, 19, 20, 21, 22 |
| HD 144432, HIP 78943 | 16 06 57.9575 | 27 43 09.806 | 8.2 | 5.9 | A9IVev (3) | 145 (8) | 14.54.0 | 15, 16, 18, 19, 20, 21, 22 |
| HD 150193, MWC 863A | 16 40 17.9221 | 23 53 45.180 | 8.9 | 5.5 | A2IVe (3) | 150 (4,5) | 5117 (14) | 10, 15, 16, 18, 19, 20, 21, 22 |
| MWC 275, HD 163296 | 17 56 21.2879 | 21 57 21.880 | 6.9 | 4.8 | A1Vepv (3) | 122 (4,5) | 408 (14) | 10, 15, 16, 17, 18, 19, 20, 21, 22 |
| WW Vul, HD 344361 | 19 25 58.750 | 21 12 31.28 | 10.5 | 7.3 | A2IVe (3) | 550 (12) | 655 (1) | 15, 16, 17, 18, 19, 20, 21 |
| v1685 Cyg, MWC 340 | 20 20 28.2473 | 41 21 51.586 | 10.7 | 5.8 | B3 (1) | 980 (4) | 2140015000 (1) | 10, 15, 16, 17, 18, 19, 20, 21 |
| v1977 Cyg, AS 442 | 20 47 37.47 | 43 47 24.9 | 10.9 | 6.6 | B8V (3) | 700 (11) | 300210 (14) | 15, 16, 17, 19, 20, 21 |
| AS 477, v1578 Cyg | 21 52 34.0993 | 47 13 43.612 | 10.2 | 7.2 | A0 (1) | 900 (2) | 15420 (1) | 10, 15, 16, 17, 18, 19, 20, 21 |
Note. — References: (1) Hernández et al. (2004), (2) Lada (1985), (3) Mora et al. (2001), (4) van den Ancker et al. (1998), (5) ESA (1997), (6) Dunkin et al. (1997), (7) Meeus et al. (2001), (8) Pérez et al. (2004), (9) Beskrovnaya et al. (1999), (10) Hillenbrand et al. (1992), (11) Terranegra et al. (1994), (12) Friedemann et al. (1993), (13) van den Ancker et al. (2004), (14) SED fitting, this work (15) Morrison et al. (2001), (16) Kharchenko (2001), (17) Morel & Magnenat (1978), (18) Gezari et al. (1999), (19) Simbad Astronomical Database, (20) 2MASS; Cutri et al. (2003), (21) Tycho-2; Høg et al. (2000), (22) DENIS Database, 2nd Release, (23) Joint IRAS Science Working Group (1988), (24) Millan-Gabet & Monnier (2002), (25) Koresko et al. (1991), (26) Hartmann et al. (1989)
| Source | Calibrator | Spectral | V | K | Adopted Uniform DiskaaAll diameter estimates were made using getCal, which is maintained and distributed by the Michelson Science Center (http://msc.caltech.edu). The diameters were estimated by fitting the spectral energy distributions with simple blackbody models. |
|---|---|---|---|---|---|
| Name | Name | Type | mag | mag | Diameter (mas) |
| UX Ori | HDC33278 | G9V | 8.6 | 6.8 | 0.120.2 |
| HDC36003 | K5V | 7.7 | 4.8 | 0.550.1 | |
| HDC26794 | K3V | 8.8 | 6.3 | 0.240.1 | |
| MWC 758 | HDC27777 | B8V | 5.7 | 5.9 | 0.210.1 |
| HDC29645 | G0V | 6.0 | 4.6 | 0.410.2 | |
| Z CMa A | HDC48286 | F7V | 7.0 | 5.7 | 0.320.1 |
| HDC52919 | K5V | 8.4 | 5.5 | 0.390.1 | |
| HDC60491 | K2V | 8.2 | 5.9 | 0.300.1 | |
| HD 58647 | HDC58461 | F3V | 5.8 | 4.9 | 0.390.1 |
| HDC62952 | F2V | 5.0 | 4.2 | 0.390.5 | |
| HD 141569 & HD 144432 | HDC139909 | B9.5V | 6.9 | 7.0 | 0.160.1 |
| HDC147550 | B9V | 6.2 | 6.3 | 0.210.1 | |
| HD 142666 & HD 150193 | HDC144641 | G3V | 8.0 | 6.5 | 0.150.1 |
| HDC134967 | A2V | 6.1 | 6.0 | 0.280.1 | |
| HD 143006 | HD141107 | F2V | 7.7 | 6.9 | 0.170.1 |
| HD149149 | G6V | 8.6 | 7.0 | 0.120.1 | |
| MWC 275 | HDC157546 | B8V | 6.3 | 6.5 | 0.170.1 |
| HDC174596 | A3V | 6.6 | 6.5 | 0.210.1 | |
| WW Vul | HDC181047 | G8V | 8.3 | 6.5 | 0.190.1 |
| HDC184198 | F7V | 8.2 | 6.9 | 0.140.1 | |
| v1685 Cyg & v1977 Cyg | HDC199178 | G2V | 7.2 | 5.7 | 0.200.2 |
| v1685 Cyg | HIP102667 | K2V | 8.8 | 6.6 | 0.130.2 |
| HDC192985 | F5V | 5.9 | 4.8 | 0.380.1 | |
| v1977 Cyg | SAO50092 | K0V | 8.6 | 6.3 | 0.300.04 |
| HDC199998 | K2III | 8.4 | 5.7 | 0.400.1 | |
| AS 477 | HDC201456 | F8V | 7.9 | 6.6 | 0.18 0.1 |
| HIP109034 | K4III | 9.5 | 6.2 | 0.350.5 | |
| HDC199178 | G2V | 7.2 | 5.7 | 0.200.2 |
| Source | U.T. | Projected Baseline | Visibility-Squared | |
|---|---|---|---|---|
| Name | Date | U (m) | V (m) | m, m |
| UX Ori | 2004 Jan 07 | 55.547 | 64.015 | 0.4830.052 |
| 56.336 | 63.635 | 0.4760.042 | ||
| MWC 758 | 2002 Oct 24 | 50.790 | 67.981 | 0.3600.088 |
| 49.974 | 68.668 | 0.3370.039 | ||
| Z CMa A | 2004 Apr 03 | 28.806 | 52.420 | 0.1720.015 |
| 2004 Apr 05 | 34.159 | 53.142 | 0.1860.077 | |
| HD 58647 | 2004 Apr 02 | 30.502 | 49.851 | 0.6390.098 |
| 27.501 | 49.411 | 0.7340.091 | ||
| HD 141569 | 2003 Apr 17 | 55.224 | 62.474 | 0.9780.065 |
| 54.102 | 62.180 | 1.0560.105 | ||
| HD 142666 | 2004 Mar 05 | 56.538 | 58.909 | 0.5620.059 |
| 56.219 | 56.564 | 0.4450.054 | ||
| 55.784 | 55.363 | 0.5860.092 | ||
| 55.647 | 55.064 | 0.5070.066 | ||
| 53.392 | 51.838 | 0.6040.033 | ||
| HD 143006 | 2004 Apr 02 | 40.097 | 42.871 | 0.9310.197 |
| 36.677 | 41.635 | 0.8630.200 | ||
| HD 144432 | 2003 Apr 17 | 54.460 | 49.100 | 0.3680.018 |
| 54.167 | 48.628 | 0.3800.016 | ||
| HD 150193 | 2004 Mar 05 | 54.858 | 52.468 | 0.2050.023 |
| MWC 275 | 2003 Apr 17 | 55.592 | 55.001 | 0.1880.010 |
| 54.449 | 53.157 | 0.2180.015 | ||
| 53.189 | 51.683 | 0.2180.013 | ||
| 51.713 | 50.306 | 0.2320.015 | ||
| WW Vul | 2003 Aug 09 | 37.683 | 74.410 | 0.6420.063 |
| 33.914 | 75.528 | 0.5580.059 | ||
| v1685 Cyg | 2002 Jun 27 | 41.541 | 72.969 | 0.3970.069 |
| 33.288 | 77.825 | 0.4200.108 | ||
| v1977 Cyg | 2002 Oct 24 | 45.133 | 69.368 | 0.6360.032 |
| 34.998 | 76.533 | 0.6400.041 | ||
| AS 477 | 2002 Oct 24 | 40.923 | 71.723 | 0.7030.025 |
| 35.262 | 75.529 | 0.6730.054 | ||
| Source | Dust Fraction | Ring Diameter | |
|---|---|---|---|
| Name | at K-bandaaBest estimate for fraction of K-band light coming from circumstellar material based on most recent photometry. Upper and lower limits are based on SED fitting to diverse data sets and represent the range of possible values given historical variability. | mas | AU |
| UX Ori | 0.70 | 2.36 | 1.09 |
| MWC 758 | 0.72 | 2.75 | 0.550.04 |
| Z CMa A | 0.9750.025 | 3.950.24 | 4.150.25 |
| HD 58647 | 0.54 | 2.930.45 | 0.820.13 |
| HD 141569 | 0.050.05 | 20 | 2 |
| HD 142666 | 0.61 | 2.52 | 0.29 |
| HD 143006 | 0.53 | 1.63 | 0.15 |
| HD 144432 | 0.62 | 3.37 | 0.49 |
| HD 150193 | 0.67 | 3.84 | 0.58 |
| MWC 275 | 0.71 | 3.70 | 0.45 |
| WW Vul | 0.88 | 1.80 | 0.99 |
| v1685 Cyg | 0.94 | 2.19 | 2.15 |
| v1977 Cyg | 0.94 | 1.61 | 1.13 |
| AS 477 | 0.86 | 1.55 | 1.39 |