Spitzer and ISO Galaxy Counts in the Mid-Infrared
Received ;
in original form 2004 October )
Abstract
Galaxy source counts that simultaneously fit the deep mid-infrared surveys at 24 microns and 15 microns made by the Spitzer Space Telescope and the Infrared Space Observatory (ISO) respectively are presented for two phenomenological models. The models are based on starburst and luminous infrared galaxy dominated populations. Both models produce excellent fits to the counts in both wavebands and provide an explanation for the high redshift population seen in the longer Spitzer 24 micron band supporting the hypothesis that they are luminous-ultraluminous infrared galaxies at z=2-3, being the mid-infrared counterparts to the sub-mm galaxy population. The source counts are characterized by strong evolution to redshift unity, followed by less drastic evolution to higher redshift. The number-redshift distributions in both wavebands are well explained by the effect of the many mid-infrared features passing through the observation windows. The sharp upturn at around a milliJansky in the 15 micron counts in particular depends critically on the distribution of mid-infrared features around 12 microns, in the assumed spectral energy distribution.
keywords:
Cosmology: source counts – Infrared: source counts, Surveys – Galaxies: evolution.1 Introduction
The detection of the peak in the far-infrared background at 140m by the COBE-DIRBE instrument has emphasized that much of the star formation in the Universe has taken place in dust enshrouded environments and that the galaxies responsible have undergone strong evolution to the present epoch (e.g. Hauser et al. [Hauser et al. 1998], Lagache & Puget [Lagache & Puget 2000]). This evolution has also been inferred and confirmed at wavelengths from 7-170m by a progression of increasingly inspiring space missions from IRAS, ISO to Spitzer (Soifer et al. [Soifer, Houck & Neugebauer 1987], Kessler et al. [Kessler et al. 1996], Werner et al. [Werner et al. 2004] ) and at sub-mm wavelengths by the SCUBA instrument [Holland et al. 1999]. The emission in the dust spectrum of galaxies due to star formation peaks in the wavelength region between 60-100m however a significant fraction (40) of a typical star-forming galaxy’s luminosity is radiated at mid-infrared wavelengths from 7-40m [Soifer, Houck & Neugebauer 1987]. Moreover, unlike the far-infrared, observations at mid-infrared wavelengths are not so severely constrained by detector array size, resolution and detector effects such as transients and glitches. The mid-infrared spectra of star-forming galaxies are dominated by a complex set of emission features at 3.3, 6.2, 7.7, 8.6, 11.3 & 12.7m attributed to Polycyclic Aromatic Hydrocarbon (PAH) molecules and the silicate absorption feature at 9.7m (Boulanger et al. [Boulanger et al. 1998], Peeters et al. [Peeters et al. 2004]). These PAH features can contribute 10-30 of the bolometric infrared luminosity of infra-red galaxies and are good indicators of the star-formation rate [Spoon et al. 2004a]. Typical widths of these features (up to10m) can be comparable to instrument filter bandwidths (e.g., 3.5m & 6m for the ISOCAM-LW2(5-8.5m) filter and ISOCAM-LW3(12-18m) filters respectively) and will therefore have a profound effect on any observations in the mid-infrared.
The strongest constraint on the evolution in the mid-infrared until recently, has been the source counts at 15m in the ISOCAM-LW3 band. The ISO counts span over 4 orders of magnitude in flux [Elbaz et al. 1999]. The flux density range from 150-0.5mJy is covered by the European Large Area ISO Survey over four main fields over a total of 12sq.deg. (ELAIS, Oliver et al. [Oliver et al. 2000]). At flux densities 2mJy the source counts are Euclidean in nature and are well fitted by a combination of star-forming and quiescent galaxies with little or no contribution from more extreme luminous (LIG, ) or ultraluminous (ULIG, ) infrared galaxies (Serjeant et al. [Serjeant et al. 2000], Gruppioni et al. [Gruppioni et al. 2002] Rowan-Robinson et al. [Rowan-Robinson 2004]). At fluxes 2mJy the source counts show a strong departure from non-evolving scenarios. The fainter ISO surveys detected extreme evolution producing super Euclidean slopes at fluxes , flattening at fainter fluxes of (Fadda et al. [Fadda et al. 2004], Pozzi et al. [Pozzi et al. 2004], Metcalfe et al. [Metcalfe et al. 2003], Gruppioni et al. [Gruppioni et al. 2002], Altieri et al. [Altieri et al. 1999], Aussel et al.. [Aussel et al. 1999]) The majority of the deep ISOCAM sources have been identified with luminous infra-red galaxies with luminosities of the order of (Flores et al. [Flores et al. 1999]). The ISO 15m counts are well fit by models assuming a rapid increase in the star formation activity between 0z1 (e.g. Pearson [Pearson 2001a], Xu et al. [Xu et al. 2003], Lagache et al. [Lagache, Dole, Puget 2003]). The MIPS 24m band on the Spitzer Space Telescope is well suited to the study of distant star forming galaxies at z1 since the 24m band is sampling the rest frame PAH emission from 6-12m from 0.7z2.5. Observations in the 24m band over the flux range 50-0.06mJy have confirmed the strong evolution of the mid-infrared population (Papovich et al. [Papovich et al. 2004], Marleau et al. [Marleau et al. 2004]), but however cannot be explained by evolutionary models based solely on the previous ISO 15m population (e.g. Xu et al. [Xu et al. 2003], Chary & Elbaz [Chary & Elbaz 2003], King & Rowan-Robinson [King & Rowan-Robinson 2003], Lagache et al. [Lagache, Dole, Puget 2003]). The ISO 15m differential counts peak at around 0.4mJy with a median redshift 0.8 (Elbaz et al. [Elbaz et al. 1999], Elbaz et al. [Elbaz et al. 2002]), conversely the peak in the 24m counts occurs at flux densities almost twice as faint around 0.2mJy implying a higher redshift distribution for the dominant sources [Chary et al. 2004] for a realistic range of the 24m/15m flux ratio [Gruppioni et al. 2005].
In this letter the emphasis is on the simultaneous fitting of the source counts in the ISO-ISOCAM-LW3 15m and Spitzer-MIPS 24m bands. Detailed results on the modelling of the spectral energy distributions, galaxy colours, discussion of the galaxy populations and source counts in the shorter Spitzer-IRAC bands and the longer wavelength MIPS bands (70m & 160m) will be given in a later contribution [Pearson et al. 2005]. In section 2 two phenomenological galaxy evolution models used to model the midinfrared counts are presented. In section 3 we discuss the resulting fits to the source counts at 15m and 24m. The conclusions are given in section 4 . A concordance cosmology of is assumed.
2 The mid-infrared population
The models presented are referred to as the Bright End evolution model and the Burst evolution model and are modified and updated realizations of those presented in Pearson [Pearson 2001a], Pearson & Rowan-Robinson [Pearson & Rowan-Robinson 1996]. The previous models were based on the far-infrared 60m luminosity function of PSCz IRAS galaxies [Saunders et al. 2000]. The new models use the 15m type dependent luminosity functions derived from the ISO-ELAIS survey of Pozzi et al. [Pozzi et al. 2004] to represent the normal + starburst/LIG/ULIG populations and Matute et al. [Matute et al. 2004] to represent the Type-1 AGN (including Seyfert 1). Since Matute et al. [Matute et al. 2004] only provide a parametric luminosity function for the type 1 population, the 12m luminosity function of Rush et al. [Rush, Malkan & Spinoglio 1993] is retained for the type 2 population. The use of mid-infrared luminosity functions as opposed to the more traditional far-infrared variants to model the source counts at 15 & 24m minimize any errors due to assumed SED shape and K-corrections. The luminosity function of Pozzi et al. [Pozzi et al. 2004] is used in preference to the 12m & 25m IRAS luminosity functions of Xu et al. [Xu et al. 2001] or Fan et al. [Fang et al. 1998] because the former is segregated specifically into normal quiescent and starburst populations based on ISO colour criteria .
The adopted SED is the most important factor in the models. The complicated nature of the mid-infrared spectra and the variation between models, even for more normal galaxies can have a dramatic effect on the derived source counts of a galaxy population. In the final analysis of the ELAIS survey, Rowan-Robinson et al. [Rowan-Robinson 2004] have shown that the infrared galaxy population can be divided into 4 distinct spectral classes of normal quiescent (cirrus) galaxies, starbust (M82) galaxies, LIG/ULIG () sources (ARP220) and AGN (dust torus).
The original normal galaxy used in Pearson [Pearson 2001a] has been replaced by the SED of Dale et al. [Dale et al. 2001] which incorporates a more recent dust model (see Pearson & Efstathiou [Pearson & Efstathiou 2005] for a comaprison of cirrus galaxy SEDs). Although, for the normal galaxies, the effect of changing the SED in the 24m band is minimal, at 15m the original model produced excess power in the differential counts at the level of a few mJy due to extremely strong and narrow PAH emission, masking the evolutionary upturn in the differential counts at that level.
For the starburst template, the critical point in the SED is where the Wien-side of the dust emmission curve meets the mid-infrared PAH emmission. Analysis of model starburst SEDs shows a large variation in resulting K-corrections due to 2 factors, the slope of the SED at this point (an increasing slope to shorter wavelengths producing a favourable negative K-correction) and the inclusion of distinct 12.7m & 11.3m features to produce a more accurate distribution of mid-infrared features (Boulanger et al. [Boulanger et al. 1998], Diedenhoven et al. [van Diedenhoven et al. 2001]). Thus we have retained the original Starburst (M82 like) SED of Efstathiou, Rowan-Robinson & Siebenmorgen [Efstathiou et al. 2000a] but have replaced the SED in the range from 18-5m, with the observed ISOCAM Circular Variable Filter spectrum of Forster Schreiber et al. [Forster Schreiber et al. 2003]. Note that a similar adjustment was necessary in the models of Lagache et al. [Lagache et al. 2004] in order to produce a reasonable fit to the Spitzer 24m counts.
The luminous infrared galaxy population is represented by the archetypical ARP220 SED of Efstathiou, Rowan-Robinson & Siebenmorgen [Efstathiou et al. 2000a] which gives a good fit of the spectrum of ARP220 from sub-mm to optical wavelengths and is in reasonable agreement with the results of Spoon et al. [Spoon et al. 2004b]. Note that although it is known that ARP220 has an atypical far-infrared/mid-infrared luminosity ratio, we justify its use by the fact that it provides good fits to many of the ELAIS sources [Rowan-Robinson 2004] and has more typical 6.7-12-15m luminosity ratios [Elbaz et al. 2002].
The AGN template uses the dust torus model of Rowan-Robinson [Rowan-Robinson 1995] extended to near-infrared-optical wavelengths by King & Rowan-Robinson [King & Rowan-Robinson 2003]. All the assumed SEDs are found to be consistent with the ISO-ELAIS colours of Rowan-Robinson et al. [Rowan-Robinson 2004]. For the calculation of the source counts the SEDs are smoothed by the respective filter bandwidths corresponding to the ISO-LW3 15m and Spitzer-MIPS 24m bands.
We investigate two particular models, categorized by their dominant populations of starburst (M82 like) and ULIG (Arp 220 like) sources respectively. The Bright End Model broadly follows the evolutionary scenario of Pearson & Rowan-Robinson [Pearson & Rowan-Robinson 1996] assuming the starburst/AGN and LIG/ULIG population luminosity function evolves in both luminosity, , and density, , as , with & and & for the starburst and LIG/ULIG components respectively to z1 and constant thereafter. The Burst Model broadly follows the evolutionary scenario of Pearson [Pearson 2001a] and assumes a similar power law evolution in luminosity and density, for the starburst and AGN populations and an initial exponential burst + power law evolutionary scenario for the ULIG population. In this scenario, the starburst population evolves as , while the more luminous galaxies evolve exponentially to z1 in density equivalent to and then as a lower power law in both density and luminosity to higher redshifts. This violent evolutionary phase from z0-1 is consistent with extrapolations from the IRAS faint source survey (Bertin et al. [Bertin et al. 1997], Kim & Saunders [Kim & Sanders 1998]), more extreme models of evolution in the ISO population [Lagache, Dole, Puget 2003], models of bright sub-mm SCUBA galaxies (Smail et al. [Smail, Ivison & Blain 1997], Hughes et al. [Hughes et al. 1998], Scott et al. [Scott et al. 2002], Mortier et al. [Mortier et al. 2004]) and the most recent models of the Spitzer far-infrared poulation [Lagache et al. 2004]. In both models the normal galaxies are assumed to be non-evolving.
3 Counts and Redshift Distributions
In figure 1 the model fits to the observed counts in the ISO 15m and Spitzer 24m wavebands are shown for the Bright End (a) & Burst (b) evolutionary scenarios respectively. The counts are shown in Euclidean normalized differential form. The two models are capable of simultaneously fitting the differential source counts in both the ISO 15m and Spitzer 24m wavebands. The fits at 15m confirm the strong evolution to z1 implied by the ISO surveys while the counts at fainter fluxes at 24m indicate a population of sources at higher redshift. The more conventional Bright End model predicts that star-forming galaxies rather than ULIG sources dominate the 15m source counts.
Pozzi et al. [Pozzi et al. 2004] have fitted the ELAIS-S 15m counts assuming an evloving starburst population with , . Although assuming the Pozzi et al. [Pozzi et al. 2004] evolution for the starburst component presented in this work does indeed provide a good fit at 15m, it also produces an excess at around 1mJy in the 24m band, thus counts at fluxes of around 0.5-2mJy, in the Spitzer 24m band can provide good constraints on the z1 evolution.
In contrast, the more extreme burst model predicts that the upturn at mJy level fluxes at 15m and the peak of the counts at 24m are attributed to the emergence of a new population of LIG/ULIG sources. Finally, both the Bright End Model and the Burst Model predict that the peak in the 24m differential counts at 0.2mJy is produced by the luminous LIG-ULIG population consistent with the early analysis of the Spitzer 24m data (Yan et al. [Yan et al. 2004], Le Floc’h et al. [Le Floc’h et al. 2004]) .
Thus, although from figure 1 both models are in agreement as to the origin of the dominant source population at 24m, they differ in their prediction for the source of the upturn (note, not the peak) in the differential counts at 15m, thus it is the counts at 15m that have a better chance of distinguishing between the two evolutionary scenarios. For the Burst model, we would expect to see a significantly higher fractional contribution of LIG/ULIG sources (an order of magnitude in the differential counts at the mJy level) that simply are not appreciably present in the Bright End model.
Note that at the depth of the ELAIS survey () the predictions of both models are consistent with the near-infrared and optical imaging of the ELAIS-S field by Pozzi et al. [Pozzi et al. 2003], with the majority of 15m sources being luminous starburst galaxies and approximately 20 of sources attributed to AGN (Type 1 & 2). Rowan-Robinson et al. [Rowan-Robinson 2004] find a high proportion 14 of ULIGs in the ELIAS final band merged catalogue. This proportion is 10 for the Bright End model. The Burst model predicts a fraction of 30 which is still consistent with the ELAIS results if the blank optical identifications (10) can be attributed to luminous infrared galaxies. Spectroscopy of the ELAIS-S sources has been made by La Franca et al. [La Franca et al. 2004]. Of 87 of sources spectroscopically identified, two populations dominated the 15m sources over the range 0.5-150mJy, with approximately three quarters contribution coming from normal to extreme starbursts and the remaining contribution coming from AGN. Around 18 of the ELAIS-S sources have no counterpart to optical maginitudes R23. Moreover La Franca et al. [La Franca et al. 2004] have shown that it is these sources are responsible for the upturn in the differential sources counts around 1mJy at 15m and that they are expected to have luminosities in the range, i.e. luminous and ultra-luminous infra-red galaxies.
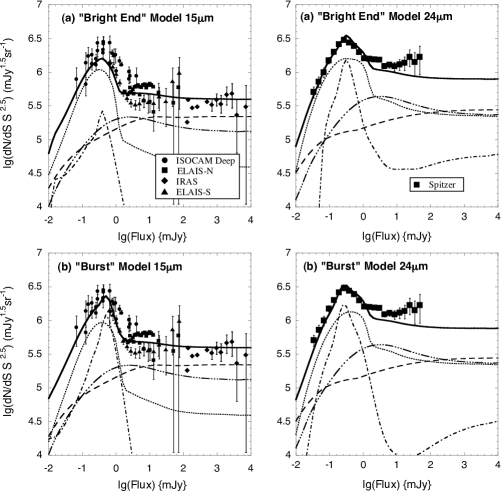
From figure 1, it can be seen that although both the fainter 15m & 24m differential counts can be well fitted at the fainter fluxes, the brighter counts are slightly underestimated in the Spitzer 24m band. This could be attributed to some variance in the Spitzer fields since the initial counts from the SWIRE survey are somewhat lower at fluxes brighter than 10mJy (Shupe et al., in preparation). Alternatively, this effect could be due to a low normalization in the assumed ELAIS-S field luminosity function since although there is a good agreement with the evolution found in the deeper ISO surveys, including the upturn in the differential counts, in the brighter flux range of 0.5-10mJy, the counts in the ELAIS-S field are systematically lower than the (corrected) Northern ELAIS fields and the fainter ISO surveys (Serjeant et al. [Serjeant et al. 2000], Vaisanen et al. [Vaisanen et al. 2002], Vaccari et al. [Vaccari et al. 2004], Rodighiero et al. [Rodighiero et al. 2004]).
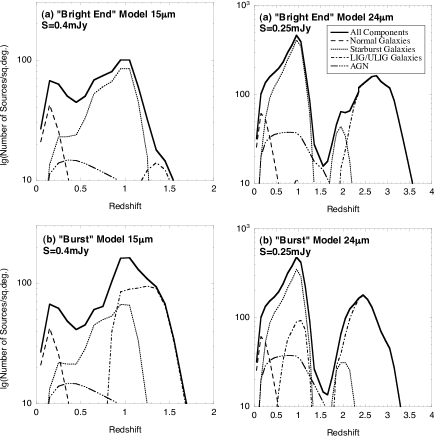
Both evolutionary models are found to be broadly consistent with the 15m redshift distribution at bright fluxes with a median redshift consistent with that found for the ELAIS sources (Pozzi et al. [Pozzi et al. 2004], Rowan-Robinson et al. [Rowan-Robinson 2004]). However, we predict an additional component at higher redshift 1 in line with the assumptions of La Franca et al. [La Franca et al. 2004] but not present in the estimations of Rowan-Robinson et al. [Rowan-Robinson 2004]. In figure 2 the number-redshift distributions at fainter fluxes corresponding to the approximate peaks in the differential counts at & are shown respectively for the ISOCAM 15m & Spitzer 24m bands for the Bright End (panel a) & Burst (panel b) evolutionary models. At the flux corresponding to the peak in the 15m differential counts we find good agreement with the fainter ISO surveys that predict a median redshift between z0.8-1.0 and domination by populations of luminous infrared sources (Elbaz et al. [Elbaz et al. 2002], Oliver et al. [Oliver et al. 2002], Mann et al. [Mann et al. 1997]. At this redshift (z0.95) the 7.7m rest frame feature passes through the ISO 15m band producing strong K-corrections, which combined with the strong evolution produces the redshift peak. The effect of the 9.7m silicate absorption feature is also prominent at z0.5 and is consistent with the drop in density of galaxies observed in the ELAIS-S field at this redshift [La Franca et al. 2004]. At 24m a bimodal redshift distribution is seen at z1 & 2.5 corresponding to the passage of the 6.2-7.7m and 11.3-12.7m features respectively. A similar bimodal distribution has also been suggested by Chary et al. [Chary et al. 2004] although the models presented here predict a greater contribution from higher luminosity infrared sources. A significant deficit of sources is seen at z1.5 which can be attributed to the effect of the silicate feature at 9.7m. Although the two evolutionary scenarios predict a different origin for the dominant population at low redshifts, both models are unanimous in predicting a new population of infra-red luminous sources in the redshift range, z=1-3. The SCUBA sub-mm population would seem likely candidates for this population of sources, indeed observations in the MIPS 24m band of SCUBA sources in the Lockman Hole detected almost all of the sources in the range z0.5-3.5 [Egami et al. 2004]. Furthermore, the redshift distribution of the high-z Spitzer sources and their predicted luminosity range (LIG-ULIG) correlates well with the median redshift of 2.2-2.5 found for sub-mm sources (Chapman et al. [Chapman et al. 2003], [Chapman et al. 2004], Frayer et al. [Frayer et al. 2004]). Luminous/ultraluminous galaxies are responsible for the peak at around 0.25mJy in the 24m differential counts in both models. At this flux level both models predict of the order of more than 1000 such sources per square degree and typical sub-mm fluxes at 850m of 3-5mJy over the redshift range 1-2.5, in very good agreement with the observed submillimetre source density in this flux range observed by SCUBA [Blain et al. 1999].
4 Conclusions
The two evolutionary models presented are capable of simultaneously fitting both the 15m ISO and 24m Spitzer normalized differential source counts. Careful consideration has been given to the assumed distribution of PAH features. The ISO counts are well fitted by starburst or LIG-ULIG sources strongly evolving to redshift 1, depending on the model, while both models are unanimous in predicting a new population of luminous infrared galaxies at z2-3 detected by the Spitzer observations at 24m, that were previously unexpected from fits to the ISO counts. These higher redshift sources are interpreted as being the infrared counterparts to the luminous sub-mm population. The number-redshift distributions at 15m & 24m, while confirming the strong evolution in the infrared population, show a bimodal distribution dominated by PAH emission features between 3-13m and the silcate absorption feature at 9.7m.
Although the original model of Pearson [Pearson 2001a] provided an excellent fit to the source counts at 15m and other ISO wavelengths, like other pre-Spitzer models it fails to reproduce the bump in the Spitzer 24m counts at fainter fluxes (see Papovich et al [Papovich et al. 2004] for a comparision of pre- Spitzer models). In summary, the main difference in the assumed evolution in the new model formulation and that of the original models is an increase in the evolutionary strength in the 1z2 region. Alternative post-Spitzer evolutionary models of Gruppioni et al. [Gruppioni et al. 2005] and Lagache et al. [Lagache et al. 2004] can be broadly categorized by the Bright End evolution model and the Burst evolution model respectively. All of these models have required some adjustment of the mid-infrared Starburst spectral energy distribution in order to fit the observations. Both the models of Lagache et al. and the Burst evolution model are characterized by extreme evolution in the high luminosity infrared galaxy population (i.e. the LIG-ULIGs). These models predict that the dominant population at 15m will be starburst galaxies while at 24m they will be sources with infrared luminosities of the order of a few at redshifts 1z3. In contrast the model of Gruppioni et al. [Gruppioni et al. 2005] and similarly the Bright End evolution model presented here, propose more traditional power law evolution and that the more numerous population at both 15 and 24m will be the starburst galaxies, in fact the model of Gruppioni et al. [Gruppioni et al. 2005] assumes that the contribution of more extreme IR galaxies (ULIGs) at both 15 and 24m is negligible.
Deeper observations over larger areas in the 15m band and photometric redshifts using mid-infrared multiband observations of PAH emission and the silicate absorption features can break the degeneracy in the models by revealing the dominant population at fainter 15m fluxes (Starburst, LIGs, ULIGs). Spitzer has the ability for imaging in this wavelength range (16 & 22m) by using the peak-up camera of the infrared spectrograph (IRS, Houck et al. [Houck et al. 2004]), and Charmandaris et al. [Charmandaris et al. 2004] have discussed the potential for estimating redshifts and selecting galaxies at z1.5 from the mid-infrared features by using the IRS. Takagi & Pearson [Takagi & Pearson 2005] have shown that a combination of mid-infrared filters can detect luminous infrared galaxies at z1-2 due to the strong silicate absorption expected in these sources [Armus et al. 2004].
The Spitzer peak up imager is however, limited by its small field of view (0.9′x1.3′). Deep, larger area observations in this wavelength range will be available from the Japanese infrared mission ASTRO-F due for launch in late 2005 (Murakami [Murakami 2004], Pearson et al. [Pearson et al. 2004]). The ASTRO-F focal plane instruments, include an infrared camera (IRC) with a field of view of 10′x 10′(almost 100 times the area of Spitzer’s peak up imager, allowing coverage of the deepest Spitzer fields in a single pointing), covering the near-mid-infrared in 9 bands from 2-24m and covering the Spitzer wavelength desert in 4 extra bands at 9, 11, 15, 20m, making it the ideal complement to Spitzer. Deep surveys are planned over sub-few square degree scales with sensitivities down to 0.04mJy at 15m [Pearson et al. 2001b], i.e. deep enough to directly probe significant samples of the sources responsible for the upturn in the 15m counts. Takagi & Pearson [Takagi & Pearson 2005] predict of the order of 1000 candidate LIG/ULIGs could be detected per square degree using the silicate-break method which will be a large enough sample to break the degeneracy in the models via specific colour cuts utilizing ASTRO-F’s larger number of filters in the critical wavelength range that samples the PAH emission in galaxies from 0z2.5 which is will be only partially possible and difficult & time consuming to achieve with Spitzer’s peak up imager.
In the next few years, multiwaveband observations with Spitzer and ASTRO-F probing different redshift regimes will examine the infrared active epoch z0.5-1.5 (Franceschini et al. [Franceschini et al. 2003], Elbaz et al. [Elbaz et al. 2004]) and the link between the infrared and sub-mm populations at z2 [Blain et al. 2004] providing a definitive record of the cosmic star formation history and cosmic fossil background of the Universe.
5 Acknowledgements
The author wishes to thank the referee for comments and suggestions that improved the clarity of this work. Chris Pearson is supported by a European Commission International Co-operation Fellowship to Japan.
References
- [Altieri et al. 1999] Altieri B. et al., 1999, AA, 343, L65
- [Armus et al. 2004] Armus L. et al., 2004, ApJSS, 154, 178
- [Aussel et al. 1999] Aussel H., Cesarsky C.J., Elbaz D., Starck J.L., 1999, AA, 342, 313
- [Bertin et al. 1997] Bertin E., Dennefeld M., Moshir M., 1997, AA, 323, 685
- [Blain et al. 1999] Blain A. W., Kneib J.-P., Ivison R. J., Smail I. 1999, ApJ, 512, L87
- [Blain et al. 2004] Blain A.W., Chapman S.C., Smail I., Ivison R., 2004, ApJ, 611, 52
- [Boulanger et al. 1998] Boulanger F., Boisssel P., Cesarsky D., Ryter C., 1998, AA, 339, 200
- [Chapman et al. 2003] Chapman S.C., Blain A.W., Ivison R.J., Smail I.R., 2003, Nature, 422, 695
- [Chapman et al. 2004] Chapman S.C., Smail I., Blain A.W., Ivison R.J., 2004, ApJ, astro-ph/0406596
- [Charmandaris et al. 2004] Charmandaris V. et al., 2004, ApJSS, 154, 142
- [Chary & Elbaz 2003] Chary R.R., Elbaz D., 2003, ApJ, 556, 562
- [Chary et al. 2004] Chary R.R. et al., 2004, ApJSS, 154, 80
- [Dale et al. 2001] Dale D.A., Helou G., Contursi A., Silbermann N.A., Kolhatkar S., 2001, ApJ, 549, 215
- [van Diedenhoven et al. 2001] van Diedenhoven B, Peeters E., van Keckhoven C., Hony S., Hudgins D.M., Allamandola L.J., Tielens A.G.G.M. , 2004, ApJ, 611, 928
- [Efstathiou et al. 2000a] Efstathiou,A., Rowan-Robinson M., Siebenmorgen,R., 2000, MNRAS, 313, 734
- [Egami et al. 2004] Egami E. et al., 2004, ApJSS, 154, 130
- [Elbaz et al. 1999] Elbaz D. et al., 1999, AA, 351, L37
- [Elbaz et al. 2002] Elbaz D., Cesarsky C.J., Chanial P., Aussel H., Franceschini A., Fadda D., Chary R.R., 2002, AA, 384, 848
- [Elbaz et al. 2004] Elbaz D., Marcillac D., Moy E., 2004, astro-ph/0403209
- [Fadda et al. 2004] Fadda D. Lari C., Rodighiero G., Franceschini A., Elbaz D., Cesarsky C., Perez-Fournon I., 2004, AA, astro-ph/0407649
- [Fang et al. 1998] Fang F. Shupe L., Xu C., Hacking B., 1998, ApJ, 500, 693
- [Flores et al. 1999] Flores H.et al., 1999, ApJ, 517, 148
- [Forster Schreiber et al. 2003] Forster Schreiber N.M., Sauvage M., Charmandaris V., Laurent O., Gallais P., Mirabel I. F., Vigroux L., 2003, AA, 399, 833
- [Franceschini et al. 2003] Franceschini A. et al. 2003, AA, 403, 501
- [Frayer et al. 2004] Frayer D.T. et al., 2004, ApJSS, 154, 137
- [Gruppioni et al. 2002] Gruppioni C., Lari C., Pozzi F., Zamorani G., Franceschini A., Oliver S., Rowan-Robinson M., Serjeant S., 2002, MNRAS, 335, 831
- [Gruppioni et al. 2005] Gruppioni C., Pozzi F., Lari C.,Oliver S., Rodighiero G., 2005, ApJ, 618, L9
- [Hauser et al. 1998] Hauser M.G. et al., 1998, ApJ, 508, 25
- [Holland et al. 1999] Holland W. et al., 1999, MNRAS, 303, 659
- [Houck et al. 2004] Houck J.R. et al., 2004, ApJSS, 154, 18
- [Hughes et al. 1998] Hughes D. et al., 1998, Nature, 394, 241
- [Kim & Sanders 1998] Kim D.C., Sanders D.B., 1998, ApJS, 119, 41
- [King & Rowan-Robinson 2003] King A., Rowan-Robinson M., 2003, MNRAS, 339, 260
- [Kessler et al. 1996] Kessler M., et al., 1996, AA, 315, L27
- [La Franca et al. 2004] La Franca F., et al., 2004, MNRAS, 127, 3075
- [Le Floc’h et al. 2004] Le Floc’h E. et al., 2004, ApJSS, 154, 170
- [Lagache & Puget 2000] Lagache G., Puget J-L., 2000, AA, 355, 17L
- [Lagache, Dole, Puget 2003] Lagache G., Dole H., Puget J-L., 2003, MNRAS, 338, 555
- [Lagache et al. 2004] Lagache G. et al., 2004, ApJSS, 154, 112
- [Mann et al. 1997] Mann R.G. et al., 1997, MNRAS, 289, 482
- [Marleau et al. 2004] Marleau F.R. et al., 2004, ApJSS, 154, 66
- [Matute et al. 2004] Matute I. et al., 2002, MNRAS, 332, L11
- [Metcalfe et al. 2003] Metcalfe, L. et al. , 2003, AA, 407, 791
- [Mortier et al. 2004] Mortier A. et al., 2004, MNRAS, submitted
- [Murakami 2004] Murakami, H., 2004, ASTRO-F Infrared Sky Survey Mission, In: Space Telescopes and Instruments, Proc. SPIE 5487, in prep.
- [Oliver et al. 1997] Oliver S.J. et al., 1997, MNRAS, 289, 471
- [Oliver et al. 2000] Oliver S.J. et al., 2000, MNRAS, 316, 749
- [Oliver et al. 2002] Oliver S.J. et al., 2002, MNRAS, 332, 536
- [Papovich et al. 2004] Papovich C. et al., 2004, ApJSS, 154, 70
- [Pearson & Rowan-Robinson 1996] Pearson C.P.,Rowan-Robinson M., 1996, MNRAS, 283, 174
- [Pearson 2001a] Pearson C.P., 2001a, MNRAS 325, 1511
- [Pearson et al. 2001b] Pearson C.P., Matsuhara H., Onaka T., Watarai H., Matsumoto T., 2001b, MNRAS 324, 999
- [Pearson et al. 2004] Pearson C.P. et al., 2004, MNRAS, 347, 1113
- [Pearson et al. 2005] Pearson C.P., et al., 2005, in preparation
- [Pearson & Efstathiou 2005] Pearson C.P., Efstathiou A., 2005, in preparation
- [Peeters et al. 2004] Peeters E., Spoon H.W.W., Tielens A.G.G.M., 2004, ApJ, 613 986
- [Pozzi et al. 2003] Pozzi F. et al., 2003, MNRAS, 343, 1348
- [Pozzi et al. 2004] Pozzi F. et al., 2004, MNRAS, 609, 122
- [Rodighiero et al. 2004] Rodighiero G. Lari C., Fadda D., Franceschini A., Elbaz D., Cesarsky C., 2004, AA, astro-ph/0407639
- [Rowan-Robinson 1995] Rowan-Robinson M., 1995, MNRAS, 272, 737
- [Rowan-Robinson 2004] Rowan-Robinson M. et al, 2004, MNRAS, 351, 1290
- [Rush, Malkan & Spinoglio 1993] Rush B., Malkan M., Spinoglio L., 1993, ApJSS, 89, 1
- [Saunders et al. 2000] Saunders W.et al. 2000, MNRAS, 317, 55
- [Scott et al. 2002] Scott S.E. et al., 2000, MNRAS, 331, 817
- [Smail, Ivison & Blain 1997] Smail I., Ivison R.J., Blain A.W., 1997, ApJ, 490, L5
- [Serjeant et al. 2000] Serjeant S.B.G. et al., 2000, MNRAS, 316, 768
- [Shupe et al. 2000] Shupe D., 2005, in preperation
- [Spoon et al. 2004a] Spoon H.W.W. et al., 2004a, ApJSS, 154, 184
- [Spoon et al. 2004b] Spoon H.W.W., Moorwood A.F.M., Lutz D., Tielens A.G.G.M., Siebenmorgen R., Keane J.V., 2004b, AA, 414, 873
- [Soifer, Houck & Neugebauer 1987] Soifer B. T, Houck J.R., Neugebauer G., 1987, ARAA, 25, 187
- [Takagi & Pearson 2005] Takagi T., Pearson C.P., 2005, MNRAS, astro-ph/0410705
- [Vaccari et al. 2004] Vaccari M. et al. , 2002, MNRAS, astro-ph/0404315
- [Vaisanen et al. 2002] Vaisanen P. et al. , 2002, MNRAS, 337, 1043
- [Werner et al. 2004] Werner M.W. et al., 2004, ApJSS, 154, 1
- [Xu et al. 2001] Xu C., Lonsdale C.J., Shupe D.L., O’Linger J., Masci F., 2001, ApJ, 562, 179
- [Xu et al. 2003] Xu C., Lonsdale C.J., Shupe D.L., Franceschini A., Martin C., Schiminovich D., 2003, ApJ, 587, 90
- [Yan et al. 2004] Yan L. et al., 2004, ApJSS, 154, 60