Search for TeV emission from the region around PSR B1706–44 with the H.E.S.S. experiment
The region around PSR B1706–44 has been observed with the H.E.S.S. imaging atmospheric Cherenkov telescopes in 2003. No evidence for -ray emission in the TeV range was found at the pulsar position or at the radio arc which corresponds to the supernova remnant G 343.1–2.3. The 99 % confidence level flux upper limit at the pulsar position is FE assuming a power law () with photon index of and FE without an assumption on the spectral shape. The reported upper limits correspond to 8 % of the flux from an earlier detection by the CANGAROO experiment.
Key Words.:
Gamma rays: observations – ISM: individual objects: PSR B1706–44 – ISM: supernova remnants – ISM: individual objects: G 343.1–2.31 Introduction
PSR B1706–44 is a young pulsar (spin-down age of 17 kyrs) with distance estimates ranging from 1.8 to 3.2 kpc with a period of 102 ms and a spin-down luminosity of about 1% of the Crab pulsar (). Pulsed emission has been observed at radio and X-ray wavelengths, and in GeV -rays. An extended synchrotron nebula around this compact object has been found in radio observations (Giacani et al. (2002)) with an extension of 1’–4’ and with a flat spectrum (energy index of ), and also in X-rays (Gotthelf et al. (2002)) with an extension of ” and with a photon index of . These characteristics suggest the existence of a pulsar wind nebula (PWN) powered by the pulsar. In the TeV range, the CANGAROO experiment detected a steady emission coincident with the PWN position at a level of roughly 50 % of the Crab flux (Kifune et al. cangaroo (1995); Kushida et al. (2003)), suggesting that this PWN is the southern equivalent of the Crab nebula. The Durham Mark 6 collaboration (Chadwick et al. durham (1998)) reported also a significant detection above 300 GeV. A flux upper limit above GeV which is compatible with the CANGAROO flux has been derived using data from the BIGRAT telescope (Rowell et al. gavin (1998)).
PSR B1706–44 is coincident with an incomplete arc of radio emission (McAdam et al. (1993)) which has been interpreted as a shell-type supernova remnant (SNR) named G 343.1–2.3. This SNR has been detected only at radio wavelengths (Duncan et al. (1995)) and may be associated with the pulsar as discussed in Bock & Gvaramadze (2002).
We present here the results of the observation of the field of view around PSR B1706–44 with the H.E.S.S. experiment. H.E.S.S. is an atmospheric Cherenkov detector dedicated to the observation of TeV -rays (Hofmann (2003)). Situated in Namibia, the full four-telescope array is operational since December 2003. Each telescope has a mirror area of 107 (Bernlöhr et al. (2003)) and is equipped with a camera consisting of 960 photomultiplier tubes (PMT) (Vincent et al. (2003)). The system has a field of view of . In stereoscopic observation mode, it allows one to reconstruct the direction of individual showers with a precision better than .
2 Observations and data analysis
PSR B1706–44 was observed with two H.E.S.S. telescopes between April and July 2003. During this commissioning phase, GPS time stamps were used in the offline data analysis to identify showers observed in coincidence by the two telescopes. This coincidence requirement allows for a higher background rejection and thus for a better sensitivity than single telescope observations. In this configuration, a source with a flux of 5% of Crab nebula can be detected with more than in 4.5 hours at zenith angle. The pulsar was observed with 28-min runs in wobble mode, whereby runs are taken pointing away from the pulsar position in declination. Data affected by hardware problems or bad weather conditions were excluded from analysis. The proper functioning of the detector system was verified by numerous checks. The telescope pointing has been confirmed by correlating high PMT currents with bright stars in the field of view. The trigger rate of the system is well reproduced by simulations for cosmic rays, and the shape of simulated -ray images is consistent with the result of Crab observations. Data analysis is performed with two completely independent chains with different calibrations, with independent Monte Carlo simulations and with different analysis techniques.
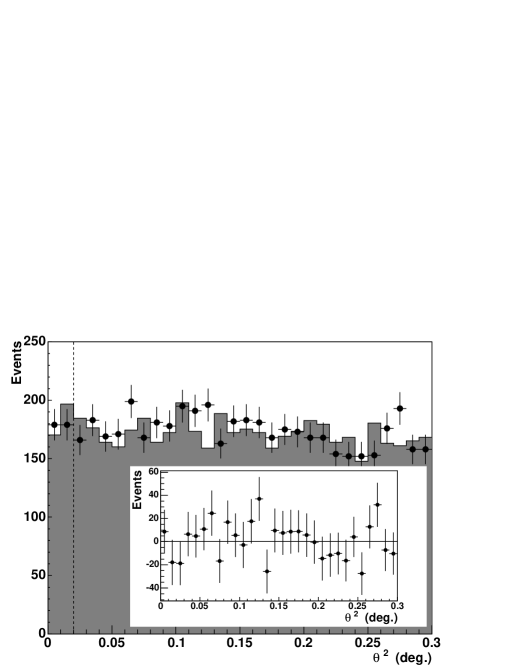
The selected data have a total live time of hours. The energy threshold estimated from Monte Carlo simulations at the average observation zenith angle () is about 350 GeV. This threshold is higher than for the four-telescope system since the telescopes were operated with higher trigger thresholds in the commissioning phase. Data were analysed using standard shower reconstruction and standard background rejection methods (Aharonian et al. (2004)). Standard cuts, optimised on Monte Carlo simulations, have been applied on mean scaled Hillas parameters in order to increase the signal-to-background ratio. Showers were classified using the angular distance between their reconstructed direction and the direction of possible source. For this standard analysis, showers were accepted as coming from the source (the ON region) when their was smaller than (i.e. angular distance smaller than ). The background was determined by counting events in a ring (the OFF region) centered at the investigated direction whose inner radius is larger () than the cut and whose area is 7 times larger than the ON region. A normalization factor is applied to these estimated background counts to correct for the different size of ON and OFF regions and the different radial acceptance in the field of view.
3 Results
A plot of relative to the PWN position is shown in Figure 1. The significance, calculated according to Li & Ma (1983), is . Table 1 provides an overview of the event statistics in the column labelled Standard. The analysis described above was repeated with the same cuts for every point in the field of view. The resulting significance map is presented in Fig. 2. It exhibits no significant point source excess in the vicinity of the pulsar or on the radio emission arc.
In order to roughly reproduce the conditions of the PSR B1706–44 detection by CANGAROO, the analysis at the pulsar position was repeated using a looser cut of and selecting events above an energy of 1 TeV. The results are shown in the column labelled CANGAROO of Table 1 and give no indication for a significant excess. For the analysis of the radio arc, a cut of has been applied around the position (17h08m,17’) and no significant excess is measured (column labelled Radio arc of Table 1).
|
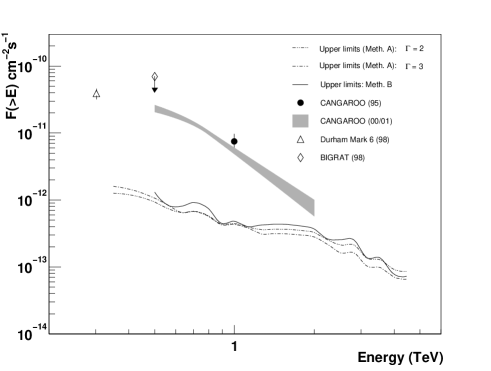
Limits on the integral flux above certain energies were obtained using two different methods. The first method (Method A) tests the hypothesis that the number of excess events with energies above result from a source with a power law spectrum with a (positive) photon index . The photon index was varied between and . This range includes the value of from the earlier CANGAROO detection. The second method (Method B) makes no assumption about the source spectrum and calculates the integrated flux directly as the difference of the measured flux from the ON region and the flux of cosmic-rays from the OFF region:
Here, is the live time, and both sums on the ON and OFF regions run over all showers with reconstructed energies greater than . The effective areas () depend on the zenith angle and energy of each event, and is the normalization factor. As is determined using the reconstructed energy, the energy threshold should be increased such that the bias of the reconstructed energy is less than 10 %. The upper limits derived with both methods were calculated using the unified approach of Feldman & Cousins (new (1998)) and a confidence level of 99 %. To compare the upper limits from Method B with a prediction, the investigated model spectrum must be integrated over all energies starting at .
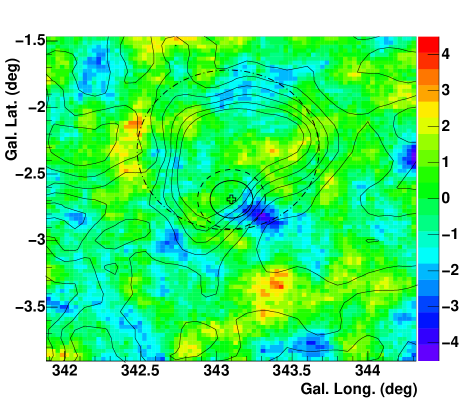
Table 2 gives the values of flux upper limits at 99 % confidence level for various cuts and methods; both methods give similar results. With method A, the upper limit at the PWN position corresponds to % of the flux from the Crab Nebula (at the same energy threshold) and the upper limit for the radio arc corresponds to % of the flux from the Crab Nebula. The upper limit which reproduces the experimental conditions of the CANGAROO experiment corresponds to % of the flux reported by that collaboration.
|
||||||||||||||||||||||
4 Discussion and Conclusions
The reported upper limits on the flux of TeV -rays are roughly one order of magnitude lower than the reported CANGAROO flux and a factor of 55 lower than earlier limits (Rowell et al. gavin (1998)). The CANGAROO observations were not contemporaneous with the H.E.S.S. observations, which raises the question of whether the TeV emission could be variable on a time scale of years. Such a variability seems unlikely given our current understanding of PWN (Blondin et al. (2001)). Another potential reason for the discrepancy could be an object confusion along the line of sight. There are, however, no BL Lac objects or variable galactic TeV -ray emitters known around the pulsar. It has been pointed out (Aharonian et al. Felix (1997); Kushida et al. (2003)) that the high flux level reported by CANGAROO is surprising. Since the X-ray luminosity is about 0.01 % of that of the Crab PWN, the TeV -rays should be emitted from a much larger volume than the X-rays, according to the inverse Compton (IC) scenario.
Using the H.E.S.S. flux upper limit above TeV, a lower limit on the magnetic field can be derived from Eq. 6 of Aharonian et al. (Felix (1997)). This requires a measurement of the flux in the X-ray band from the same electron population that emits the hypothetical TeV radiation. Measurements by Chandra (Gotthelf et al. (2002)) provide a flux from the PWN, excluding the point-like emission of the central source; however, their chosen analysis region (radius less than ) is smaller than the full extent of the PWN, for which Finley et al. (finley (1998)) found a best-fit exponential scale length of . The flux measured by ASCA (Finley et al. finley (1998)) encompasses the entire PWN, but also includes the pulsar emission. To estimate the PWN flux, we used the ASCA spectrum but subtracted a point source contribution estimated from ROSAT HRI to be % (Finley et al. finley (1998)), yielding an unabsorbed flux of erg s-1 cm-2 in the 2–10 keV band for the PWN. The lack of observable X-ray emission below about 0.5 keV due to interstellar absorption means that the electrons producing the observed X-rays have somewhat higher energy than those producing TeV -rays, and an extrapolation of the X-ray spectrum to lower energies is necessary. The spectral index measured with ASCA, , is fully compatible with the more precise determination from BeppoSAX, (Mineo et al. (2002)). The derived lower limit on the magnetic field strength is then about 1 G when one assumes that the inverse Compton scattering involves only the photons of the microwave background radiation and assuming the same photon index in the X-ray and TeV band. This value is however not very constraining given that the mean Galactic magnetic field is of the same order of magnitude.
Acknowledgements.
The support of the Namibian authorities and of the University of Namibia in facilitating the construction and operation of H.E.S.S. is gratefully acknowledged, as is the support by the German Ministry for Education and Research (BMBF), the Max Planck Society, the French Ministry for Research, the CNRS-IN2P3 and the Astroparticle Interdisciplinary Programme of the CNRS, the U.K. Particle Physics and Astronomy Research Council (PPARC), the IPNP of the Charles University, the South African Department of Science and Technology and National Research Foundation, and by the University of Namibia. We appreciate the excellent work of the technical support staff in Berlin, Durham, Hamburg, Heidelberg, Palaiseau, Paris, Saclay, and in Namibia in the construction and operation of the equipment. We would also like to thank the Australia Telescope National Facility (ATNF) for provision of 2.2 GHz radio data.References
- (1) Aharonian, F., Atoyan A.M. and Kifune T., 1997, MNRAS, 291, 162
- Aharonian et al. (2004) Aharonian, F., Akhperjanian, A.G., Aye, K.-M., et al., 2004, accepted by Astron. & Astrophys. (astro-ph/0411582)
- Becker et al. (1995) Becker, W., Brazier, K.T.S., Trümper, J., 1995, Astron. & Astrophys., 298, 528
- Bernlöhr et al. (2003) Bernlöhr, K., Carrol, O., Cornils, R., et al., 2003, APh., 20, 111
- Blondin et al. (2001) Blondin, J.M., Chevalier, R.A., Frierson, D.M., 2001, ApJ, 563, 80
- Bock & Gvaramadze (2002) Bock, D.C.-J. & Gvaramadze, V.V., 2002, Astron. & Astrophys., 394, 533
- (7) Chadwick, P.M., Dickinson, M.R., Dipper, N.A., et al., 1998, APh, 9, 131
- Duncan et al. (1995) Duncan, A.R., Steward, R.T., Haynes, R.F., Jones, K.L., 1995, MNRAS, 277, 36
- (9) Feldman, G.J. & Cousins, R.D., 1998, Phys. Rev. D, 57, 7
- (10) Finley, J.P., Srinivasan, R., Saito, Y., et al., 1998, ApJ, 493, 884
- Giacani et al. (2002) Giacani, E.B., Frail, D.A., Goss, W.M., Vieytes, M., 2001, AJ, 121, 313
- Gotthelf et al. (2002) Gotthelf, E.V., Halpern, J.P., Dodson, R., 2002, ApJ, 567, L125
- Hofmann (2003) Hofmann, W., 2003, Proc. 28th ICRC, Tsukuba, Univ. Academy Press, Tokyo, p. 2811
- (14) Kifune, T., Tanimori, T., Ogio, S., et al., 1995, ApJ, 438, L91
- Kushida et al. (2003) Kushida, J., Tanimori, T., Kubo, H., et al., Proc. 28th Int. Cosmic Ray Conf., Tsukuba (2003), Univ. Academy Press, Tokyo, p. 2493
- Li & Ma (1983) Li, T.-P. & Ma, Y.-Q., 1983, ApJ, 272, 317
- McAdam et al. (1993) McAdam, W.B., Osborne, J.L., Parkinson, M.L., 1993, Nature, 361, L516
- Mineo et al. (2002) Mineo, T., Massaro, E., Cusumano, G.,Becker, W., 2002, Astron. & Astrophys., 392, 181
- (19) Rowell, G.P., Dazeley, S.A., Edwards, P.G., Patterson, J.R., Thornton, G.J., 1998, APh, 194, 332
- Vincent et al. (2003) Vincent, P., Denance, J.-P., Huppert, J.-F., et al. , 2003, Proc. 28th ICRC, Tsukuba, Univ. Academy Press, Tokyo, p. 2887