Whiting 1: a new Halo Young Globular Cluster
Abstract
We report on CCD photometry of a field centered in the region of the Galactic star cluster Whiting 1 down to . This cluster has never been studied insofar, and we provide for the first time estimates of its fundamental parameters, namely, radial extent, age, distance and reddening. Whiting 1 turns out to be a compact star cluster with a diameter of about 1′. We find that the cluster is about 5 Gyr old and has a probable metal abundance around [Fe/H]= -1.20. Its position at and at a heliocentric distance of about 45 kpc makes the cluster a rather strange object, surely not a disk old open cluster, but perhaps the youngest halo Globular Cluster insofar known.
1 Introduction
Whiting 1 (WHI B0200-03, l = 161.62∘,
b= -60.64∘; J2000 = 2h02m57s,
= -3∘15’10”) was discovered by Whiting et al. (2002)
during a search for Local Group Dwarf Galaxies in the Southern
Hemisphere. A 1200 secs V-band image (their Fig. 4) reveals that
this object is a star cluster very well resolved.
The authors comment that it is a cluster of blue stars with
a distant galaxy cluster in the background.
This is probably the reason for which Whiting 1 has later on
classified as a Galactic open cluster (Dias et al. 2002).
However its faintness and the particular location in the Milky Way
in the anticenter direction at cast some doubts on its open
cluster nature.
In this paper we provide new photometric data with the aim to clarify
the cluster nature and to derive the first estimates of its
fundamental parameters.
The layout of the paper is as follows. Sect. 2 illustrates
the observation and reduction strategies.
An analysis of the geometrical
structure and star counts in the field of the cluster
are presented in Sect. 3, whereas a discussion of
the Color-Magnitude Diagrams (CMD) is performed in Sect. 4.
Sect. 5 deals with the determination of clusters reddening,
distance and age and,
finally, Sect. 6 summarizes our findings.
2 Observations and Data Reduction
CCD observations were carried out with the eight CCD camera on-board
the 1. 0m telescope at Cerro Tololo Interamerican Observatory (CTIO,Chile), in the nights of
December 15 to 16, 2004.
With a pixel size of , and a CCD size of 512 512
pixels,
this samples a field in the sky.
The details of the observations are listed in Table 1 where the observed
fields are
reported together with the exposure times, the average seeing values and the
range of air-masses during the observations.
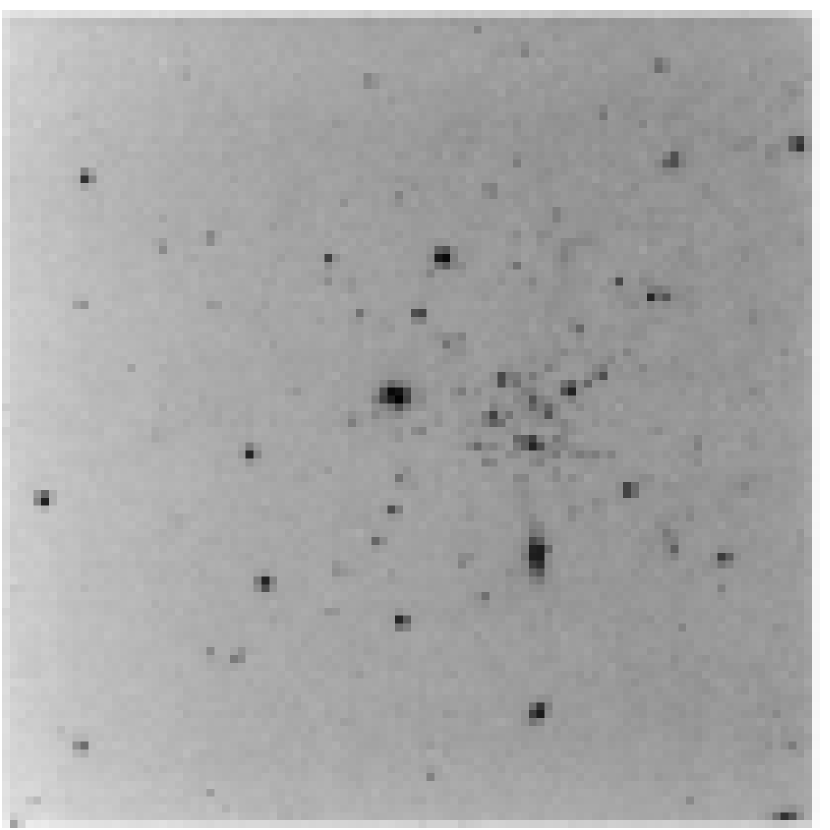
Figs. 1 shows a 900 secs I band image of the area of
Whiting 1. In the figure East is up, and North on the right.
The data have been reduced with the IRAF111IRAF is distributed by NOAO, which are operated by AURA under cooperative agreement with the NSF. packages CCDRED, DAOPHOT, ALLSTAR and PHOTCAL using the point spread function (PSF) method (Stetson 1987). The two nights turned out to be photometric and very stable, and therefore we derived calibration equations for all the 130 standard stars observed during the two nights in the Landolt (1992) fields SA 95-41, PG 0231+051, Rubin 149, Rubin 152, T phe and SA 98-670 (see Table 1 for details).
The calibration equations turned out of be of the form:
,
where are standard magnitudes, are the instrumental ones and is the airmass; all the coefficient values are reported in Table 2. The standard stars in these fields provide a very good color coverage. The final r.m.s. of the calibration are 0.049, 0.034 and 0.033 for the B, V and I filter, respectively.
Photometric errors have been estimated following Patat & Carraro (2001).
It turns out that stars brighter than
mag have
internal (ALLSTAR output) photometric errors lower
than 0.10 mag in magnitude and lower than 0.18 mag in color.
The final photometric catalog for Whiting 1 (coordinates,
B, V and I magnitudes and errors)
consists of 1757 stars and are made
available in electronic form at the
WEBDA222http://obswww.unige.ch/webda/navigation.html site
maintained by J.-C. Mermilliod.
3 Star counts and cluster size
Dias et al. (2002) report a preliminary estimate
of Whiting 1 diameter amounting to 1.2 arcmin.
By inspecting Fig 1 we can recognize that Dias et al. estimate
is surely a reasonable one.
Since our photometry covers entirely the clusters area and part
of the surroundings, we performed star counts to obtain
an improved estimate of the clusters size.
We derived the surface stellar density by performing star counts
in concentric rings around the clusters nominal center
and then dividing by their
respective surfaces. Poisson errors have also been derived and normalized
to the corresponding surface. Poisson errors in the field star counts
turned out to be very small, and therefore we are not going to show them.
The final radial density profile for Whiting 1 is shown in Fig. 2
as a function of V magnitude.
The contribution of Galactic disk field has been estimated by considering
all the stars in the corresponding
magnitude bin, located outside 1.6 arcmin from the cluster center,
and by normalizing counts over the adopted area.
The cluster seems to be populated by stars of magnitude in the range
, where it clearly emerges from the background.
In this magnitude range the radius is not larger than 0.5 arcmin.
In conclusion, we are going to adopt the value of 0.5 arcmin as
Whiting 1
radius throughout this paper. This estimate is in good agreement with
the value of 1.2 arcmin reported by Dias et al. (2002) for the cluster
diameter.
4 The Colour-Magnitude Diagrams
In Fig. 3 we present the CMDs of Whiting 1 for all the detected stars.
In the left panel of the same figure we show the CMD in the
vs plane, whereas in the right panel we show
the CMD in the vs plane.
These CMDs are not very easy to be interpreted, due to
the faintness of the stars.
However we can recognize a wide Main Sequence (MS) in both the CMDs,
extending from , where the Turn Off Point (TO) is located
down to .
The upper part of the CMD is more confused. It seems that a Sub-giant
Branch (SGB) is actually present, and that the Red Giant Branch (RGB) starts
rising at , . The RGB however
is poorly populated. A group of stars at
, may indicate the
presence of a clump.
Better information can be derived from Fig. 4, where we show
the CMDs of Whiting 1 as a function of the distance from the cluster
nominal center. Here we consider only stars having errors in V-band
lower than 0.15 mag (see Sect. 2).
In the left panel all the stars are plotted, whereas in the middle panel
we only plot the stars which lie within the cluster radius (see Sect 3).
Finally, in the right panel we plot the stars outside the cluster
region, to show how the Galactic Field toward the cluster looks like.
Interestingly, the MS in the middle panel gets much thinner, and we can locate the TO at
, . The RGB is scarcely populated
and the presumed clump disappears.
Most of the stars in the left panel located in the RGB region and
in the red edge of the MS come from the field
shown in the right panel.
In conclusion, the overall shape of the CMD in the middle panel is
reminiscent of an old cluster.
5 Cluster fundamental parameters
In this section we provide estimates of Whiting 1
basic parameters.
We start deriving a first guess of the cluster reddening by using
FIRB maps by Schlegel et al. (1998). We obtain E(B-V) = 0.026,
a very low value as expected for a cluster located at
high Galactic latitude.
At this point, since we do not have any other information,
we have to rely on a detailed comparison between the CMD morphology
and theoretical isochrones. In the following analysis
we are going to adopt the Padova isochrones (Girardi et al. 2000).
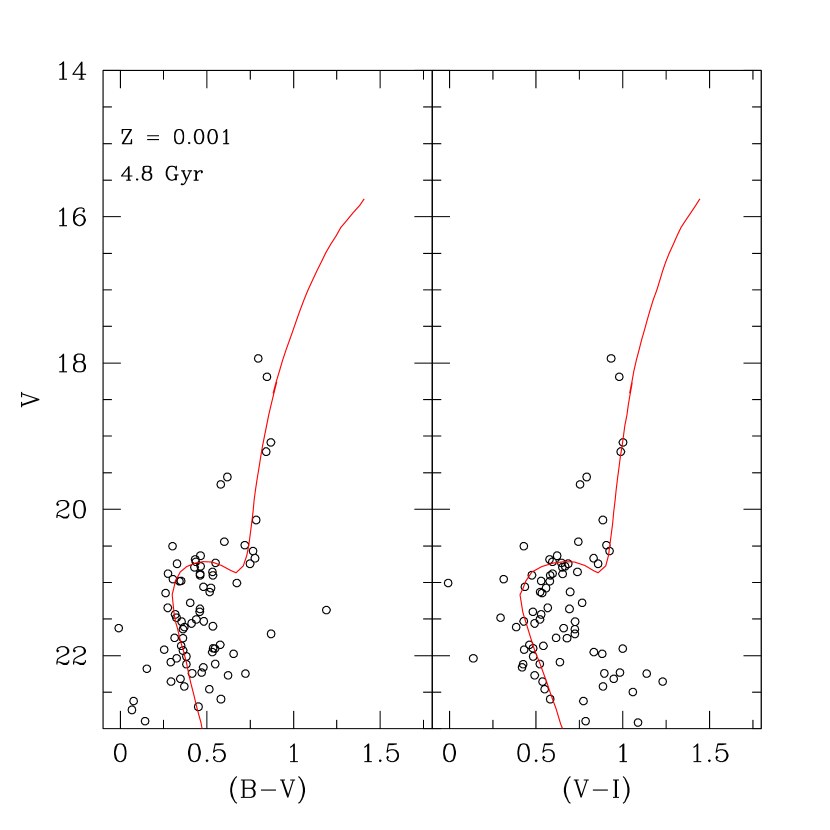
In Fig. 5 and 6 we play with age and metallicity, trying to encounter
the best overall fit of the CMD.
In details, in Fig. 5 we keep the metallicity fixed to Z=0.001
and change the age from 3.8 to 5.6 Gyrs. In both the CMD the best fit
is provided by the age of 4.8 Gyrs (dashed-dotted line) which
implies a reddening E(B-V)= 0.04 and E(V-I)=0.05. The older isochrone
(5.6 Gyr) implies an untenable E(B-V) = 0.00, or slightly negative,
while the youngest one (3.8 Gyr) implies a reddening E(B-V) = 0.12,
which is still acceptable, but the overall fit of the red part
of the CMD looks very poor.
On the other hand, in Fig. 6 we keep the age of 4.8 Gyr fixed and play
with metallicity. In this case the best fit is provided by Z=0.001.
The fit with a lower metal abundance is not so bad as well,
while the larger metallicity isochrone poorly fits the CMD
and implies a negative reddening.
From this exercise we infer that the cluster metal abundance is around Z=0.001 and the age around 5 Gyrs. The best fit is therefore outlined in Fig. 7, and from this we derive a distance modulus =18.4 and a reddening E(B-V)=0.04. As a consequence, we obtain a heliocentric distance of about 45 kpc. The results we achieved are listed in detail in Table 3.
6 Conclusions
We have presented the first CCD photometric study of the
star cluster Whiting 1. The CMDs we derive allow us to
infer estimates of the cluster basic parameters, which
are summarized in Table 3.
In detail, we find that:
-
Whiting 1 is a compact star cluster with a radius of 0.5 arcmin;
-
we propose that it is a 5 Gyr old cluster with a low metal content Z = 0.001 ([Fe/H] -1.20);
-
its position high onto the Galactic plane and its distance from the Sun ( 45 Kpc) can hardly be reconciled with Whiting 1 being a disk old open cluster.
The combination of age, position and metallicity makes Whiting 1
a very puzzling object.
We can rule put the hypothesis of an old open cluster, because
of the low metal content, and mostly beacuse of its positions.
The cluster bears some similarities with Palomar 1 (Rosenberg et al. 1998),
an 8 Gyr old globular cluster, and other transitional
clusters like Terzan 7, Ruprech 106 and others mentioned in Rosenberg et al. (1998).
Following the kind of discussion
by Rosenberg et al. (1998), we here tentatively propose that
Whiting 1 is the Milky Way youngest globular cluster insofar known,
although a clear explanation for its formation and evolution
remains very challenging.
References
- Dias et al. (2002) Dias W.S., Alessi B.S., Moitinho A., Lepine J.R.D., 2002, A&A 389, 871
- Girardi et al. (2000) Girardi L., Bressan A., Bertelli G., Chiosi C., 2000, A&AS 141, 371
- Landolt (1992) Landolt A.U., 1992, AJ 104, 340
- Patat & Carraro (2001) Patat F., Carraro G., 2001, MNRAS 325, 1591
- Rosenberg et al. (1998) Rosenberg A., Saviane I., Piotto G., Aparicio A., Zaggia S., 1998, AJ 115, 648
- Schlegel et al. (1998) Schlegel, D., Finkbeiner, D., & Davis, M., ApJ , 1998, 500, 525.
- Stetson (1987) Stetson P.B. 1987, PASP 99, 191
- Whiting et al. (2002) Whiting A.B., Hau G.K.T., Irwin M., 2002, ApJS 141, 123


| Field | Filter | Exposure time | Seeing | Airmass |
|---|---|---|---|---|
| [sec.] | [] | |||
| Whiting 1 | B | 120,1200,1800 | 1.2 | 1.12-1.20 |
| V | 30,600,900 | 1.3 | 1.12-1.20 | |
| I | 30,600,900 | 1.2 | 1.12-1.20 | |
| SA 98-671 | B | 120 | 1.2 | 1.24-1.26 |
| V | 40 | 1.4 | 1.24-1.26 | |
| I | 20 | 1.4 | 1.24-1.26 | |
| PG 0231+051 | B | 120 | 1.2 | 1.20-2.04 |
| V | 40 | 1.5 | 1.20-2.04 | |
| I | 20 | 1.5 | 1.20-2.04 | |
| T Phe | B | 120 | 1.2 | 1.04-1.34 |
| V | 40 | 1.3 | 1.04-1.34 | |
| I | 20 | 1.3 | 1.04-1.34 | |
| Rubin 152 | B | 120 | 1.3 | 1.33-1.80 |
| V | 40 | 1.2 | 1.33-1.80 | |
| I | 20 | 1.2 | 1.33-1.80 | |
| Rubin 149 | B | 120 | 1.1 | 1.21-1.96 |
| V | 40 | 1.2 | 1.21-1.96 | |
| I | 20 | 1.2 | 1.21-1.96 | |
| SA 95-41 | B | 120 | 1.2 | 1.05-1.48 |
| V | 40 | 1.2 | 1.05-1.48 | |
| I | 20 | 1.1 | 1.05-1.48 |
| Metallicity | ||||||||
|---|---|---|---|---|---|---|---|---|
| 0.5 | 0.04 | 0.05 | 18.4 | 28.9 | 6.9 | -39.0 | 5.0 | 0.001 |