O VI Column Density Distribution in the Local Bubble - Results from 3D Adaptive Mesh Refinement Simulations
Abstract
The Local Bubble (LB) is an X-ray emitting region extending 100 pc in radius in the Galactic plane and 300 pc perpendicular to it, and it is embedded in a somewhat larger Hi deficient cavity. Its origin and spectral properties in UV, EUV and X-rays are still poorly understood. We have performed 3D high resolution (down to 1.25 pc) hydrodynamic superbubble simulations of the LB and Loop I superbubble in a realistic inhomogeneous background ISM, disturbed by supernova (SN) explosions at the Galactic rate. We can reproduce (i) the size of the bubbles (in contrast to similarity solutions), (ii) the interaction shell with Loop I, discovered with ROSAT, (iii) predict the merging of the two bubbles in about 3 Myr, when the interaction shell starts to fragment, and, (iv) the generation of blobs like the Local Cloud as a consequence of a dynamical instability. The O VI column densities are monitored and found to be in excellent agreement with Copernicus and FUSE absorption line data, showing LB column densities , in contrast to other existing models.
Department of Mathematics, University of Évora, R. Romão Ramalho 59, 7000 Évora, Portugal. Email:mavillez@galaxy.lca.uevora.pt
Institut für Astronomie, Universität Wien, Türkenschanzstr. 17, A-1180 Wien, Austria. Email: breitschwerdt@astro.univie.ac.at
1. Introduction
Standard Local Bubble (LB) models fail to reproduce the observed low O VI absorption column density (Shelton & Cox 1994; for a recent discussion see Breitschwerdt & Cox 2004). Heliospheric in situ measurements are sensitive to the boundary conditions imposed by the Local Bubble and the O VI column density in absorption is a crucial test for modelling of the local ISM (Cox 2004). It seems most plausible that the LB is theresult of 20 successive explosions, originating from stars with masses between 11 and 20 from the moving subgroup B1 of the Pleiades in the last 14.5 Myrs (Berghöfer & Breitschwerdt 2002). We have simulated the LB evolution by means of a 3D AMR hydrocode and calculated the observed O VI column density in absorption (along lines of sight crossing Loop I).
2. Model and Simulations
We use the 3D model of Avillez (2000), where the ISM is disturbed by supernova (SN) explosions at the Galactic rate, and took data cubes of previous runs with a finest adaptive mesh refinement resolution of 1.25 pc (Avillez & Breitschwerdt 2004). We then picked up a site with enough mass to form the 81 stars, with masses, , between 7 and 31 , that compose the Sco Cen cluster; 39 massive stars with have already gone off, generating the Loop I cavity.
Jpeg image LB.jpg
Presently the Sco Cen cluster (here located at pc) has 42 stars to explode in the next 13 Myrs). We followed the trajectory of the moving subgroup B1 of Pleaides, whose SNe in the LB went off along a path crossing the solar neighbourhood (Fig. 1). Periodic boundary conditions are applied along the four vertical boundary faces, while outflow boundary conditions are imposed at the top ( kpc) and bottom ( kpc) boundaries. The simulation time of this run was 30 Myr.
3. Results
Morphology: The locally enhanced SN rates produce coherent LB and Loop I structures (due to ongoing star formation) within a highly disturbed background medium. The successive explosions heat and pressurize the LB, which at first looks smooth, but develops internal temperature and density structure at later stages. After 14 Myr the LB cavity, bounded by an outer shell, which will start to fragment due to Rayleigh-Taylor instabilities in Myr from now, fills a volume roughly corresponding to the present day size (Fig. 1).
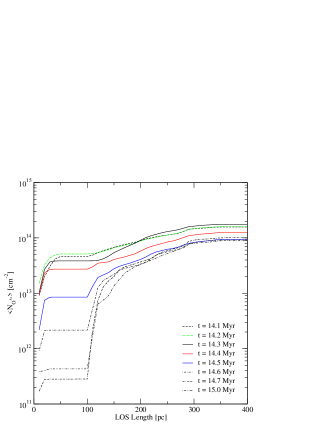
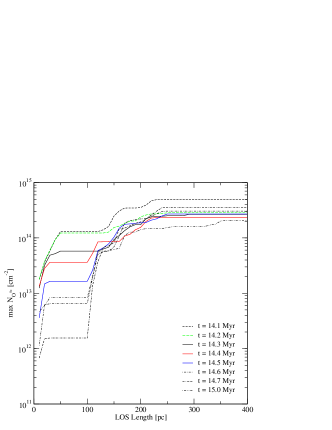
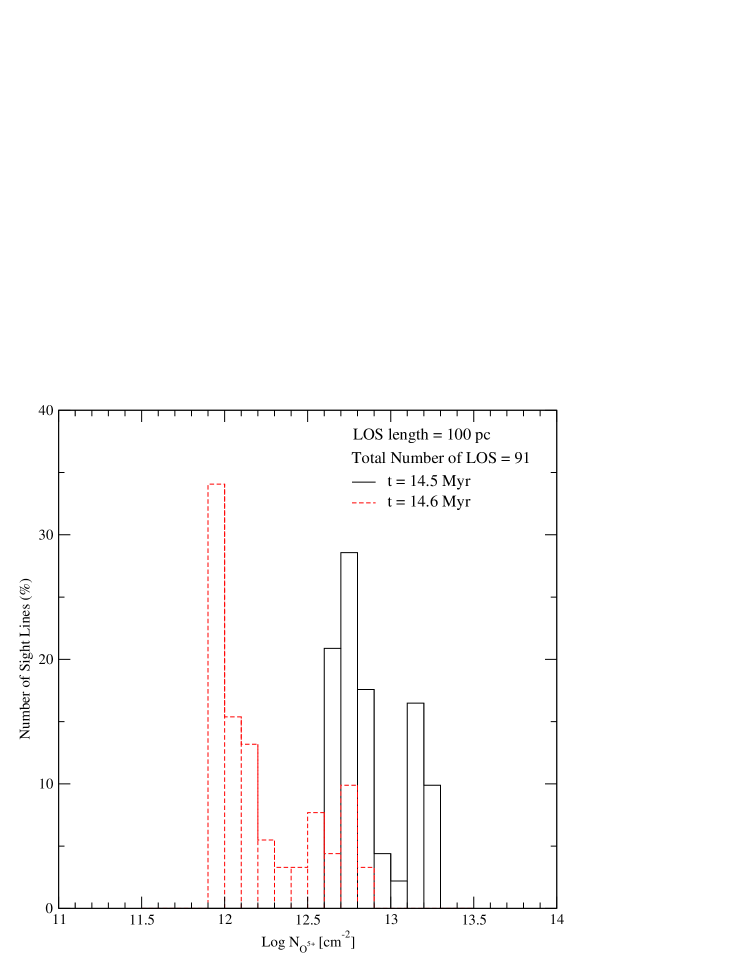
Oxygen vi: The average and maximum column densities of O VI, i.e., and are calculated along 91 lines of sight (LOS) extending from the Sun and crossing Loop I from an angle of to (s. Fig. 1). Within the LB (i.e., for a LOS length pc) and decrease steeply from to cm-2 and from to cm-2, respectively, for Myr (Fig. 2), because no further SN explosions occur and recombination is taking place. For LOS sampling gas from outside the LB (i.e., pc) and cm-2. The histograms of column densities obtained in the 91 LOS for and 14.6 Myr (Fig. 3) show that for Myr all the LOS have column densities smaller than cm-2, while for Myr 67% of the lines have column densities smaller than cm-2 and in particular 49% of the lines have cm-2.
Noting that in the present model for Myr the O VI column densities are smaller than cm-2 and cm-2 (blue line in both panels of Fig. 2) and that a mean column density of cm-2 is inferred from analysis of FUSE absorption line data in the Local ISM (Oegerle et al. 2004) we estimate that the present LB time is Myr.
4. Conclusions
The O VI column density is a sensitive tracer of the age of an evolved superbubble, and can thus give a constraint on the timescale of the last explosion, which occurred in the present simulations Myr ago, whereas the nearest explosions to the Sun happened Myr ago, in good agreement with the most recent dating inferred from isotope analysis in the ferromanganese crust of deep ocean layers (Knie et al. 2004).
Acknowledgements M.A. would like to thank the organization for the financial support to attend this excellent conference.
References
Avillez, M. A. 2000, MNRAS, 315, 479.
Avillez, M. A., & Breitschwerdt, D. 2004, A&A, 425, 899
Berghöfer, T., & Breitschwerdt, D. 2002, A&A, 390, 299.
Breitschwerdt, D., & Cox, D. P. 2004, in “How does the Galaxy Work?”, eds. E. Alfaro, E. Perez, & J. Franco, Kluwer (Dordrecht), p. 391
Cox, D. P. 2004, Ap&SS, 289, 469
Knie, K., et al. 2004, Phys. Rev. Lett., 93, 17
Oegerle, W. R., et al. 2004, ApJ, submitted [astro-ph/0411065]
Shelton, R., & Cox, D. P. 1994, ApJ, 434, 599