Panchromatic models of galaxies: GRASIL
Abstract
We present here a model for simulating the panchromatic spectral energy distribution of galaxies, which aims to be a complete tool to study the complex multi-wavelength picture of the universe. The model take into account all important components that concur to the SED of galaxies at wavelengths from X-rays to the radio. We review the modeling of each component and provide several applications, interpreting observations of galaxy of different types at all the wavelengths.
1 Introduction
The direct study of the process of formation and evolution of galaxies is now a realistic aim of observational cosmology. Thanks to facilities such as the HST, ISO, Chandra, XMM-Newton, SCUBA etc, now the theories of galaxy formation can be directly tested against multiwavelength observations of galaxies at different cosmological epochs.
A panchromatic approach is critical both to obtain diagnostics of the various physical phenomena as well as to estimate the amount of reprocessing, due to the ISM, of the radiation produced by primary processes. In particular, a proper treatment of dust attenuation is compulsory when estimating the SFR from rest-frame UV luminosities (e.g. the cosmic SFR from Lyman Break Galaxies). This is particularly true if we consider that star forming regions are particularly dense and dusty environments. In a galaxy, dust reprocessing affects more the youngest stellar population, and the ensuing picture is much more complex than simple attenuation models frequently used. On the other hand, thermal emission from dust in these regions provides an alternative way to determine the star formation activity.
To interpret the presently available observations, galaxy evolution models should include a careful treatment of the above mentioned effects. In this contribution, we review our population synthesis model GRASIL111The code is available at http://adlibitum.oat.ts.astro.it/silva/default.html or http://web.pd.astro.it/granato/grasil/grasil.html, which predicts time dependent SEDs of galaxies from X-rays to radio, including state-of-the-art treatment of dust and PAH reprocessing Silva et al. (1998); Granato et al. (2000), production of radio photons by thermal and non-thermal processes Bressan et al. (2002), nebular lines emission Panuzzo et al. (2003), molecular line emission, and X-rays expected from stellar populations.
2 Dust reprocessing
One of the most important distinctive features of GRASIL is that it has included, for the first time, the effect of age selective extinction of stellar populations (younger stellar generations are more affected by dust obscuration), mainly (but not only, see below) due to the fact that stars form in a denser than average environment, the molecular clouds (MCs), and progressively get rid of them.
Once the star formation and chemical enrichment histories of a galaxy are given, GRASIL computes the interaction between the stellar radiation and dust using a relatively realistic and flexible geometry for both stars and dust. In general, the system is described as a superposition of an exponential disk component and a bulge component, the latter modeled by a King profile. The ISM is divided into two phases, the diffuse ISM, corresponding to cirrus dust, and the much denser molecular clouds (MCs). Also, the fact that new stars are born inside MCs and progressively get rid of them (either because they escape or because the clouds are destroyed) is taken into account. This process leads to an age selective extinction of stellar generations, in the sense that the younger the stars, the more they are affected by dust obscuration in MCs. This is described in GRASIL assuming that the fraction of starlight radiated inside the clouds by stars is a function of the star age. In practice, if is the timescale for the process, 100% of the stars younger than are considered to radiate inside the MCs, and this percentage goes linearly to 0% in . The timescale is a fundamental parameter, which seems to be quite longer in starbursts than in normal disk-like galaxies Silva et al. (1998).
The starting input for GRASIL is the history of star formation and chemical enrichment of the system. This is computed by some external code, which can result from a complex scenario for the formation of galaxies in a cosmological context (e.g. Granato et al. (2001, 2004); Baugh et al. (2004)), or a standard chemical evolution model for the formation of a single galaxy. Here, as in Silva et al. Silva et al. (1998), we follow the latter approach.
The total gas mass (diffuse+MCs) of the galaxy at time is given by the chemical evolution model. The relatively fraction of molecular gas is a free parameter of the code, . The total molecular mass, is then subdivided into spherical clouds of mass and radius, and . Then, the radiative transfer of starlight through the MCs and diffuse ISM. The original version of GRASIL presented in Silva et al. Silva et al. (1998) used only a single population of MCs all with the same mass and radius, the code has been later updated to treat many populations, each one characterized by its mass , radius and total mass in the population (Silva, 1999, PhD thesis Silva (1999)).
The ratio between gas mass and dust mass is usually assumed to scale linearly with the metallicity of the residual gas. This quantity times determine the optical depth of the clouds. The predicted SED depend on and only through the combination , which is the true free parameter.
For the dust composition a mixture of graphite and silicate grains and PAH is adopted, with size distributions triggered to match the extinction and emissivity properties of the local ISM (for more details see Silva et al. Silva et al. (1998)). However the code has the flexibility to modify the dust mixture, and to differentiate between MCs and cirrus.
The SSPs included in GRASIL are based on the Padova stellar models, and cover a large range of ages and metallicities. Starlight reprocessing from dust in the envelopes of AGB stars is included directly into the SSPs, as described by Bressan et al. Bressan et al. (1998).
3 Radio emission
The existence of a correlation between FIR and Radio emission is locally well established over a significant range of luminosity, from normal spirals to the most extreme ULIRGs. At 1.49 GHz, Sanders and Mirabel (1996). This correlation suggests that non-thermal (NT) emission is related to the recent star formation and the most likely mechanism is synchrotron emission from relativistic electrons accelerated into the shocked interstellar medium, following core collapsed supernova (CCSN) explosions Condon and Yin (1990). Its small scatter testifies the universal proportions with which energy is radiated away at IR and radio wavelengths. Its validity has been recently confirmed up to redshift Garrett (2002) and it is widely extrapolated much beyond, to estimate the redshift of more distant objects (e.g. Carilli and Yun (2000)).
In order to increase the diagnostic capabilities of GRASIL, Bressan, Silva & Granato Bressan et al. (2002) have extended its domain into the radio wavelengths. In brief, two main components were considered, the thermal emission from H ii regions and synchrotron emission from relativistic electrons. The thermal component (), is proportional to the number of hydrogen ionizing photons () derived from the adopted SSPs:
| (1) |
The non-thermal () component has been calibrated with the NT emission and the CCSN rate () of our Galaxy, after accounting for the small contribution, 6%, of radio supernova remnants ():
| (2) |
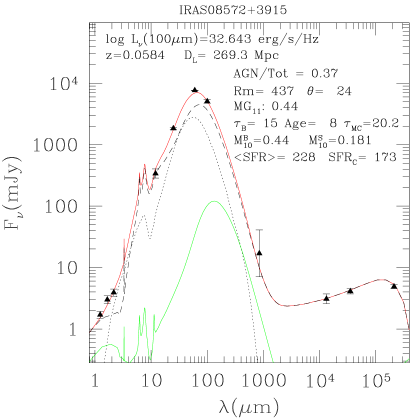
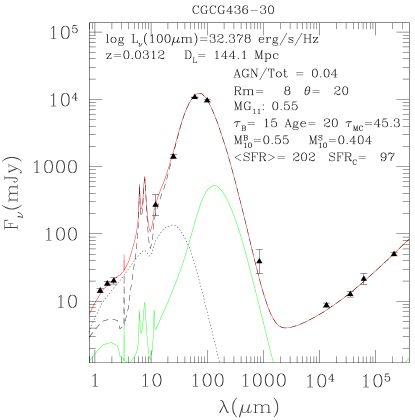
Though the calibration with our galaxy is quite uncertain, with these assumptions Bressan et al. Bressan et al. (2002) and Panuzzo et al. Panuzzo et al. (2003) were able to reproduce well the FIR/Radio correlation of normal star forming galaxies, namely 2.35. Bressan et al. Bressan et al. (2002) have also shown that, due to different spectral index of thermal and NT radio emission and the delay of CCSN explosions, radio emission can be used to analyze obscured starbursts with a time resolution of a few tens of Myr, unreachable with other star formation indicators. This is shown in Figure 1, from Prouton et al. Prouton et al. (2004). A systematic study of compact ULIRGs from NIR to radio wavelengths is underway (Clemens et al. in preparation). This will provide important clues on the contribution of the AGN in ULIRGs and on the technique of photometric redshift determination of high-z obscured sources.
4 Molecular lines
The emission from molecular lines is used to diagnose the physical conditions within star forming molecular clouds. In fact, emission lines such as those from CS, HCN and HCO+ are excited only in high density gas, while others (e.g. 12CO) trace more typical regions in the cold ISM. The study of the physical conditions of the star formation regions, the star formation efficiencies, the quantification of the contamination of molecular lines to the sub-mm continuum, and the possibility of obtaining spectroscopic redshifts of distant galaxies using molecular lines are some of the challenges of the next future millimeter astronomy. Therefore, the joint modeling of molecular and dust emissions is essential to investigate the global relationships between gas, dust and star formation.
We have developed a method that combines GRASIL and a molecular lines emission model, based on LVG approximation (Vega et al. in preparation). Our LVG code (see de Jong et al. de Jong et al. (1975) for the mathematical formulation) takes into account collisional excitation by H2 molecules, radiative trapping and radiative excitation by the cosmic microwave background. The adjustable LVG parameters are: the numerical density of colliders, , the gas kinetic temperature, , and the parameter in pc km-1, where is the relative abundance of a given molecule to H2. Our LVG code at present treats 12CO, 13CO, C18O, CS, HCN, HNC and HCO+.
The main advantage of combining the LVG code with GRASIL for the analysis of molecular emission in galaxies is that, by fitting the galaxy SED from the far UV to the radio bands, GRASIL can provide realistic estimates of the SFR, fraction of molecular gas, gas to dust ratio, dust temperature, and the average molecular cloud structure.
The shape of the predicted IR SED depends mainly on the optical depth of the clouds, . After is set from the fit to the continuum, we obtain the molecular gas density corresponding to different (within reasonable values), assuming that most of the molecular emission comes from the same clouds with ongoing star formation. We apply our LVG model to the clouds for each value of (or ), adjusting and to fit the observed intensity of the molecular lines lines. The best fit model gives the best estimate of the excitation conditions of molecular gas.
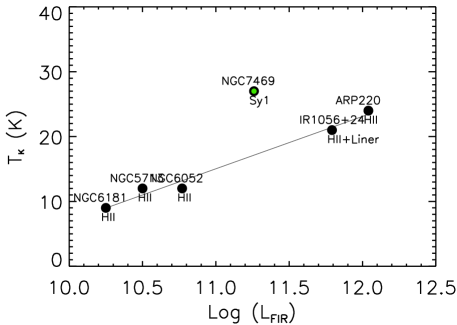
As an example, we show some results of applying our GRASIL+LVG model to six galaxies, four LIRGs and two ULIRGs, for which both continuum and molecular line data are available. From our preliminary analysis, there are hints that is tightly correlated to the FIR (and Radio) emission over a wide range of luminosity (Figure 2). The only galaxy out of this correlations is a Sy1.2. A likely explanation is that, in starburst galaxies, the molecular excitation is driven by processes related to star formation. In the case of the AGN, the molecular gas seems to be “overheated”, probably by the central engine. The mean molecular densities found for these galaxies are cm-3 and the bulk of CO emission is coming from a low density medium. However, observations of HCN suggest the presence of a much denser medium, thus we are working in a two-zone model: dense clouds embedded in a low density medium.
5 X-ray emission from galaxies
The X-ray range has recently become very effective to study galaxy evolution, thanks to the high resolution, low flux levels and large spectral range reached by Chandra and XMM-Newton, that allow to probe the faint X-ray sources of star forming galaxies. In several works a strong correlation between the X-ray and the FIR or radio luminosity has been reported for star forming galaxies (e.g. Griffiths and Padovani (1990); David et al. (1992); Helfand and Moran (2001); Ranalli et al. (2003)). Grimm et al. Grimm et al. (2003), by comparing the luminosity functions of X-ray point sources (XLF) of several galaxies, conclude that the shape of the XLF being almost universal. Therefore, the X-ray emission can be considered another independent indicator of star formation rate and history, to exploit together with the radio, IR and UV indicators, in order to set new constraints for a multi-wavelength tackling of galaxy evolution studies. To complete our self consistent modeling of the SED of galaxies, we have extended GRASIL to the X-ray range (Silva et al. (2003) and Silva et al. in preparation).
We consider the following sources (see Van Bever and Vanbeveren (2000); Persic and Rephaeli (2002)): (1) Binaries in which the donor is a core H-burning OB star that fills its Roche lobe, and the primary is a black hole (BH) or a Neutron Star (NS) (hereafter RBH and RNS); (2) Binaries in which the donor is a shell H-burning OB star undergoing a phase of strong stellar wind, and the primary is a BH or a NS (hereafter WBH and WNS); (3) Pulsars (PLS); (4) Supernova remnants (SNRs); (5) low-mass X-rays binaries (LMXRBs).
The X-ray luminosity from the different components is directly included in the library of Simple Stellar Population. We proceed in the following way: (i) at each age of a stellar population we know the number of stars in the different evolutionary phases or dead remnants, therefore we compute how many stars of main sequence or post main sequence combine to form binary systems with BH or NS as a primary; (ii) then each source is assigned the appropriate , therefore we obtain the total of a population of objects of each kind; (iii) we distribute this energy according to suitable (observed average) spectral shapes.
The inputs needed for the computation are the following (see de Donder and Vanbeveren (1998); Van Bever and Vanbeveren (2000)): the IMF for single and primary stars, the distribution of the initial mass ratio , the binary frequency at birth (), the distribution over the periods. Of course the results depend also on assumptions on stellar evolution (mainly mass loss rate, remnant masses, initial masses for BH formation, dependence on metallicity). As for LMXRB, they are linked to the old stellar populations, i.e. to the mass content of galaxies Grimm et al. (2003). We adopt the ratio evaluated for LMXRBs in our Galaxy by Grimm et al. ( erg/s/M⊙) and assume this ratio is the same in all galaxies.
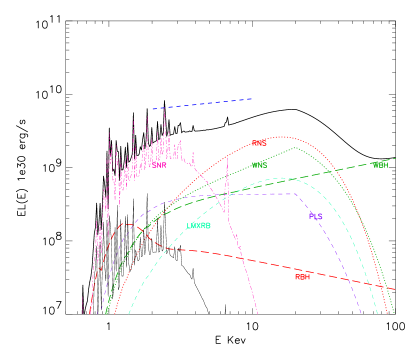
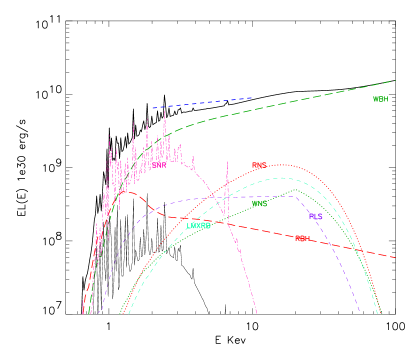
Once we have the SED of the populations of different X-ray sources as a function of age and metallicity, the integrated X-ray SED for a model galaxy of age is given by:
| (3) |
where and are the star formation rate and metallicity enrichment history for the model, refers to the different X-ray sources, and is the spectral shape associated to source of kind . In Fig. 3 we show the X-ray SED resulting from our model for M82. The star formation and metallicity evolution for M82 are obtained by fitting its UV to radio SED Silva et al. (1998); Bressan et al. (2002). The plots show the important effect on assumptions on stellar evolution and metallicity. Work is in progress to explore these effects, also connected with the presence of the so called Ultra-Luminous X-ray sources (ULX) in star forming galaxies (e.g. Gilfanov (2004)). These sources are interpreted as intermediate mass BHs ( M⊙) or to specific effects of the accretion onto normal BHs Begelman (2002); Rappaport et al. (2004) with a violation of the strict Eddington limit.
6 nebular emission lines
Emission lines from H ii regions are a powerful diagnostic of the instantaneous SFR because the luminosity of H recombination lines is proportional to the number of massive, short-living stars. Moreover, emission lines are widely used to estimate the dust attenuation, e.g. with the Balmer Decrement. Nebular lines are also used to estimate the metallicity of the gas and, finally, to infer the nature and age of the ionizing source. For all the above reasons, we implemented the computation of nebular lines in GRASIL (see Panuzzo et al. Panuzzo et al. (2003) for details).
To compute the line emission intensities in a population synthesis model, one should consider the spectrum of the ionizing source, provided by the recent star formation history, and use a photoionization code with suitable values of the gas parameters. It becomes particularly time consuming in applications requiring a large number of models. Our approach has been to pick out the physical parameters which actually affect the emission properties of H ii regions.
The emission spectrum from a single H ii region depends on two main ingredients: the SED of the ionizing star cluster (determined by the IMF and the total mass, age and metallicity of the cluster, as well as by the adopted model atmospheres) and the properties of the excited gas (the density, the chemical composition and the geometry).
We found that the emission line spectrum of an H ii region with fixed gas properties is described with reasonable precision by only three quantities: the number of ionizing photons per second for H i, He i and O ii (, , and ) emitted by the ionizing source. We used as ionizing SEDs analytical spectra composed by piece-wise blackbodies, similar to young SSP spectra, with temperatures given as functions of , , and . We shown that our analytical spectra produce the same emission line spectra of SSP with the same values of , , and , within a reasonable accuracy. Thus, we computed a library of photoionization models as a function of , , and . When estimating the actual line emission due to a given stellar population, the spectrophotometric code computes , , and from the corresponding SED, and then interpolates the value from the above library.
The library was computed for a grid of values of , , and , for different assumptions on the gas density, metallicity and filling factor . This method allows to get rid of the particular SSP model and IMF. Moreover it can be implemented in every population synthesis code. The library of photoionization models is available to the astronomical community from a web site222http://web.pd.astro.it/panuzzo/hii.
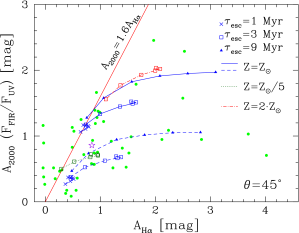
A simple application of our population synthesis with nebular emission and dust processing was to study different methods to estimate the attenuation in normal spirals Panuzzo et al. (2003). UV attenuation () can be estimated by ratio (see Meurer et al. (1999); Hirashita et al. (2003)) while the attenuation suffered by H () can be derived from the Balmer decrement. Observing a sample of normal spiral galaxies, Buat et al. Buat et al. (2002) found that and do not correlate, contrary to what found in starbursts galaxies Calzetti (1997); Buat et al. (2002).
Our models Panuzzo et al. (2003) (see Fig. 4) reproduce location of the observed galaxies and confirm a real lack of correlation between the from and . The dispersion is a clear effect of the age selective extinction. In fact massive ionizing stars have a short lifetime so they can spend all their life inside dusty environments (i.e. MCs) while UV emitting stars that have a longer lifetime can radiate from a less dusty medium.
7 PAH modeling
The mid infrared (MIR) spectra of many dusty galactic and extragalactic objects show strong emission features most commonly ascribed to aromatic C-C and C-H vibrations in large planar Polycyclic Aromatic Hydrocarbons (PAH) molecules (e.g. Leger and Puget (1984)).
Through a comprehensive analysis of the MIR to FIR spectra of Galactic star forming regions, normal and starburst galaxies and AGN, Peeters et al. Peeters et al. (2004) have shown that the SED of galaxies is very similar to that of Galactic exposed PDRs, and that PAHs are a better tracer of B stars rather than by massive star formation (O stars). This has been found also by Tacconi-Garman et al. Tacconi-Garman et al. (2004) by direct high resolution m imaging of two nearby starbursts (NGC253 and NGC1808): they find no spacial coincidence between the detailed distribution of PAH emission and the locations of most recent star formation.
On the theoretical side, the new observations have allowed to better define the modeling of PAHs (e.g. Li and Draine (2001); Zubko et al. (2004)). In order to interpret at best the spectra of galaxies, a detailed modeling that includes the complex interaction between stars and dust is needed. To this aim we have updated GRASIL by including a better treatment of PAH emission bands. The previous version of GRASIL Silva et al. (1998); Silva (1999) included PAH modeling based on pre-ISO data: the five to m PAH bands were computed following mainly Xu & De Zotti Xu and de Zotti (1989). We have now updated our treatment according to the PAH model by Li & Draine Li and Draine (2001) (LD01). In particular: (i) ISO observations have increased the number of known bands, therefore now in addition to the , , , , m bands, we compute the , , , , , and m bands; (ii) we adopt a Drude profiles for the features; (iii) the FWHM and emission cross section for the new bands are from LD01. We have compared our updated PAH model with ISO spectra of galaxies by Lu et al. Lu et al. (2003) in order to test weather the LD01 model, suited for the diffuse ISM, can be safely adopted in general for star forming galaxies. We searched continuum NIR to radio data for the galaxies of the Lu et al. sample, and fitted the continuum SED. We then made a detailed comparison of the corresponding model PAH with the Lu et al. MIR spectra. In all cases the predicted PAHs compare very well with the observation, the greatest disagreements are always within a factor of 1.5, but typically much less.
8 conclusions
GRASIL is a realistic model for simulating detailed and panchromatic SEDs of galaxies. We are constantly working to improve GRASIL modeling in particular about PAH, X-rays, molecular line emission, and dust geometry. The model was successfully used in many works and in several different fields, also by researchers outside the developing team. GRASIL is available for the scientific community: everybody is welcome to download the code from our web site or to ask for the source. We are now working on a web interface: any researcher will be able to run GRASIL on our computers, and to get the result by e-mail.
References
- Silva et al. (1998) Silva, L., Granato, G. L., Bressan, A., and Danese, L., ApJ, 509, 103 (1998).
- Granato et al. (2000) Granato, G. L., Lacey, C. G., Silva, L., Bressan, A., Baugh, C. M., Cole, S., and Frenk, C. S., ApJ, 542, 710 (2000).
- Bressan et al. (2002) Bressan, A., Silva, L., and Granato, G. L., A&A, 392, 377 (2002).
- Panuzzo et al. (2003) Panuzzo, P., Bressan, A., Granato, G. L., Silva, L., and Danese, L., A&A, 409, 99 (2003).
- Granato et al. (2001) Granato, G. L., Silva, L., Monaco, P., Panuzzo, P., Salucci, P., Zotti, G. D., and Danese, L., MNRAS, 324, 757 (2001).
- Granato et al. (2004) Granato, G. L., De Zotti, G., Silva, L., Bressan, A., and Danese, L., ApJ, 600, 580 (2004).
- Baugh et al. (2004) Baugh, C. M., Lacey, C. G., Frenk, C. S., Granato, G. L., Silva, L., Bressan, A., Benson, A. J., and Cole, S., MNRAS (2004), in press (astro-ph/0406069).
- Silva (1999) Silva, L., Modelling the SED Evolution of Dusty Galaxies and Applications, Ph.D. thesis, SISSA (1999).
- Bressan et al. (1998) Bressan, A., Granato, G. L., and Silva, L., A&A, 332, 135 (1998).
- Sanders and Mirabel (1996) Sanders, D. B., and Mirabel, J. F., ARA&A, 34, 749 (1996).
- Condon and Yin (1990) Condon, J. J., and Yin, Q. F., ApJ, 357, 97 (1990).
- Garrett (2002) Garrett, M. A., A&A, 384, L19 (2002).
- Carilli and Yun (2000) Carilli, C. L., and Yun, M. S., ApJ, 530, 618 (2000).
- Prouton et al. (2004) Prouton, O. R., Bressan, A., Clemens, M., Franceschini, A., Granato, G. L., and Silva, L., A&A, 421, 115 (2004).
- de Jong et al. (1975) de Jong, T., Dalgarno, A., and Chu, S., ApJ, 199, 69 (1975).
- Griffiths and Padovani (1990) Griffiths, R. E., and Padovani, P., ApJ, 360, 483 (1990).
- David et al. (1992) David, L. P., Jones, C., and Forman, W., ApJ, 388, 82 (1992).
- Helfand and Moran (2001) Helfand, D. J., and Moran, E. C., ApJ, 554, 27 (2001).
- Ranalli et al. (2003) Ranalli, P., Comastri, A., and Setti, G., A&A, 399, 39 (2003).
- Grimm et al. (2003) Grimm, H., Gilfanov, M., and Sunyaev, R., MNRAS, 339, 793 (2003).
- Silva et al. (2003) Silva, L., Granato, G. L., Bressan, A., and Panuzzo, P., “Modelling the Radio to X-ray SED of Galaxies,” in Galaxy Evolution: Theory & Observations, edited by V. Avila-Reese, C. Firmani, C. S. Frenk, and C. Allen, Revista Mexicana de Astronomía y Astrofísica, 2003, vol. 17, p. 93.
- Van Bever and Vanbeveren (2000) Van Bever, J., and Vanbeveren, D., A&A, 358, 462 (2000).
- Persic and Rephaeli (2002) Persic, M., and Rephaeli, Y., A&A, 382, 843 (2002).
- de Donder and Vanbeveren (1998) de Donder, E., and Vanbeveren, D., A&A, 333, 557 (1998).
- Griffiths et al. (2000) Griffiths, R. E., Ptak, A., Feigelson, E. D., Garmire, G., Townsley, L., Brandt, W. N., Sambruna, R., and Bregman, J. N., Science, 290, 1325 (2000).
- Gilfanov (2004) Gilfanov, M., MNRAS, 349, 146 (2004).
- Begelman (2002) Begelman, M. C., ApJ, 568, L97 (2002).
- Rappaport et al. (2004) Rappaport, S. A., Podsiadlowski, P., and Pfahl, E., MNRAS (2004), in press (astro-ph/0408032).
- Buat et al. (2002) Buat, V., Boselli, A., Gavazzi, G., and Bonfanti, C., A&A, 383, 801 (2002).
- Meurer et al. (1999) Meurer, G. R., Heckman, T. M., and Calzetti, D., ApJ, 521, 64 (1999).
- Hirashita et al. (2003) Hirashita, H., Buat, V., and Inoue, A. K., A&A, 410, 83 (2003).
- Calzetti (1997) Calzetti, D., AJ, 113, 162 (1997).
- Leger and Puget (1984) Leger, A., and Puget, J. L., A&A, 137, L5 (1984).
- Peeters et al. (2004) Peeters, E., Spoon, H. W. W., and Tielens, A. G. G. M., ApJ, 613, 986 (2004).
- Tacconi-Garman et al. (2004) Tacconi-Garman, L. E., Sturm, E., Lehnert, M., Lutz, D., Davies, R. I., and Moorwood, A. F. M., A&A (2004), accepted (astro-ph/0411272).
- Li and Draine (2001) Li, A., and Draine, B. T., ApJ, 554, 778 (2001).
- Zubko et al. (2004) Zubko, V., Dwek, E., and Arendt, R. G., ApJS, 152, 211 (2004).
- Xu and de Zotti (1989) Xu, C., and de Zotti, G., A&A, 225, 12 (1989).
- Lu et al. (2003) Lu, N., Helou, G., Werner, M. W., Dinerstein, H. L., Dale, D. A., Silbermann, N. A., Malhotra, S., Beichman, C. A., and Jarrett, T. H., ApJ, 588, 199 (2003).