Constraints on Velocity Dispersion Function of Early-type Galaxies from the Statistics of Strong Gravitational Lensing
Abstract
We use the distribution of gravitationally-lensed image separations observed in the Cosmic Lens All-Sky Survey (CLASS) and the PMN-NVSS Extragalactic Lens Survey (PANELS), which are (nearly) complete for the image separation range , to constrain a model velocity dispersion function (VF) of early-type galaxies. Assuming a current concordance cosmological model and adopting a singular isothermal ellipsoid (SIE) model for galactic potentials, we consider constraining both a characteristic velocity dispersion (parameter ) and the shape of the function (parameters and ; Sheth et al. 2003) for . If all three parameters are allowed to vary, then none of the parameters can be tightly constrained by the lensing data because of the small size of the sample. If we fix the shape of the function by either the SDSS local stellar VF or an inferred local stellar VF based on the SSRS2 galaxy sample, then the constrained values of are nearly equal to the corresponding stellar values; we have or assuming non-evolution of the function between the present epoch and . Finally, using only the CLASS statistical sample (Browne et al. 2003) and thus including an absolute multiple-imaging probability, we find that the SDSS stellar VF may have significantly underestimated the abundance of morphologically early-type galaxies.
1 Introduction
One of the fundamental parameters for an early-type galaxy is the (1-dimensional) velocity dispersion, i.e. the standard deviation of the line-of-sight velocities of objects. In general, the velocity dispersion is anisotropic and varies as a function of projected radius from the galactic center although it is expected to be constant for certain isothermal galaxy models. Hence, for a given galaxy there arise different velocity dispersions depending on the probed scales. For example, the velocity dispersion determined from the spectroscopic observation of a galaxy within a given aperture refers to the stellar kinematics in an inner region (usually, the central few kpc region) of the galaxy, while the velocity dispersion inferred from the extended X-ray emitting gas temperatures refers to the kinematics of (the galaxy’s mass dominating) halo.
The distributions of (suitably chosen) velocity dispersions among all early-type galaxies at a given cosmic epoch, or the velocity dispersion functions (VFs) of early-type galaxies, are crucial observables that can provide powerful constraints on models of galaxy formation and evolution (see, e.g., Kochanek 2001; Sheth et al. 2003). Specifically, VFs for different scales (e.g., the central region, the effective radius region, the extended halo region) can be compared with one another as well as predictions of models of galaxy formation and evolution. Conventionally, central stellar VFs of early-type galaxies have been inferred from early-type luminosity functions via an adopted power-law relation between luminosity and velocity dispersion (i.e. the ‘Faber-Jackson’ relation) (e.g., Shimasaku 1993; Gonzalez et al. 2000; Chae 2003).
Recently, Sheth et al. (2003) have pointed out that the spread in a Faber-Jackson relation results in a systematic bias for the inferred central stellar VF. Sheth et al. (2003) have then directly derived a central stellar VF based on Sloan Digital Sky Survey (SDSS) spectroscopic data of early-type galaxies (Bernardi et al. 2003). Mitchell et al. (2005) have updated (the normalization of) the SDSS VF using a larger galaxy sample. Bernardi et al. (2003) and Mitchell et al. (2005) have applied both surface brightness profile and spectroscopic criteria to SDSS galaxies to classify them; in particular, a galaxy was assigned early-type only when it satisfied all the applied criteria. As discussed in Chae (2003), accurately classifying large numbers galaxies is the major difficulty in deriving reliable type-specific luminosity functions; the same is true for deriving reliable velocity dispersion functions. The conventional method of classifying galaxies by the visual inspection of their morphological appearances is probably the most reliable method (see, e.g., Marzke et al. 1998; Chae 2003; Madgwick 2003) but unfortunately cannot be applied to very large samples of galaxies such as the SDSS sample. In this respect, the SDSS VF should be taken with some caution until it is verified that the galaxy classification process (Bernardi et al. 2003; Mitchell et al. 2005) does not suffer from any significant systematic bias.111It is interesting to note that Bernardi et al. (2003) assign 14% of their galaxies early-type while Marzke et al. (1998), who classified by morphological appearances, assign 30% early-type and Madgwick et al. (2002), who classified 2dFGRS galaxies by spectroscopic criteria, assign 40% early-type.
In this work, we consider constraining a model VF of early-type galaxies using the statistics of strong gravitational lensing. We use mainly the distribution of image separations to constrain the shape of the VF and the characteristic velocity dispersion . For this purpose we need a sample of lensed systems that are complete for image separations (but may not be complete otherwise; see §2). The best such sample is provided by the lensed systems that have been discovered in the Cosmic Lens All-Sky Survey (CLASS; Myers et al. 2003; Browne et al. 2003) of radio-loud sources and the PMN-NVSS Extragalactic Lens Survey (PANELS; Winn et al. 2001b), which is a southern sky survey somewhat similar to the CLASS. These surveys have discovered a total of 26 lensed systems which form a (nearly) complete sample for the image separation range . We also consider constraining the normalization of the VF (which is proportional to the abundance of early-type galaxies). We cannot use the whole sample of lensed radio sources mentioned above for this purpose. This is because not all of them pertain to a radio source sample that can satisfy well-defined observational selection criteria and thus provide an absolute probability of multiple-imaging. The largest sample of radio sources satisfying well-defined observational selection criteria is the CLASS statistical sample of 8958 sources containing 13 multiply-imaged sources (Browne et al. 2003; Chae 2003). We use this sample to constrain the normalization of the VF.
Since the time it was pointed out (e.g., Fukugita, Futamase, & Kasai 1990; Turner 1990) that lensing rate increases rapidly with increasing , strong lensing statistics have been most often used to constrain cosmological parameters under the assumption that adopted VFs were correct (e.g. Kochanek 1996; Helbig et al. 1999; Chae et al. 2002, 2004). In this work, we use lensing statistics, specifically image separation statistics, for a different purpose; namely, we constrain a model VF under the assumption that the adopted cosmological model is correct. Here it is worth making two points. First, a sufficiently large sample of lenses can constrain simultaneously both cosmological parameters and a VF but the current lens sample is not so large that we are forced to make some assumptions. Second, given the widespread convergence of cosmological measurements toward the current concordance cosmological model (e.g., Riess et al. 1998; Perlmutter et al. 1999; Spergel et al. 2003), namely the spatially-flat universe, it is at least as interesting to use lensing statistics for deriving information on galaxies as for constraining cosmological parameters.
Constraining a VF through image separation distributions of gravitationally-lensed systems is unique and worthwhile in the following respects. First, the image separation of a gravitationally-lensed system is dependent on both luminous mass and dark mass within the Einstein radius of the lensing galaxy, which is of order of its effective radius. Consequently, the image separation probes the scale that is intermediate compared with the scales probed by aperture-limited spectroscopic observations and X-ray observations and encodes the information on the dynamics of both luminous mass and dark mass in the galaxy. Second, the angular sizes of image splitting in lensed systems can be measured accurately, particularly through radio observations as it is the case for the CLASS and the PANELS lenses. However, some care should be taken in turning an observed image separation distribution into a VF for the following reasons. First, an image-splitting size can be translated into a velocity dispersion only through a galaxy model (see §3 for further). For example, a single-component isothermal galaxy model can be adopted and then the inferred velocity dispersion would be some sort of effective quantity for luminous and dark mass components.222In the literature including the author’s own, the velocity dispersion derived from an image separation has often been mistakenly referred to as the “dark matter velocity dispersion” (see §3 for further). Second, about a quarter of the multiply-imaged systems involve multiple galaxies within their Einstein radii, so that the image separations in those systems do not correspond to the properties of single galaxies.
The lensing galaxies we use in this work lie within the redshift range of . This means that we are effectively constraining a VF at . This also means that we can constrain some aspects of galaxy evolution using the lens sample.333Such an analysis has been done in Chae & Mao (2003) using an inferred local stellar VF. See, also, Ofek, Rix, & Maoz (2003). However, the focus of this work is somewhat different; we obtain a solely lensing-based VF for and then compare it with (nearly) local stellar VFs assuming only a passive evolution of early-type galaxies between the two epochs.
Below in §2 we briefly describe the CLASS data and the methodology. In §3 we present the constraints on a model velocity dispersion function of early-type galaxies and discuss their implications.
2 Data and Method
The CLASS444Throughout this paper CLASS is meant to include its predecessor survey, the Jodrell Bank-VLA Astrometric Survey (King et al. 1999). has observed a total of 16,503 targeted flat-spectrum radio sources resulting in the discovery of 22 cases of multiple-imaging with image separation (Myers et al. 2003; Browne et al. 2003). The total sample may not be suitable for multiple-imaging rate statistics because not all sources satisfy a set of source selection criteria.555Only a subsample of 8958 sources containing 13 multiply-imaged sources satisfy well-defined observational selection criteria and is referred to the CLASS statistical sample. This sample has been extensively analyzed for the purpose of deriving information on cosmological parameters and galaxy properties (e.g., Chae 2003; Chae et al. 2002, 2004; Chae & Mao 2003). For example, a fraction of the sample does not strictly satisfy the flat-spectrum criterion, so that their parent population may be different from that of flat-spectrum sources. This means that the magnification bias and redshift distribution estimated for flat-spectrum sources could not be applied to the non-flat-spectrum sources. However, as long as only image separation statistics is concerned, source population properties do not matter because image separations are determined by the properties of the lensing galaxies. In other words, whatever the source may be, for the same lensing geometry, lensing galaxy, and cosmology the image separation must be the same. The only requirement of the sample for image separation statistics is that the lens discovery process does not involve any particular bias against certain image separation range. The entire CLASS sample satisfies this requirement for . The PANELS radio survey of partial southern sky () using the same methodology of the CLASS has observed 4097 flat-spectrum sources and discovered 4 multiple-imaging cases to date (Winn et al. 2000, 2001a, 2002a,b). The lens search process for this survey has not yet been completed and so the lens sample is not quite complete. However, since the lens search process is not biased against any particular image separation range, we could add the PANELS sample to the CLASS sample for our image separation statistics.
The properties of the 22 multiply-imaged CLASS systems are summarized in Browne et al. (2003). The properties of the 4 PANELS multiply-imaged systems can be found Winn et al. (2000, 2001a, 2002a,b). In Table 1 we summarize the essential properties of the 26 multiply-imaged systems. Not all of these systems can be used for our analysis. First, we exclude the systems whose lensing galaxies are spiral galaxies (Group C). Second, we exclude the systems that contain multiple galaxies within their critical curves, since the observed image separations for the systems do not correspond to the properties of single galaxies (Group D). Notice particularly that the secondary (and tertiary) galaxies in these systems are comparable in mass to the corresponding primary galaxies; see §3.1 of Chae (2003) for details. This means that both the convergences and shears of the secondary (and tertiary) galaxies are significant for the the systems of Group D.666In other words, the secondary (and tertiary) galaxies cannot simply be regarded as perturbation terms to the main lensing potentials. Notice also that Group D does not include lens systems that contain proximate galaxies outside the critical curves (e.g. 0414+054, 1030+074, 1152+199), since those nearby galaxies can normally be accounted for by external shears and are not likely to contribute significantly to the observed image separations (see below however). Third, we exclude any systems whose lensing scenario details are so uncertain that we cannot reliably interpret their image separations (Group E). Group E includes only 2045+265, whose image separation, current estimate of lensing galaxy redshift, and spectroscopic information on lensing galaxy type are not consistent with current knowledge of galaxies (see Fassnacht et al. 1999). For the multiply-imaged systems of Group B, lensing galaxy types are unknown or uncertain. We do not exclude these systems but include them with a penalization (see below).
However, the above prescription of excluding certain systems while keeping others is not a perfect solution. For example, proximate galaxies and/or nearby groups of galaxies outside the critical curves of single-lens systems can have non-negligible effects. Indeed, current studies find that proximate (satellite) galaxies (Cohn & Kochanek 2004) and environmental groups (Keeton & Zabludoff 2004) of the primary lensing galaxies can have various effects on the inferences on galaxies from gravitational lenses.777The most significant effects of the lens galaxy environments appear to be biasing galaxy ellipticities and image multiplicities. However, the environmental effects on inferred velocity dispersions appear to be relatively small (certainly smaller than statistical errors arising from the current sample size of lenses). Another concern may be that the primary galaxies of the systems of Group D may be a biased sample of early-type galaxies (for example, preferentially more massive galaxies than average galaxies). Thus, excluding the systems of Group D could bias the image separation distribution of early-type ‘single’ lenses. Cohn & Kochanek (2004) argue that dropping compound lenses (i.e. lens systems with satellite galaxies) can be more biasing the image separation distribution than simply including them as if they were single-galaxy lenses. Notice, however, that Cohn & Kochanek (2004) define a compound lens to be a system that contains galaxy(-ies) within 2 arcseconds of the primary galaxy. As a result, more than half of the Cohn & Kochanek (2004) compound lenses do not pertain to our Group D. Therefore, the argument of Cohn & Kochanek (2004) does not directly apply to our analysis. Furthermore, as pointed out in §3.1 of Chae (2003), the critical radii of the primary galaxies of multiple-galaxy lenses (i.e. systems that contain multiple galaxies within their critical radii) are on average similar to those of the single-lens galaxies, perhaps implying that the primary galaxies of the multiple-lens systems may be a random sample of early-type galaxies. Nevertheless, we must bear in mind that our analysis to follow potentially suffers from the above systematic biases; taking them fully into account is beyond the scope of this work.
| Source | Lens | Maximum | Number | Lensing | |||
| Group | Source | Survey | redshift | redshift | image | of | galaxy(-ies) |
| () | () | separation (′′) | images | type | |||
| A | B0414+054 | JVAS | 2.62 | 0.958 | 2.09 | 4 | early-type |
| A | B0445+123† | CLASS | — | 0.558 | 1.33 | 2 | early-type |
| A | B0631+519† | CLASS | — | 0.620 | 1.16 | 2 | early-type |
| A | B0712+472† | CLASS | 1.34 | 0.41 | 1.27 | 4 | early-type |
| A | B1030+074 | JVAS | 1.535 | 0.599 | 1.56 | 2 | early-type |
| A | B1422+231† | JVAS | 3.62 | 0.34 | 1.28 | 4 | early-type |
| A | J16320033 | PANELS | 3.42 | 1∗ | 1.47 | 2 | early-type |
| A | J18383427 | PANELS | 2.78 | 0.36∗ | 1.0 | 2 | early-type |
| A | B1933+503† | CLASS | 2.62 | 0.755 | 1.17 | 4 | early-type |
| A | B1938+666 | JVAS | 0.881 | 0.93 | ring | early-type | |
| A | B2319+051† | CLASS | — | 0.624/0.588 | 1.36 | 2 | early-type |
| B | B0128+437 | CLASS | 3.124 | 1.145∗ | 0.54 | 4 | unknown |
| B | B0739+366 | CLASS | — | — | 0.54 | 2 | unknown |
| B | B1152+199† | CLASS | 1.019 | 0.439 | 1.56 | 2 | unknown |
| B | B1555+375 | CLASS | — | — | 0.42 | 4 | unknown |
| C | B0218+357† | JVAS | 0.96 | 0.68 | 0.334 | 2 | spiral |
| C | B0850+054† | CLASS | — | 0.588 | 0.68 | 2 | spiral |
| C | B1127+385 | CLASS | — | — | 0.70 | 2 | spiral |
| C | B1600+434 | CLASS | 1.57 | 0.415 | 1.39 | 2 | spiral |
| C | J20041349 | PANELS | — | — | 1.13 | 2 | spiral |
| D | J01340931 | PANELS | 2.225 | 0.7645 | 0.681 | 2+4 | 2Gs |
| D | B1359+154† | CLASS | 3.235 | — | 1.65 | 6 | 3Gs |
| D | B1608+656† | CLASS | 1.39 | 0.64 | 2.08 | 4 | 2Gs |
| D | B2108+213 | CLASS | — | 0.365 | 4.55 | 2 or 3 | 2Gs+cluster |
| D | B2114+022† | JVAS | — | 0.32/0.59 | 2.57 | 2∗ | 2Gs |
| E | B2045+265† | CLASS | — | 0.867 | 1.86 | 4 | puzzling |
† Systems in the CLASS statistical sample (Chae 2003)
∗ An estimated or assumed value
We use the model of statistical lensing described in Chae (2003). We assume a spatially flat universe with an Einstein cosmological constant and adopt for the present matter density (Spergel et al. 2003), i.e. a concordance cosmological model favored by a broad range of astronomical observations (see, e.g., Chae et al. 2004 and references therein). We assume that the distribution of early-type galaxies in luminosity is given by the Schechter (1976) form
| (1) |
Assuming a power-law relation between luminosity () and velocity dispersion (), i.e.
| (2) |
we can describe the distribution of early-type galaxies in velocity dispersion in the following form888This particular parameterization was introduced by Sheth et al. (2003).
| (3) |
where we have the following relations: , , and .
The particular differential probability that a source with redshift be multiply-imaged with image separation by a distribution of galaxies at redshift following equation (3) may be defined by
| (4) | |||||
where the differential probabilities and can be found in §2.1.2 of Chae (2003) and the characteristic image separation is given by
| (5) |
where the lens potential is assumed to be that of a singular isothermal ellipsoid (SIE), is a dynamical normalization factor [see §2.1.1 of Chae (2003)], and is the angular-diameter distance between redshifts and . For we assume that early-type galaxies are not biased toward oblate or prolate shape using the singular isothermal ellipsoid model of Chae (2003); thus, [see Fig. 1 of Chae (2003)].
For a sample of multiply-imaged sources, the likelihood of the observed image separations given the statistical lensing model is defined by
| (6) |
where is the particular differential probability given by equation (4) for the -th multiply-imaged source and , a weight factor, is set to unity for early-type lens systems (Group A of Table 1) and 0.8999Among the single-galaxy lenses with known galaxy types (Group A & C) the fraction of early-type galaxies is 0.7, which is similar to the assumed value here. for systems whose lensing galaxy types are unknown (Group B of Table 1). Using equation (6), we define a “” as follows:
| (7) |
We minimize the (eq. 7) to determine the maximum-likelihood values of model parameters of interest and obtain their confidence limits using the usual statistics.
3 Results and Discussion
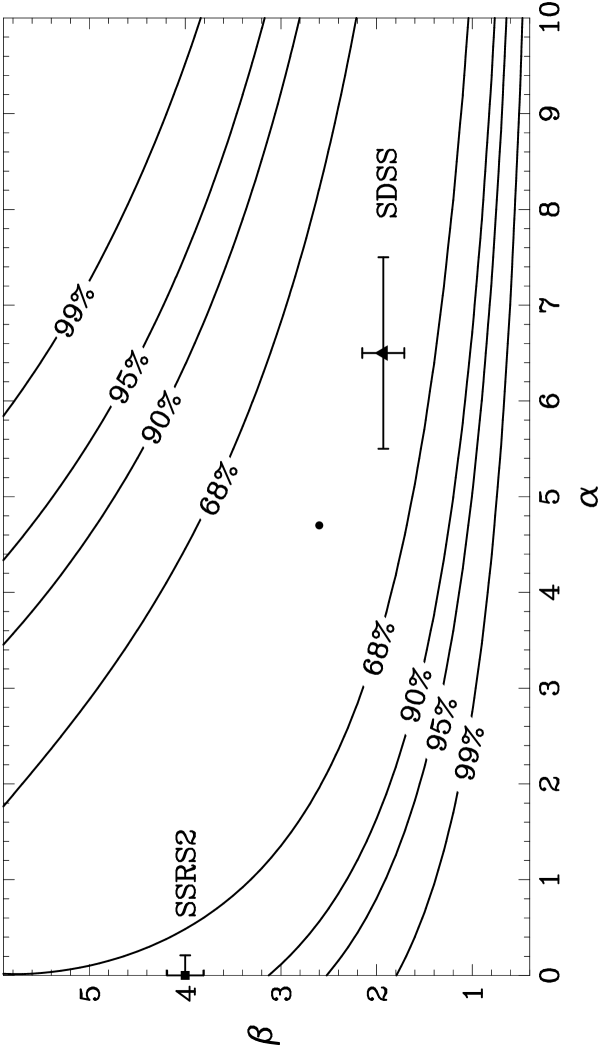
We first consider constraining the shape of velocity dispersion function (VF; eq. 3) and the characteristic velocity dispersion . The adopted VF has then three effective parameters, i.e. , , and .101010Parameter has no relevance on the shape of the image separation distribution; it only plays the role of a multiplicative constant. This allows us to fix by an arbitrary constant here. Because the lensing galaxies are distributed within , these parameters to be constrained may refer to an effective epoch of . Figure 1 shows confidence limits (CLs) on the parameter plane spanned by and . To obtain these CLs, parameter has been varied to minimize the (eq. 7) at each grid point on the - plane. Figure 1 also shows the points corresponding to the recently measured SDSS local stellar VF (Sheth et al. 2003) and an inferred local stellar VF (Chae 2003) based on the Second Southern Sky Redshift Survey (SSRS2) early-type luminosity function and a Faber-Jackson relation of the form . Notice that these two stellar VFs are significantly different from each other in their corresponding parameter values. From Figure 1 we find that (1) broad regions in the - plane are consistent with the present data and consequently, neither of the parameters can be tightly constrained; (2) both the SDSS measured stellar VF and the SSRS2 inferred stellar VF are consistent with the image separation distribution (lying nearly within the 68% CL). Nevertheless, it appears that the shape of the SDSS VF is marginally favored over that of the SSRS2 VF.
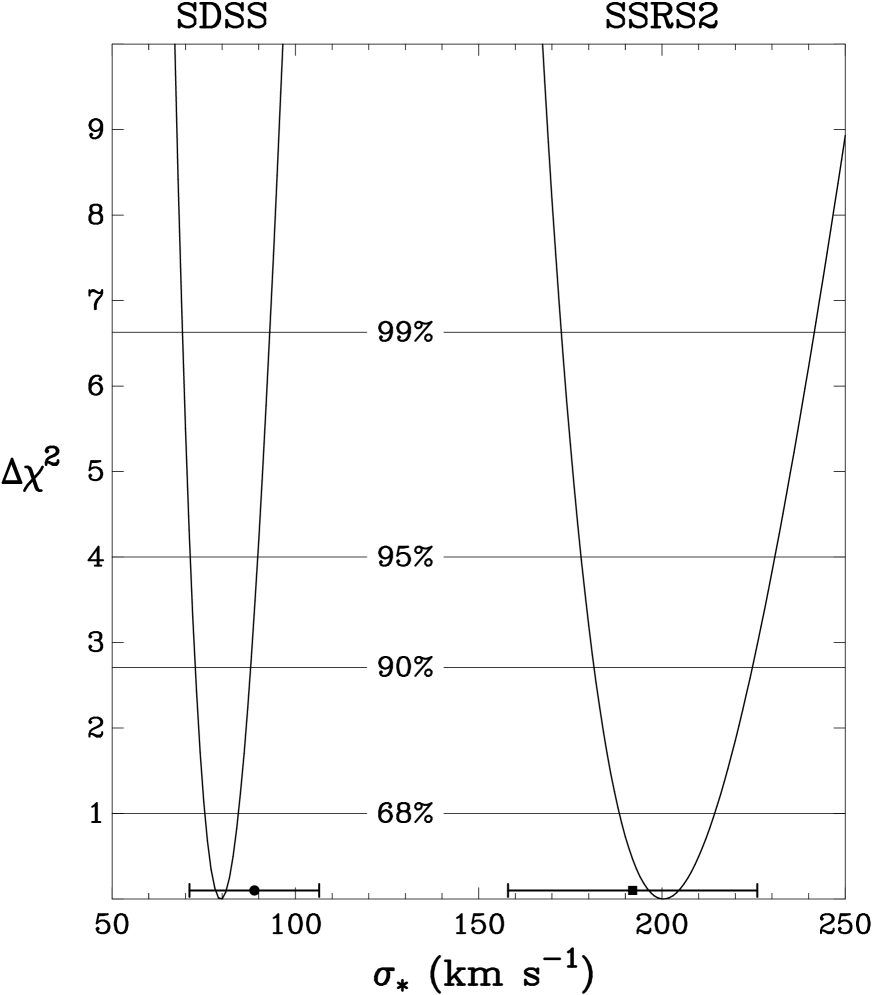
A by-product from Figure 1 is that parameter is essentially unconstrained by the data. This is because varies as and are varied. What would be the (constrained) value of if and are fixed by a stellar VF? Strictly speaking we need a stellar VF for the same epoch, i.e. . However, since a stellar VF at such a redshift is not available, we use local stellar VFs assuming non-evolution of the VF from to the present. Figure 2 shows CLs on for the cases of fixing and by the SDSS local central stellar VF and the SSRS2 local central stellar VF. In Figure 2 are also shown the local central stellar values of (Sheth et al. 2003; Chae 2003) for comparison. From Figure 2 we find that the lensing-based values of are nearly equal to the corresponding stellar values for the adopted stellar VFs. The ratio between the lensing-based SIE velocity dispersion and the spectroscopically-measured central stellar velocity dispersion is given by (SDSS) and (SSRS2). Treu & Koopmans (2004) have studied five individual lens systems through both modeling the lens potentials using an SIE and optical spectroscopic observation of the lensing galaxies. Treu & Koopmans (2004) have determined the ratio of the SIE velocity dispersion to the stellar velocity dispersion for the five lens systems and found a mean value of . The result by Treu & Koopmans (2004) cannot be directly compared with the result of this work above. For the former the SIE and central stellar velocity dispersions were determined for the same objects but the objects do not well represent the population of early-type galaxies while for the latter the SIE and central characteristic velocity dispersions were determined through fitting to a model function for two different statistical samples that are supposed to well represent early-type galaxy population. Nevertheless, our and Treu & Koopmans (2004) results are in agreement.
What would be the appropriate interpretation of this agreement between the lensing-based inferred velocity dispersion and the spectroscopically-measured central stellar velocity dispersion? To answer this question we must first examine the relevance of the observed image separation to the adopted lens model (§ 2; Chae 2003). For the model of Chae (2003) it is assumed that lensing is caused by a single-component model galaxy, i.e. a singular isothermal ellipsoid (SIE). However, the real early-type galaxy that causes lensing is of course not a single-component system; it can be divided into the luminous stellar component and the extended dark-matter halo component. What is measured by the angular-splitting size of the gravitationally-lensed image is the total mass within (the cylindrical region of) the Einstein radius of the lensing galaxy, which is of the order of the effective radius of the optical galaxy and (nearly) one half of the image separation. Results from detailed modeling of gravitationally-lensed systems (e.g. Rusin et al. 2004; Treu & Koopmans 2004) and analyses of X-ray data of early-type galaxies (e.g. Loewenstein & White 1999) show that both stellar mass and dark mass are significant contributors to the mass within the effective radius. The velocity dispersion distribution of a subsystem of the lensing galaxy depends on both the total gravitational potential of the galaxy and the mass profile of the subsystem. Therefore, the image separation probes a larger scale compared with the spectroscopic technique and depends on the velocity dispersions of both stars and dark matter. This means that the velocity dispersion of an SIE constrained by the image separation cannot be simply regarded as the velocity dispersion of dark-matter particles (or, of stars). The SIE velocity dispersion is just a theoretical parameter for the total mass of stars and dark matter. Then, what would be the implication of the agreement between the two? In particular, would this agreement imply that dark matter velocity dispersion is equal to stellar velocity dispersion? One simple possibility would be that the mass profile is approximately isothermal and dark matter and stellar velocity dispersions are equal. This interpretation would be in agreement with the result by Kochanek (1994) that the dark matter halo and the central stellar velocity dispersions are nearly equal based on modeling the line-of-sight velocity dispersion profiles of 37 elliptical galaxies using a Jaffe stellar density profile and the SIS model for the total mass distribution. However, this would be in conflict with other independent results. For example, combined analyses of X-ray data and spectroscopic data of elliptical galaxies (White & Davis 1998; Loewenstein & White 1999) find that dark-matter velocity dispersions are greater than stellar velocity dispersions (; Loewenstein & White 1999). Perhaps, this issue could be resolved in the future by incorporating a more realistic two-component galaxy model into the statistical lensing formalism.
Until now the characteristic normalization (i.e. in eq. [1] or in eq. [2]) has been fixed because we did not use an absolute lensing probability but used only a relative lensing probability as a function of image separation through equation (4). However, it is interesting to ask whether currently available characteristic normalizations of early-type galaxies are consistent with currently available absolute lensing probabilities. At present, the most reliable sample for an absolute lensing probability is provided by the CLASS statistical sample (see Table 1 and §3.1 of Chae 2003). For the present purpose we exclude the two spiral lenses (0218+357, 0850+054) and the system 2045+265 for which there exist spectroscopic indications of late-type galaxy(-ies) (Fassnacht et al. 1999). We assume that the remaining 10 systems (0445+123, 0631+519, 0712+472, 1152+199, 1359+154, 1422+231, 1608+656, 1933+503, 2114+022, 2319+051) are all early-type lenses. However, we ignore the image separations of the three systems 1359+154, 1608+656, and 2114+022 whose lenses are multiple galaxies; by this we mean that we do not use their image separations to constrain the velocity dispersion function. We then use the same likelihood analysis method as used in Chae (2003). Notice here particularly that the above multiple-galaxy lenses are included in lensing rate with the adjustment that is replaced by in the lensing probability for a multiple-galaxy lens system with galaxies.111111Since the multiple-imaging probability by a population of single galaxies is proportional to , the probability for lensing by galaxies may be assumed to be proportional to if ignoring the interference of the combined potentials. Since not all four parameters (i.e. , , , and 121212Here this parameter is used rather than because the latter diverges for which we want to consider.) can be constrained even when an absolute lensing probability is included, here we fix parameters and using the SSRS2 or SDSS stellar VFs and constrain the parameter plane spanned by and .
Figure 3 shows the confidence limits in the parameter plane spanned by and for the cases of fixing and using the SDSS or SSRS2 local stellar VFs. Here the values of and from the stellar VFs (Chae 2003; Mitchell et al. 2005) are also marked and compared with the likelihood regions. The interesting points are the following. First, the best-fitting point for the SDSS VF is slightly a better overall fit than that for the SSRS2 VF comparing the maximized values of the likelihood for the two cases (specifically, ). This is consistent with the results shown in Figure (1). Second, while the value of from the SSRS2 VF lies in the corresponding most likely region, that from the SDSS VF does not. Specifically, the SDSS measured is a factor of lower than the best-fitting value based on the CLASS absolute lensing probability. This suggests that the SDSS selection process of early-type galaxies (Bernardi et al. 2003; Mitchell et al. 2005) has significantly underestimated the abundance of morphologically early-type galaxies. Indeed, the SDSS selection process (Bernardi et al. 2003; Mitchell et al. 2005) excludes the galaxies that have centrally-concentrated light distributions but have spectra showing recent star-formation activities. However, as far as lensing is concerned, such a galaxy acts as an early-type because its centrally concentrated light distribution makes it have a relatively large multiple-imaging cross section. The lesson is that morphologically and dynamically early-type galaxies may show non-traditional colors and spectra. A re-classification of SDSS galaxies based on a new method that agrees relatively well with visual classifications shows that early-type galaxies are much more abundant than the Bernardi et al. (2003) and the Mitchell et al. (2005) estimates, probably in good agreement with the the absolute lensing probability of the CLASS statistical sample as analyzed in this work (C. Park, et al., private communications). Therefore, we argue that Mitchell et al. (2005) may have overestimated owing to their use of an underestimated .131313Notice that Mitchell et al. (2005) used for calculating magnification bias an index in the differential number-flux density relation which is steeper than the Chae et al. (2002) and Chae (2003) adopted value of . This helped lower their estimated value of ; otherwise they would have obtained an even larger .
In conclusion, based on the statistics of multiple-imaging in the largest uniformly-selected sample of gravitationally-lensed systems and adopting a SIE model for galaxies, we find that: (1) the lensing-based SIE velocity dispersion agrees with the central stellar velocity dispersion [ assuming the shape of SDSS (SSRS2) VF], (2) the shape of the SDSS stellar VF is in excellent agreement with the image separation distribution of multiply-imaged systems while that of the SSRS2 stellar VF is also consistent, and (3) the abundance of morphologically early-type galaxies implied by the CLASS absolute lensing probability under the current concordance cosmological model is in good agreement with that of the SSRS2 early-type galaxies but significantly higher than that of the SDSS early-type galaxies.
KHC acknowledges support from the ARCSEC of KOSEF. We thank S. Mao, M. Park, and R. Sheth for comments and/or discussions. We also thank the observers (of the CLASS sources) whose hard-work results have made this analysis possible. The anonymous referee provided a critical reading of the manuscript that helped improve the presentation and discussion.
References
- (1) Bernardi M., et al., 2003, AJ, 125, 1865
- (2) Browne, I. W. A., et al. 2003, MNRAS, 341, 13
- (3) Chae, K.-H. 2003, MNRAS, 346, 746
- (4) Chae, K.-H., et al. 2002, Phys. Rev. Lett., 89, 151301
- (5) Chae, K.-H., Chen, G., Ratra, B., & Lee, D.-W. 2004, ApJ, 607, L71
- (6) Chae, K.-H., & Mao, S. 2003, ApJ, 599, L61
- (7) Cohn, J. D., & Kochanek, C. S. 2004, ApJ, 608, 25
- (8) Fassnacht, C. D., et al. 1999, AJ, 117, 658
- (9) Fukugita, M., Futamase, T., & Kasai, M. 1990, MNRAS, 246, 24P
- (10) Gonzalez, A. H., Williams, K. A., Bullock, J. S., Kolatt, T. S., & Primack, J. R. 2000, ApJ, 528, 145
- (11) Helbig, P., Marlow, D., Quast, R., Wilkinson, P. N., Browne, I. W. A., & Koopmans, L. V. E. 1999, A&AS, 136, 297
- (12) Loewenstein, M., & White, R. E., III 1999, ApJ, 518, 50
- (13) Keeton, C. R., & Zabludoff, A. I. 2004, ApJ, 612, 660
- (14) King, L. J., Browne, I. W. A., Marlow, D. R., Patnaik, A. R., & Wilkinson, P. N. 1999, MNRAS, 307, 225
- (15) Kochanek, C. S., 1994, ApJ, 436, 56
- (16) Kochanek, C. S., 1996, ApJ, 466, 638
- (17) Kochanek, C. S., 2001, astro-ph/0108160
- (18) Madgwick, D. S. 2003, MNRAS, 338, 197
- (19) Madgwick, D. S., et al. 2002, MNRAS, 333, 133
- (20) Marzke, R. O., da Costa, L. N., Pellegrini, P. S., Willmer, C. N. A., Geller, M. J. 1998, ApJ, 503, 617
- (21) McKean, J. P., Koopmans, L. V. E., Browne, I. W. A., Fassnacht, C. D., Blandford, R. D., Lubin, L. M., & Readhead, A. C. S. 2004, astro-ph/0402116
- (22) Mitchell, J. L., Keeton, C. R., Frieman, J. A., & Sheth, R. K. 2005, ApJ, 622, 81
- (23) Myers, S., et al. 2003, MNRAS, 341, 1
- (24) Ofek, E. O., Rix, H.-W., & Maoz, D. 2003, MNRAS, 343, 639
- (25) Perlmutter, S., et al. 1999, ApJ, 517, 565
- (26) Riess, A. G., et al. 1998, AJ, 116, 1009
- (27) Rusin, D., Kochanek, C. S., & Keeton, C. R. 2003, ApJ, 595, 29
- (28) Sheth, R. K., et al. 2003, ApJ, 594, 225
- (29) Shimasaku, K. 1993, ApJ, 413, 59
- (30) Spergel, D. N., et al. 2003, ApJS, 148, 175
- (31) Treu, T., Koopmans, L. V. E. 2004, ApJ, 611, 739
- (32) Turner, E. L. 1990, ApJ, 365, L43
- (33) Winn, J. N., et al. 2000, AJ, 120, 2868
- (34) Winn, J. N., Lovell, J. E. J., Chen, H.-W., Fletcher, A. B., Hewitt, J. N., Patnaik, A. R., & Schechter, P. L. 2002a, ApJ, 564, 143
- (35) Winn, J. N., Morgan, N. D., Hewitt, J. N., Kochanek, C. S., Lovell, J. E. J., Patnaik, A. R., Pindor, B., Schechter, P. L., & Schommer, R. A. 2002b, AJ, 123, 10
- (36) Winn, J. N., Hewitt, J. N., Patnaik, A. R., Schechter, P. L., Schommer, R. A., López, S., Maza, J., Wachter, S. 2001a, AJ, 121, 1223
- (37) Winn, J. N., Hewitt, J. N., & Schechter, P. L. 2001b, in Gravitational Lensing: Recent Progress and Future Goals, ASP Conference Proceedings, Vol. 237, ed. T. G. Brainerd & C. S. Kochanek (San Francisco: ASP), p. 61
- (38) White, R. E., III, & Davis, D. S. 1998, in Galactic Halos: A UC Santa Cruz Workshop, ASP Conference Proceedings, Vol. 136, ed. D. Zaritsky, p. 299